Presented to Parliament pursuant to Section 36 (1) of the Climate Change Act 2008. This report was laid before Parliament on 24 June 2026.
This statutory report provides a comprehensive overview of the UK Government’s progress to date in reducing emissions.
Footnotes have been removed from the online version of this report. Please download the PDF for the footnoted version of this report.
Acknowledgements
The Committee would like to thank:
The team that prepared this report and its analysis. This was led by Emma Pinchbeck, James Richardson, Emily Nurse, Eoin Devane, Esther Harris, and Sam Karslake and included Audra Anderson, Rose Armitage, Owen Bellamy, Rose Bevan-Smith, Ari Biggart, Sandra Bogelein, Marta Calore, Rachel Carr-Whitworth, Jools Clarke, Freddy Curtis, Stephen Dillon, Bianca de Farias Letti, Victoria de la Cruz, Joshua Deru, Caitlin Douglas, Kim Dowsett, Kieron Driscoll, Shane Fernando, Elizabeth Fuller, Jamie Gittings, Ruth Gregg, Rachel Hay, Robbie Herring, Gemma Holmes, Ariana Jessa, Steffi Johns, Luke Jones, Miriam Kennedy, Adam Khan, Grace Macready, Fatima Manji, Luke Maxfield, Moryse McInniss, Aaron McMahon, Matthew Meakins, Richard Millar, Frances Molesworth, Bea Natzler, Sarah Nelson, Amarath Ou, Chris Parker, Emma Patterson, Jessie Peramal, Karina Rodriguez Villafuerte, Simon Rayner, Andrew Romang, Maria Reboredo Prado, Miranda Schroder, Rachel Sewell, Olivia Shears, Blánaid Sheeran, Bryony Sheridan, Thomas Smith, Rachael Steller, James Tarlton, Seán Taylor, Indra Thillainathan, Emma Vause, Sophie Vipond, Scarlett Walker, Eveline White, Hannah Williams, Kirsty Wivell, Louis Worthington, Fergal Wraith.
Our expert advisor, Professor Rebecca Willis.
Executive summary
The UK Government is not moving fast enough to reduce greenhouse gas (GHG) emissions and to protect households and businesses from volatile fossil fuel prices. The war in Iran has led to the second global fossil fuel price shock in just four years. In this uncertain geopolitical context, many countries are responding with plans to provide secure, homegrown energy by rapidly reducing dependency on fossil fuels. To do this in the UK, the Government needs a more ambitious plan to electrify the UK. This requires continued progress towards low-carbon electricity and an accelerated roll-out of electric vehicles (EVs), heat pumps, and industrial electrification.
The UK remains among a leading group of countries demonstrating sustained emissions reduction. The Government has set out its proposed level for the Seventh Carbon Budget, in line with our advice – a feasible, ambitious level. There has been positive action on low-carbon electricity over the past year, with record amounts of renewable capacity procured in the latest Contracts for Difference allocation round. However, while there have been some steps taken to reduce the costs of electricity, the Government’s plan for electrification lacks ambition. Indicators for some electric technologies are showing worrying signs: while electric car sales are keeping pace with government plans, electric van sales remain off track and the growth in heat pump installations in existing homes slowed significantly last year.
In October 2025, the UK Government published its Carbon Budget and Growth Delivery Plan (CBGDP), setting out its policies and plans for meeting carbon budgets. This plan projects slower emissions reductions for surface transport and buildings compared to the previous government’s plan. This reflects both slow prior progress in the roll-out of some technologies, as well as areas of reduced policy ambition. For example, the decarbonisation of public sector buildings and reduced support for low-income homes to electrify heating and install insulation. There is now a significant gap between the plan’s projected emissions reductions and the UK’s 2030 Nationally Determined Contribution (NDC) under the Paris Agreement, a commitment to reduce emissions by at least 68% compared to 1990 levels. Increasing ambition and achieving the 2030 NDC would put the UK on track to achieve its future carbon budgets and Net Zero by 2050, and send a strong international signal of commitment to delivery.
The slow pace of electrification is putting the UK’s climate targets at risk and is a missed opportunity to enhance UK energy security in the face of rising threats, leaving the UK exposed to geopolitical shocks. 93% of the UK’s emissions are now outside the electricity supply sector and around three-quarters of a typical household’s driving and home energy bills are from the direct use of fossil fuels in cars and gas boilers. Following the recent increase in fossil fuel prices, bills have increased almost four times more for a typical household with a gas boiler and a petrol car, compared to a household with a heat pump and an EV. For a rural household with an oil boiler and a diesel car, the increase is 10 times more.
Accelerating EV sales and heat pump installations beyond government plans would help address these challenges. It would keep the 2030 NDC in reach, improve the UK’s air quality, ease inflationary pressures from fossil fuel shocks, and reduce costs for consumers, giving them more spending power elsewhere in the economy. The UK could save up to 80 million barrels of oil and 1.5 billion therms of gas in 2030, which would cost almost £8 billion at current oil and gas prices. Electrification is the most effective form of energy efficiency: by 2050, the efficiency of a more electrified energy system would reduce wasted energy by around half compared to today.
Progress in other sectors, including agriculture, land use, and aviation, has also been too slow. In addition, the Government’s plan to achieve the Sixth Carbon Budget relies on a rapid ramp-up in engineered removals after 2030 but lacks detail on how this will be achieved.
The rate of global warming is at a record high, and the UK is already experiencing the impacts. Heatwaves have become hotter, longer, and more frequent. In 2026, the highest May temperature on record in the UK was recorded in Greater London. Early 2026 was exceptionally wet in parts of the UK, with long unbroken spells of rain leading to widespread flooding. The UK can end its contribution to ongoing global climate change by reaching Net Zero emissions and have a resilient transition that simultaneously considers actions to adapt to rising temperatures.
Key actions for electrification
Rapid progress over the next year is essential to keep the 2030 NDC in reach, with the pace of emissions reduction needing to almost double. To achieve this, the Government needs a more ambitious plan for electrification. It must urgently remove barriers facing households and businesses to transition to efficient, low-carbon electric technologies. Key actions for electrification include:
1. Make electricity cheaper. While progress has been made in the past year to remove some policy costs from electricity bills, this is not sufficient to incentivise many households and businesses to transition to low-carbon heating. Remaining policy costs should be removed from electricity bills for both households and non-residential users so that the greater efficiency of heat pumps compared to fossil fuel heating is reflected in lower bills. Lower bills would also improve the case for investing in the UK’s energy-intensive sectors.
2. Create the conditions for a more rapid transition to EVs. Propelled by the zero-emission vehicle (ZEV) mandate, the market continues to drive down the price of electric cars, allowing more households and businesses to benefit from the lower costs of EV ownership. With clear and consistent incentives and messaging, the adoption of electric cars can outpace current ambition, and the adoption of electric vans can catch-up. To flourish, the UK car industry needs to continue its pivot to the technologies of the 21st century. This requires the Government to stand firm behind the ZEV mandate and remove barriers to EV adoption. Crucial to this is increasing access to affordable charging, allowing the one-third of homes without access to off-street parking to benefit from lower running costs. It is also important to remove regulatory barriers and minimise any ‘hassle factor’ to consumers from the planned introduction of electric vehicle excise duty.
3. Accelerate the installation of heat pumps in buildings. The UK has one of the lowest market shares of heat pump installations in Europe (Figure 4). The Government must ensure installations accelerate in all segments of the market by:
- Urgently addressing the gap left by the closure of the Energy Company Obligation (ECO) scheme. In the last three years, this scheme accounted for around a third of retrofit heat pump installations in the UK, providing targeted support for low-income households. Without a sufficient replacement, installations could fall significantly this year.
- Removing any unnecessary barriers that make a heat pump harder to install than a gas boiler, so that low-carbon heating installations become the default choice by 2035. This could be done by: reducing regulatory barriers, addressing skills gaps, improving advice to households and businesses, and enabling market conditions which reduce installation costs.
- Introducing a comprehensive programme to decarbonise public sector buildings, following the closure of the Public Sector Decarbonisation Scheme. The Government should consider restricting the installation of fossil-fuel boilers in public buildings. Moving instead to low-carbon combined heating and cooling systems can both reduce fossil fuel dependency and protect vulnerable people from rising temperatures, as set out in the Climate Change Committee’s (CCC) Adaptation Committee report on A Well-Adapted UK, published earlier this year.
4. Deliver on industrial electrification. Exemptions to electricity network and policy costs will not be sufficient to incentivise industrial electrification on their own. The Government should now set out a plan to deliver its ambition for industrial electrification. This should confirm suitable use cases and establish the conditions necessary to make electrification the economically rational choice – addressing both capital and operating cost barriers.
Impacts of electrification on household energy costs
A typical UK household will see lower and less volatile bills overall if they have an EV and a heat pump, rather than a petrol car and a gas boiler, under current government policies (Figure 1). This is true for prices both before and since the start of the Iran war, with recent energy cost increases having strengthened this effect.
- Energy prices have risen since the start of the war. Given this, a typical household with a gas boiler and petrol car would save around £1,210 a year by installing solar panels and switching to a time-of-use tariff, a heat pump, and an EV. A rural household with an oil boiler and a diesel car could save around £1,880 a year, even without solar or time-of-use tariffs.
- The majority of savings come from the reduced running costs of electric cars. Most households would now save by switching to an EV, provided they are able to charge at home. However, high public charging costs mean this is not true for all households.
- The Warm Homes Plan increased government support for solar panels and heat pumps. With this support, installing solar panels, combined with time-of-use electricity tariffs available in the market, can make heat pumps cheaper than a gas boiler for a typical household.
- However, not all homes are suitable for solar panels or time-of-use tariffs, and many would not currently save from switching to a heat pump alone.
- Making electricity cheaper would enable many more households to save by switching to heat pumps, and would further reduce the UK’s exposure to volatile international gas markets.
- Installing low-cost insulation measures such as draught proofing and insulating hot water tanks can also help reduce household bills and emissions.
Historical progress in reducing emissions
GHG emissions in the UK fell by 1.8% in 2025 compared to the year before, reaching 407 MtCO2e, according to provisional estimates. Levels are now 50% lower than those seen in 1990. The first three carbon budgets (2008 to 2022) were achieved and emissions are well on track to achieve the Fourth Carbon Budget (2023 to 2027), with emissions in 2025 already lower than the annual average required over the remainder of the carbon budget period.
- There has been a long-term trend of emissions reduction in electricity supply, which has historically driven progress in reducing the UK’s emissions overall. The electricity supply sector is responsible for almost half of the emissions reduction since 2008 and has seen continuous progress in reducing both coal- and gas-powered generation, while renewable generation has increased. However, electricity supply emissions did not fall in 2025. While emissions from coal fell to zero that year, gas generation rose slightly, driven by a combination of factors including a fall in net imports of electricity and nuclear outages.
- Emissions in surface transport increased by 2.7% in 2025, according to provisional estimates. The incremental progress in the roll-out of EVs from year-to-year is likely to have been offset by other factors, such as increased vehicle-kilometres. However, the impact of EVs is apparent in longer-term trends – despite car-kilometres having almost returned to 2019 levels, car emissions are 12% lower than in 2019. Around half of this reduction is likely due to the uptake of EVs. As the UK’s highest emitting sector, it is essential to see these savings grow and begin to reduce emissions year-on-year, by accelerating the sale of EVs.
- Emissions in industry fell in 2025, largely due to the closure of the blast furnaces at Port Talbot steelworks in the second half of 2024. Construction has commenced to replace them with an electric arc furnace, supported by a £500 million government grant. However, there has been limited progress on wider industrial electrification.
- Emissions also fell in fuel supply and buildings – the latter despite colder winter months in 2025 than the year before. This could be from high energy prices continuing to reduce energy demand. The number of heat pumps currently being installed is not yet enough to have a significant effect on emissions.
- Emissions in aviation fell slightly, by 0.5%, in 2025, despite a 3% increase in passenger-kilometres. This is likely due to efficiency improvements from recent changes to the aircraft fleet and a small contribution from sustainable aviation fuel (SAF) uptake.
- Emissions in agriculture and land use have not fallen significantly in recent years. While reductions in livestock numbers led to a reduction in methane emissions between 2022 and 2024, this was offset by an increase in CO2 emissions in these sectors. This was in part driven by a smaller forestry sink due to an aging woodland profile and removal of trees for habitat restoration priorities.
The UK Government’s Carbon Budget and Growth Delivery Plan
The UK Government’s Carbon Budget and Growth Delivery Plan (CBGDP) sets out its policies and plans to meet the Fourth Carbon Budget (2023 to 2027), Fifth Carbon Budget (2028 to 2032), and Sixth Carbon Budget (2033 to 2037). The CBGDP supersedes the previous government’s 2023 Carbon Budget Delivery Plan (CBDP).
- Emissions in the CBGDP reduce more slowly in the surface transport and buildings sectors compared to the CBDP, and the CBGDP pathway falls short of meeting the 2030 NDC – while the UK Government states that it “is committed to delivering [this target]”.
- The 2030 NDC is the first of the UK’s targets in line with Net Zero and achieving it would put the UK on track to achieving the Sixth Carbon Budget. The Fourth and Fifth Carbon Budgets were set before the UK had a Net Zero target and will need to be overachieved.
- The success of the Paris Agreement relies on countries making best efforts to achieve their NDC targets. The UK has a reputation for international leadership which has helped drive progress in tackling climate change at the global level. Having set an ambitious target for 2030, it would send a strong signal to deliver on it.
While nearly half of the emissions reductions seen to date have been in electricity supply, the CBGDP makes clear that action now needs to broaden across a wider range of sectors (Figure 2).
- The Government’s pathway relies predominantly on electrification and further expansion of low-carbon electricity supply to meet the carbon budgets.
- Around half of the emissions reductions in the Government’s pathway to 2030 are in the surface transport, buildings, and industry sectors. Uptake of EVs, heat pumps, and other electric technologies will be the key driver of this change. There is potential for the Government to go faster and keep the 2030 NDC in reach.
- The Government’s pathway relies on a rapid ramp-up in engineered removals to meet the Sixth Carbon Budget, with removals contributing 17% of emissions reductions over the period 2031 to 2037. But the plan lacks detail on how this will be achieved. Given the risk with this approach, a clear strategy for how this scale-up will be delivered and how progress will be monitored is needed. This should also be linked with contingency plans.
The Government should have a more ambitious plan to accelerate electrification. This would keep the 2030 NDC within reach, increase delivery confidence for the Sixth Carbon Budget, enhance energy security, and allow households and businesses to benefit from more stable energy prices.
- With new EVs nearing price parity with equivalent petrol cars, and having reached it in some segments of the market, there is a particular opportunity to deliver a more rapid transition to electric driving.
- The CBGDP pathway for heat pump installations is unambitious compared to the market growth rates that have been seen in other European countries. With the right mechanisms and market signals in place, there is scope for heat pump deployment to go faster in both residential and non-residential buildings.
- The Government could also consider more steps to encourage modal shift and low-cost insulation measures in buildings, which would reduce emissions and demand for fossil fuels.
Assessment of delivery and policy progress
We have assessed the credibility of the Government’s policies and plans to deliver the emissions reductions set out in the CBGDP. When doing this, we consider progress on a range of delivery indicators, assessing whether the combined actions of governments and markets are delivering the changes needed.
There has been some positive progress over the past year – especially in low-carbon electricity deployment, continued growth in EV sales, increases in peatland restoration rates, and the publication of key government strategies such as the Warm Homes Plan, the Land Use Framework for England, the Clean Energy Jobs Plan, and the Energising Britain public participation strategy.
- The UK is halfway through the Fourth Carbon Budget (2023 to 2027) and is well on its way to achieving it. This shows good progress from both the current and previous governments. There are also credible policies in place to achieve the Fifth Carbon Budget (2028 to 2032).
- However, these budgets were set before the UK had a Net Zero target and achieving them does not set the country on the appropriate path to achieve the 2030 NDC, the Sixth Carbon Budget, or Net Zero emissions by 2050. These budgets must therefore be over-achieved.
- For the 2030 NDC and Sixth Carbon Budget (2033 to 2037), progress has been too slow, with insufficient focus on electrification and limited progress in other sectors. The Government’s plan carries significant risks in some sectors and does not achieve the 2030 target.
Meeting the 2030 NDC would require emission to fall to 291 MtCO2e by 2030. In our assessment, we find that credible plans or plans with only some risks would be sufficient to reduce emissions to 356 MtCO2e by 2030, which is equivalent to a 60% reduction on 1990 levels when international aviation and shipping emissions are excluded (as they are in the 68% reduction required to achieve the 2030 NDC). This is around an 11 MtCO2e improvement compared to our assessment last year. Among these, the proportion covered by credible plans has also increased since last year’s assessment (Figure 3).[1] This leaves a shortfall of 64 MtCO2e of further emissions reductions required to achieve the 2030 NDC, which we assess as being covered by plans with significant risks, insufficient plans, or which are not covered in the Government’s pathway.
- Credible plans exist for 44% of the required emissions reductions. The majority of credible plans relate to emissions savings from the continued roll-out of renewable electricity generation and EVs. There are also contributions from low-carbon heating in new builds and heat pump installations funded under the Boiler Upgrade Scheme, electrification of steel production at Port Talbot, and a proportion of SAF uptake covered by the SAF mandate.
- There are some risks attached to 15% of the required emissions reductions. Key policies and proposals with some risks include policies to decarbonise heavy goods vehicles, the delivery of additional renewable generation beyond that contracted, peatland restoration, and reducing waste in landfill. There are also some risks around the Government’s reliance on cascade effects, for example, where a household switching to an EV may be more likely to get a heat pump.
- There are significant risks attached to 19% of the required emissions reductions. This includes policies relating to low-carbon heating in homes beyond existing grant schemes, the decarbonisation of steel production at Scunthorpe steelworks, second- and third- generation SAF supply, and agriculture policies. It also includes the CBGDP’s reliance on wider factors relating to technological optimisation to bring down emissions.
- Insufficient plans exist for 4% of the required emissions reductions. This includes low-carbon heating in public and commercial buildings and in low-income homes, following the closure of the ECO scheme. It also includes a significant proportion of the electrification of industry.
- The remaining 17% of the required emissions reductions are not covered by the CBGDP policies and plans. This reflects the fact that the CBGDP pathway does not achieve the 2030 NDC. The Government will need to bring forward additional policies and plans to make up this gap, for example increased ambition in the roll-out of EVs and heat pumps.
Our assessment is similar for the Sixth Carbon Budget, with around three-fifths of the required emissions reduction covered by credible plans or plans with some risks attached. This represents a slight improvement compared to our assessment last year.
- Unlike for the 2030 NDC, the pathway does achieve the Sixth Carbon Budget. But this is largely achieved through additional measures where we have assessed there to be significant risks or insufficient plans. This means that the proportion of emissions reductions covered by insufficient plans increases significantly to 17% over the Sixth Carbon Budget period. This is partly due to the steep ramp-up in engineered removals in the 2030s, without detail on how to deliver it, and the reliance on international carbon credits to offset international aviation emissions. There are also increasing contributions in industry and buildings.
Progress in key sectors
While the UK continues to make substantial positive progress in decarbonising electricity supply, progress is more mixed in electrifying the three key end-use sectors – surface transport, buildings, and industry. However, in each of these areas, market developments and progress seen either in the UK or internationally give us confidence that progress can be made quickly. Progress is also mixed in the other key sectors of agriculture and land use and aviation. Delivery of engineered removals is a high risk to achieving the carbon budgets.
Surface transport
Surface transport remains the UK’s highest emitting sector, and while EV sales are continuing to grow, an acceleration is needed. The ZEV mandate plays a key role in underpinning and reinforcing market developments towards large-scale uptake of EVs and enabling investment in supporting infrastructure. Despite some weakening of incentives, it continues to be effective at increasing the choice and affordability of electric cars on the market, without any manufacturer penalties being incurred. It is essential that this year’s review of the mandate does not lead to further concessions. Doing so would severely undermine prospects of achieving the UK’s 2030 NDC, exacerbate the UK’s dependence on imported oil, and leave more households paying the higher costs of petrol or diesel cars.
- Electric cars: nearly one in four new car sales were EVs in 2025 and the number of EVs on the road increased by 41% in the year to April 2026 – surpassing 2 million for the first time. Sales will need to accelerate fast in the coming years for the UK to get on track to achieve its 2030 NDC. This is possible provided the Government stands firm.
- Underpinned by reducing costs in global supply chains, increasing competition, and the ZEV mandate, the price of EVs continues to fall. The average purchase price premium of an electric car relative to a petrol equivalent reached 16% in 2025, down from 24% the year before. Price parity has been met in certain car segments.
- To support the market continuing to grow, the Government has introduced the Electric Car Grant, providing a discount for qualifying car models under £37,000, and launched the ‘Get that electric feeling’ public engagement campaign, communicating accurate information on the benefits of EVs.
- The Government announced a new three pence per mile tax on EVs effective from April 2028. This is around half the effective rate of tax paid by petrol cars through fuel duty and will not change the fact that – for households which are able to charge at home – EVs offer significant running cost savings. However, this potentially introduces an additional administrative burden and confuses signals to consumers on the benefits of EV ownership. It is essential that this new tax is implemented in a straightforward manner without creating significant additional hassle for consumers.
- Several policy decisions in the past year retain incentives for plug-in hybrids (PHEVs) based on emissions factors which underestimate real-world emissions. These have coincided with PHEVs gaining an increased market share. Providing incentives for emissions savings that PHEVs do not deliver distorts the market and risks eating into the demand for EVs.
- Electric vans: while sales of electric vans grew by more than one-third year-on-year to reach 9.5% of the market in 2025, this remains below the ZEV mandate headline target. Technology development is helping to reduce barriers to electric van adoption, but further action on regulatory reforms and increased charging access is also needed.
- Charge points: there has been continued growth in the number of public charge points, which increased by 19% in 2025 to reach 88,000. The biggest increase has been in ultra-rapid devices and charge points located along the strategic road network. However, public charging costs remain high. The Government plans to allow cross-pavement charging gullies under permitted development rights to widen access to home charging. The Government has also committed to review the cost of public charging – this review must identify further ways to reduce costs for those who rely on local public charge points for their everyday charging.
Buildings
Currently, fewer than 2% of homes are heated with a heat pump in the UK. This is among the lowest in Europe. A low ratio of electricity-to-gas prices is a key enabler supporting households and businesses to switch to heat pumps in many countries (Figure 4).
There has been some positive progress for buildings with the publication of the Warm Homes Plan and the Future Homes Standard. However, plans are insufficient for the scale-up of low-carbon heating installations in existing homes required over the next decade, and growth slowed last year. There remain significant gaps in the market, particularly in public and commercial buildings and in low-income homes following the closure of the ECO scheme.
- Low-carbon heating in existing homes: around 52,000 heat pumps were installed in existing homes in 2025, an increase of 7% compared to 2024. This is a significant slow-down in growth compared to the 56% growth seen the year before.
- The Warm Homes Plan aims for 450,000 heat pump installations per year by 2030, of which around 250,000 are expected to be retrofit. Installation rates will need to be higher than this to deliver the emissions reductions in the CBGDP. While the annual growth rate required to deliver this is significantly higher than that seen in 2025, growth rates seen in other European markets, and in the UK between 2023 and 2024, suggest that higher numbers of installations could be achievable.
- The Government has closed the ECO scheme, which delivered around one-third of retrofit heat pump installations over the past three years. The slower overall growth in 2025 was driven by a reduction in installations under ECO. While the Warm Homes Plan has committed overall funding of £1 billion per year to support upgrading the homes of low-income households, this is a significant decrease in investment, and the Government is yet to set out details of how this funding will be spent.
- Despite progress in removing some policy costs from electricity bills in the 2025 Budget, the ratio of electricity to gas prices for households remains a major barrier to heat pump uptake. The Warm Homes Plan laid out a vision to promote installation of rooftop solar and batteries alongside a heat pump, as well as uptake of time-of-use energy tariffs, to reduce running costs. While this approach will strengthen incentives for many households by enabling them to access cheaper power, it will not be suitable for all premises. Other key barriers – including upfront costs and non-financial barriers – also remain significant and must be addressed to enable faster heat pump uptake.
- Low-carbon heating in new buildings: in March 2026, the Government announced that regulations have been put in place to implement the Future Homes Standard and Future Buildings Standard. This requires all new buildings in England and Wales to be constructed with low-carbon heating, with regulations coming into force in 2027, subject to a 12-month transition period. Despite delays, this is a positive step forward that will soon ensure that no new buildings are being constructed with fossil fuel heating systems.
- Low-carbon heating in existing public and commercial buildings: the Government has announced the closure of the Public Sector Decarbonisation Scheme, which means that there is now no dedicated funding for the decarbonisation of the public estate. In addition, there has been no action to address the electricity-to-gas price ratio for non-residential users, and no plans have been put in place for incentivising decarbonisation in commercial buildings.
Industry
There has been good progress in specific areas of industry, but the route to electrification of industrial heat remains unclear for large parts of the market. The Government has set the intention to make electrification the economically rational choice for a wider range of businesses – it urgently needs a plan to deliver on this ambition for competitive, electrified industries. This requires clarity on which industrial use cases electrification is deemed suitable for, and an assessment of the commercial conditions needed to deliver those.
- Industrial electrification: while work to electrify the Port Talbot steelworks is underway, there is no evidence of progress on widespread electrification of industrial heat.
- High electricity prices relative to gas remain a major barrier, with industrial electricity-to-gas price ratios still above 4:1 for many large users. Schemes such as the Supercharger programme reduce this ratio to just above 2:1 for around 500 energy-intensive businesses, with broader reforms for a larger number of manufacturers expected to reduce ratios to around 3.5:1 by 2027. However, it is unclear whether this will be sufficient to drive electrification at scale.
- Carbon capture and storage (CCS): positive steps include £9.4 billion of funding allocated for CCS at the 2025 Spending Review, final investment decision being reached for the first CO2 capture facility at a UK manufacturing site, and the construction of CO2 transport and storage infrastructure starting at both Track-1 clusters. However, uncertainty remains beyond these initial projects.
Electricity supply
There has been positive progress in the electricity supply sector over the past year, with record amounts of renewable generation contracted. Important steps have been taken to remove planning barriers and reform the grid connections process. The UK is firmly on a path to a very low-carbon electricity system by the start of the Sixth Carbon Budget period. However, there are policy risks to decarbonising electricity supply rapidly enough to achieve the 2030 NDC. These include ensuring sufficient renewable capacity and timely and cost-effective transmission network build. Effective use of system flexibility (including through the successful implementation of Market-wide Half Hourly Settlement reform) is critical for efficient markets and networks, and has potential to offer some contingency against delays.
- Offshore wind: in 2025, 0.7 GW of new offshore wind capacity was added, bringing total UK capacity to 16.6 GW. The existing pipeline of contracted projects, including the record 8.4 GW contracted in the Contracts for Difference Allocation Round Seven (AR7), is expected to see this capacity more than double to around 37 GW. Further additions will be needed to achieve the Government’s stretching goals for offshore wind. If delivery times cannot be shortened to meet these goals, additional generation capacity from other technologies will need to accelerate to help make up for the shortfall in low-carbon generation required to achieve the Government’s targets.
- Onshore wind: 0.3 GW of new onshore wind capacity was added in 2025, bringing total UK capacity to 16.4 GW. Average annual deployment of between 2.1–2.5 GW will be required up to the end of the decade to meet the Government’s ambition.
- Solar PV: 2.8 GW of solar PV capacity was added in 2025, bringing the total to 21.7 GW. This was the highest annual solar PV deployment since 2015 and represented the third successive year of strong growth. Average annual deployment will need to increase to around 5 GW up to the end of the decade to achieve the Government’s ambition. There is a strong pipeline of upcoming large-scale solar projects, with 4.9 GW contracted in AR7.
- The Government’s ambition to triple the number of homes with rooftop solar panels by 2030 would represent a significant step change in small-scale deployment. If realised, this would contribute around 50% of the total cumulative deployment needed to meet its ambitions for overall solar PV capacity in 2030.
- Network and storage infrastructure: expanding and modernising electricity networks, ensuring they are resilient to future climate change, and deploying storage are key to electricity supply decarbonisation and wider electrification. Progress has been made, including new funding settlements for transmission networks and reforms to the connections queue, alongside a record 2 GW of new grid-connected battery storage estimated as being installed in 2025. The National Electricity System Operator needs to make faster progress in optimising the utilisation of the cheapest and cleanest available resources.
Agriculture and land use
There has been some progress in key indicators for agriculture and land use, with several trends moving in the right direction. Further action will be needed to sustain delivery and close remaining gaps, building on the land use frameworks which now exist in England, Scotland, and Wales. Further action must also be mindful of the changing climate to ensure that measures can deliver for climate adaptation as well as mitigation.
- Livestock numbers and agricultural emissions: cattle and sheep numbers fell by 1% and 2% respectively in 2025, continuing a longer-term trend and reaching their lowest levels since 1990.
- Household beef and lamb purchases fell by 5% in 2025, with a longer-term reduction of 9% since 2021, likely driven by high beef and lamb prices and cost-of-living pressures.
- The Sustainable Farming Incentive in England is to be reopened in June 2026, and the 25-year Farming Roadmap is expected to be published this year. Along with various other new funding streams, these present an opportunity to incentivise farmers to diversify actions needed for emissions reduction, while producing food in a sustainable and resilient manner.
- Peatland restoration: there has been strong progress in restoring peatlands, with around 21,400 hectares restored in 2025. This is a 26% increase on the previous year and roughly three times the level in 2020. All UK nations currently have grant funding for peatland restoration in place until at least 2027.
- Woodland creation: progress on woodland creation is more mixed, with planting rates falling by 25% in 2024/25, following a significant increase the year before. This reduction was driven by funding cuts in Scotland, which continues to lead in the establishment of new woodlands for the UK, planting more than half of the total in 2024/25. Planting rates have increased in England, and a new plan setting out Defra’s approach to woodland creation is expected this year.
Aviation
There has been mixed progress in reducing emissions from aviation. Policy development has strengthened confidence in the delivery of SAF, but the inclusion of international credits in the Government’s plan to meet the Sixth Carbon Budget puts the sector’s emissions reductions at increased risk. Further action will be needed to ensure that international aviation emissions reduce in line with the CBGDP, and contingency plans should be developed to mitigate the risks the sector faces, including on demand management.
- Emissions and demand: it is positive that the high emissions growth rate observed between 2022 and 2024 has slowed down, with emissions decreasing slightly in 2025 despite a 3% increase in passenger-kilometres. However, it is too early to say whether aviation emissions will grow, plateau, or decrease in the future.
- Sustainable aviation fuel: achievement of the SAF mandate in 2025 and implementation of the Sustainable Aviation Fuel Act (2026), which will enable a SAF revenue certainty mechanism, represent positive progress towards ensuring SAF incentivisation and delivery. However, significant challenges remain around scaling up supply, particularly for second-generation biofuels and third-generation power-to-liquid fuels, which must begin to contribute from 2027 and 2028 respectively.
- Carbon Offsetting and Reduction Scheme for International Aviation (CORSIA) credits: the Government’s pathway includes the use of international carbon credits under CORSIA to achieve emissions targets in the Sixth Carbon Budget period for the first time. This introduces significant risk, including uncertainty over the availability and quality of high-integrity credits.
Engineered removals
The Government’s CBGDP pathway relies on a steep scale-up of engineered removals in the Sixth Carbon Budget period. There has been progress through the finalisation of the Greenhouse Gas Removals Business Model, confirmation of plans to integrate engineered removals into the UK Emissions Trading Scheme, and the first engineered removals project reaching final investment decision. The independent Whitehead Review also set out recommendations to accelerate deployment. However, considerable risks remain, including a lack of clarity on long-term funding. Given the high reliance on engineered removals in the Government’s plan, it is essential that the Government develops a strategy for how these will be delivered and how progress will be monitored, with sufficient contingency plans put in place for any shortfall.
Conclusion
The UK can hit its upcoming emissions reduction targets, and remain on track for Net Zero, while simultaneously increasing energy security and protecting households and businesses from volatile energy prices – but only with urgent further policy action. With a significant gap between the Government’s plan and the 2030 NDC, the coming year is absolutely crucial for the next phase of the transition. If sufficient progress on electrification is not made in the next year, the 2030 NDC may become out of reach and there would be significant risks for both the Sixth Carbon Budget and reaching Net Zero by 2050.
The rest of this report is set out in five chapters:
- Progress in reducing UK emissions.
- The Carbon Budget and Growth Delivery Plan.
- Indicators of current delivery progress.
- Assessment of policy progress.
- Household costs and savings.
We list our priority recommendations to the UK Government, the Northern Ireland Executive, and the Welsh Government in Annex 1.[2] We set out our policy assessment criteria in Annex 2.
Chapter 1: Progress in reducing UK emissions
In this chapter, we review emissions data based on final 2024 data and provisional 2025 data and look at drivers for trends. We also review the international context for UK action.
Our key messages are:
- UK greenhouse gas (GHG) emissions: emissions were 407 MtCO2e in 2025, including the UK’s share of international aviation and shipping (IAS).
- Emissions are now 50% below 1990 levels. There has been a long-term trend of emissions reductions in electricity supply, which has historically driven progress.
- It is now highly likely that the Fourth Carbon Budget (2023 to 2027) will be achieved. Over 2026 and 2027, average annual emissions excluding IAS must be below 413 MtCO2e to achieve the Fourth Carbon Budget; emissions in 2025 were 11% lower than this.
- Change from 2024 to 2025: emissions fell by 1.8% (7.3 MtCO2e) compared to 2024, marking the eleventh consecutive year of reductions, not counting the COVID-19 pandemic years.
- Despite driving progress historically, electricity supply emissions did not fall in 2025. While emissions from coal fell to zero, gas generation rose slightly – driven by a combination of factors, including a fall in net imports of electricity and nuclear outages.
- Emissions in surface transport increased by 2.7% in 2025 according to provisional estimates. The incremental progress in the roll-out of electric vehicles (EVs) from year-to-year is likely to have been offset by other factors such as increased vehicle-kilometres. However, the impact of EVs is apparent in longer-term trends – despite car-kilometres having almost returned to 2019 levels, car emissions are 12% lower than in 2019. Around half of this reduction is likely due to the uptake of EVs.
- Economy wide, emissions continued to fall due to reductions in industry (a large part of which was the closure of the blast furnaces ahead of electrification at Port Talbot), fuel supply, and buildings, despite colder winter months than the year before.
- Emissions in Scotland, Wales, and Northern Ireland: emissions fell in Scotland and Wales but were mostly unchanged in Northern Ireland in 2024. Reductions in Wales were significant, due to the closure of the Port Talbot blast furnaces ahead of electrification.
- Climate change in the UK: the rate of global warming is now at a record high, and the UK is already experiencing the impacts. Heatwaves have become hotter, longer, and more frequent. Early 2026 was exceptionally wet in parts of the UK, with long unbroken spells of rain leading to widespread flooding. In its report on A Well-Adapted UK, the Climate Change Committee’s (CCC) Adaptation Committee offers advice on potential solutions to address these risks.
- International progress: in a volatile geopolitical context, the UK remains among a leading group of countries demonstrating sustained decarbonisation ambition and delivery. Alongside the UK, many economies, including the European Union (EU), India, Japan, the Philippines, and Turkey, are responding to the Iran war with plans which will accelerate the transition away from fossil fuels.
1.1 UK territorial emissions
1.1.1 Overall UK emissions
Total greenhouse gas emissions in the UK have been falling steadily since 1990 (Figure 1.1). Including its share of emissions from international aviation and shipping (IAS), which will count towards the Sixth Carbon Budget and later carbon budgets following legislation being laid in Parliament in 2026, the UK is now halfway to Net Zero emissions (see Table 1.1).
The UK has achieved its first three carbon budgets, and emissions reductions are on track to achieve the Fourth Carbon Budget. Progress in policy towards later carbon budgets, which are entirely in the future, is discussed in Chapter 4.
Final emissions in 2024
Final emissions for 2024 were 415 MtCO2e including IAS, which is 49% below 1990 levels.[3];[4] This is a 7.7 MtCO2e (-1.8%) change from 2023.
The change between 2023 and 2024 was driven by the electricity supply and industry sectors (Figure 1.2a).
- Electricity supply showed the largest sectoral emissions reduction, accounting for a decrease of 7.4 MtCO2e (19.6%). This was driven primarily by a 14.4 TWh reduction in gas generation year-on-year, as well as a 1.7 TWh reduction in coal generation.
- Industry accounted for a decrease of 3.6 MtCO2e (7.3%). This was predominantly due to the temporary closure of Port Talbot steelworks, while an electric arc furnace is being built for low-carbon steelmaking.
- These reductions were partly offset by increases in other sectors, such as buildings, whose emissions increased by 3.5 MtCO2e (4.7%), and aviation, whose emissions increased by 2.7 MtCO2e (7.8%).
Provisional emissions in 2025
Provisional emissions for 2025 were 407 MtCO2e, including IAS, which is 50% lower than 1990.[5] This is a 7.3 MtCO2e (-1.8%) change from 2024. Excluding IAS, emissions were 366.6 MtCO2e, which is 54% lower than 1990. This is a 6.8 MtCO2e (-1.8%) change from 2024.
The main driver of the reduction between 2024 and 2025 was a 5.4 MtCO2e (12%) fall in emissions in the industry sector, with significant contributions from fuel supply and buildings, the latter being despite colder winter months in 2025 than the year before (Figure 1.2b). In contrast, emissions in surface transport increased by 2.8 MtCO2e (2.7%) in 2025. The drivers of these changes are given in the following sections.
Total provisional emissions estimates have varied from final estimates by up to 2% in recent years (although the differences are generally much less than this). This has a small impact on our findings on overall emissions but can affect conclusions on year-to-year changes. Figure 1.3 shows the changes in emissions between 2023 and 2024 for key sectors, according to the provisional and final emissions estimates.
Emissions over the Fourth Carbon Budget period
It is now highly likely that the Fourth Carbon Budget will be achieved. The Fourth Carbon Budget is 1,950 MtCO2e, of which 1,124 MtCO2e has been used up in 2023 to 2025. This leaves an average annual amount of 413 MtCO2e for the remaining two years. Provisional 2025 emissions (excluding IAS, as the Fourth Carbon Budget excludes IAS) are already 11% lower than this.
| Table 1.1 UK territorial emissions and emissions changes for selected periods |
|||
|---|---|---|---|
| Period | Including IAS | Excluding IAS | |
| Emissions (MtCO2e) | 1990 | 815 | 793 |
| 2008 | 697 | 653 | |
| 2023 | 422 | 384 | |
| 2024 | 415 | 373 | |
| 2025 | 407 | 367 | |
| Reduction in emissions (MtCO2e, %) | 1990–2025 | 408 (50%) | 427 (54%) |
| 2008–2025 | 290 (42%) | 286 (44%) | |
| 2023–2024 | 7.7 (1.8%) | 11 (2.7%) | |
| 2024–2025 | 7.3 (1.8%) | 6.8 (1.8%) | |
| Annual average reduction (MtCO2e, %) | 1990–2025 | 13 (2.0%) | 12 (2.2%) |
| 2008–2025 | 17 (3.1%) | 17 (3.3%) | |
| Source: Department for Energy Security and Net Zero (DESNZ) (2026) Provisional UK greenhouse gas emissions statistics 2025; DESNZ (2026) Final UK greenhouse gas emissions national statistics: 1990 to 2024; CCC analysis. Notes: ‘IAS’ refers to the UK’s share of emissions from international aviation and shipping. |
|||
| Figure 1.1 The UK’s historical emissions and targets |
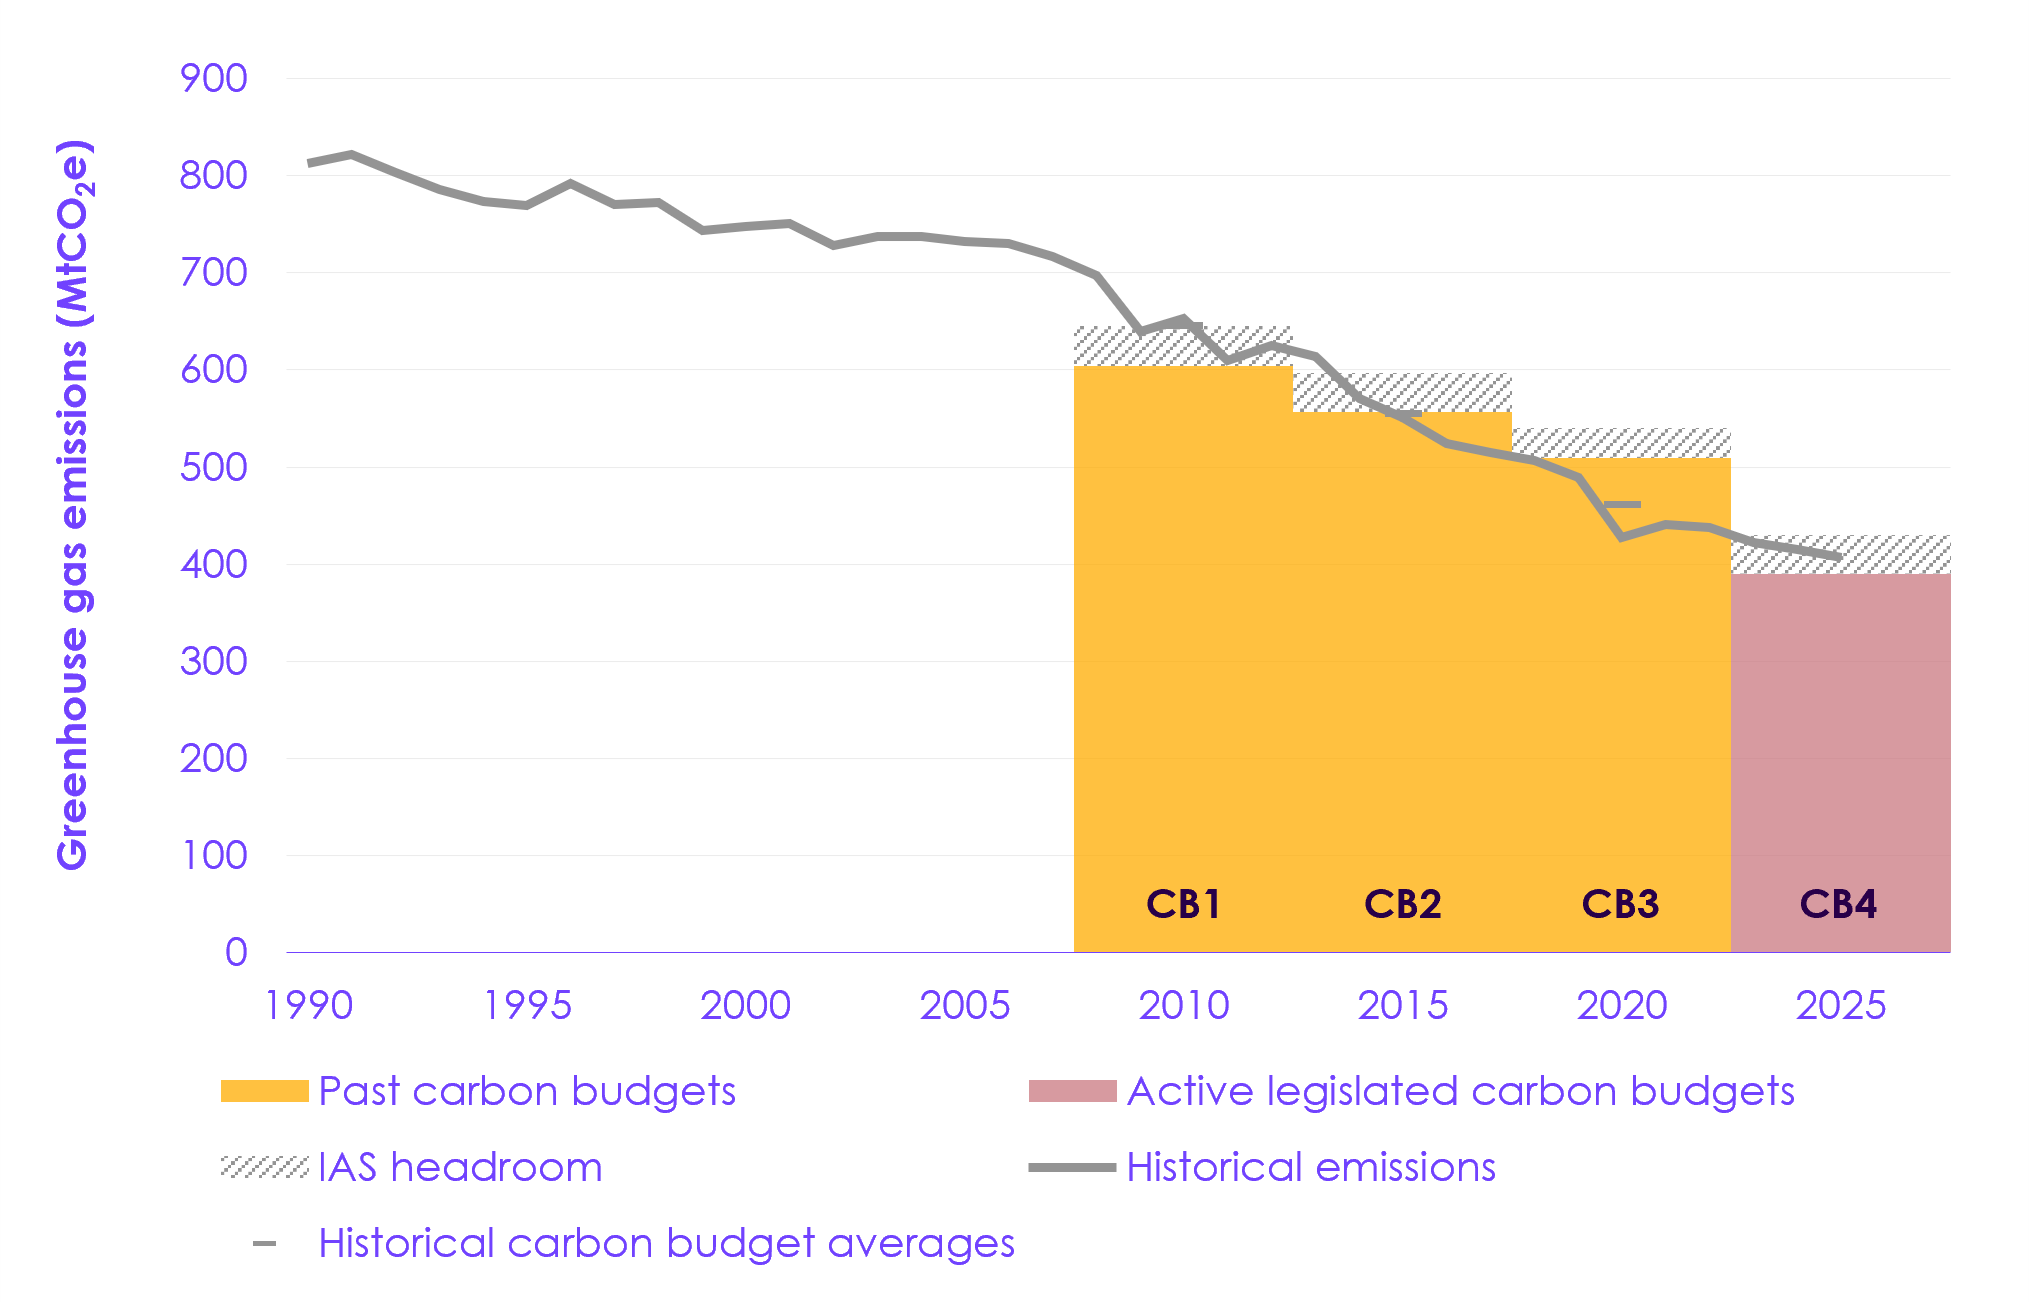 Description: UK emissions have halved since 1990, and the UK achieved its first three carbon budgets. Source: Department for Energy Security and Net Zero (DESNZ) (2026) Provisional UK greenhouse gas emissions statistics 2025; DESNZ (2026) Final UK greenhouse gas emissions national statistics: 1990 to 2024. Notes: (1) Emissions from international aviation and shipping (IAS) are included in historical emissions. (2) ‘CB’ refers to the UK’s carbon budget. ‘CB1’ refers to the First Carbon Budget; subsequent numbers refer to subsequent carbon budgets. |
| Figure 1.2 Changes in UK emissions across key sectors |
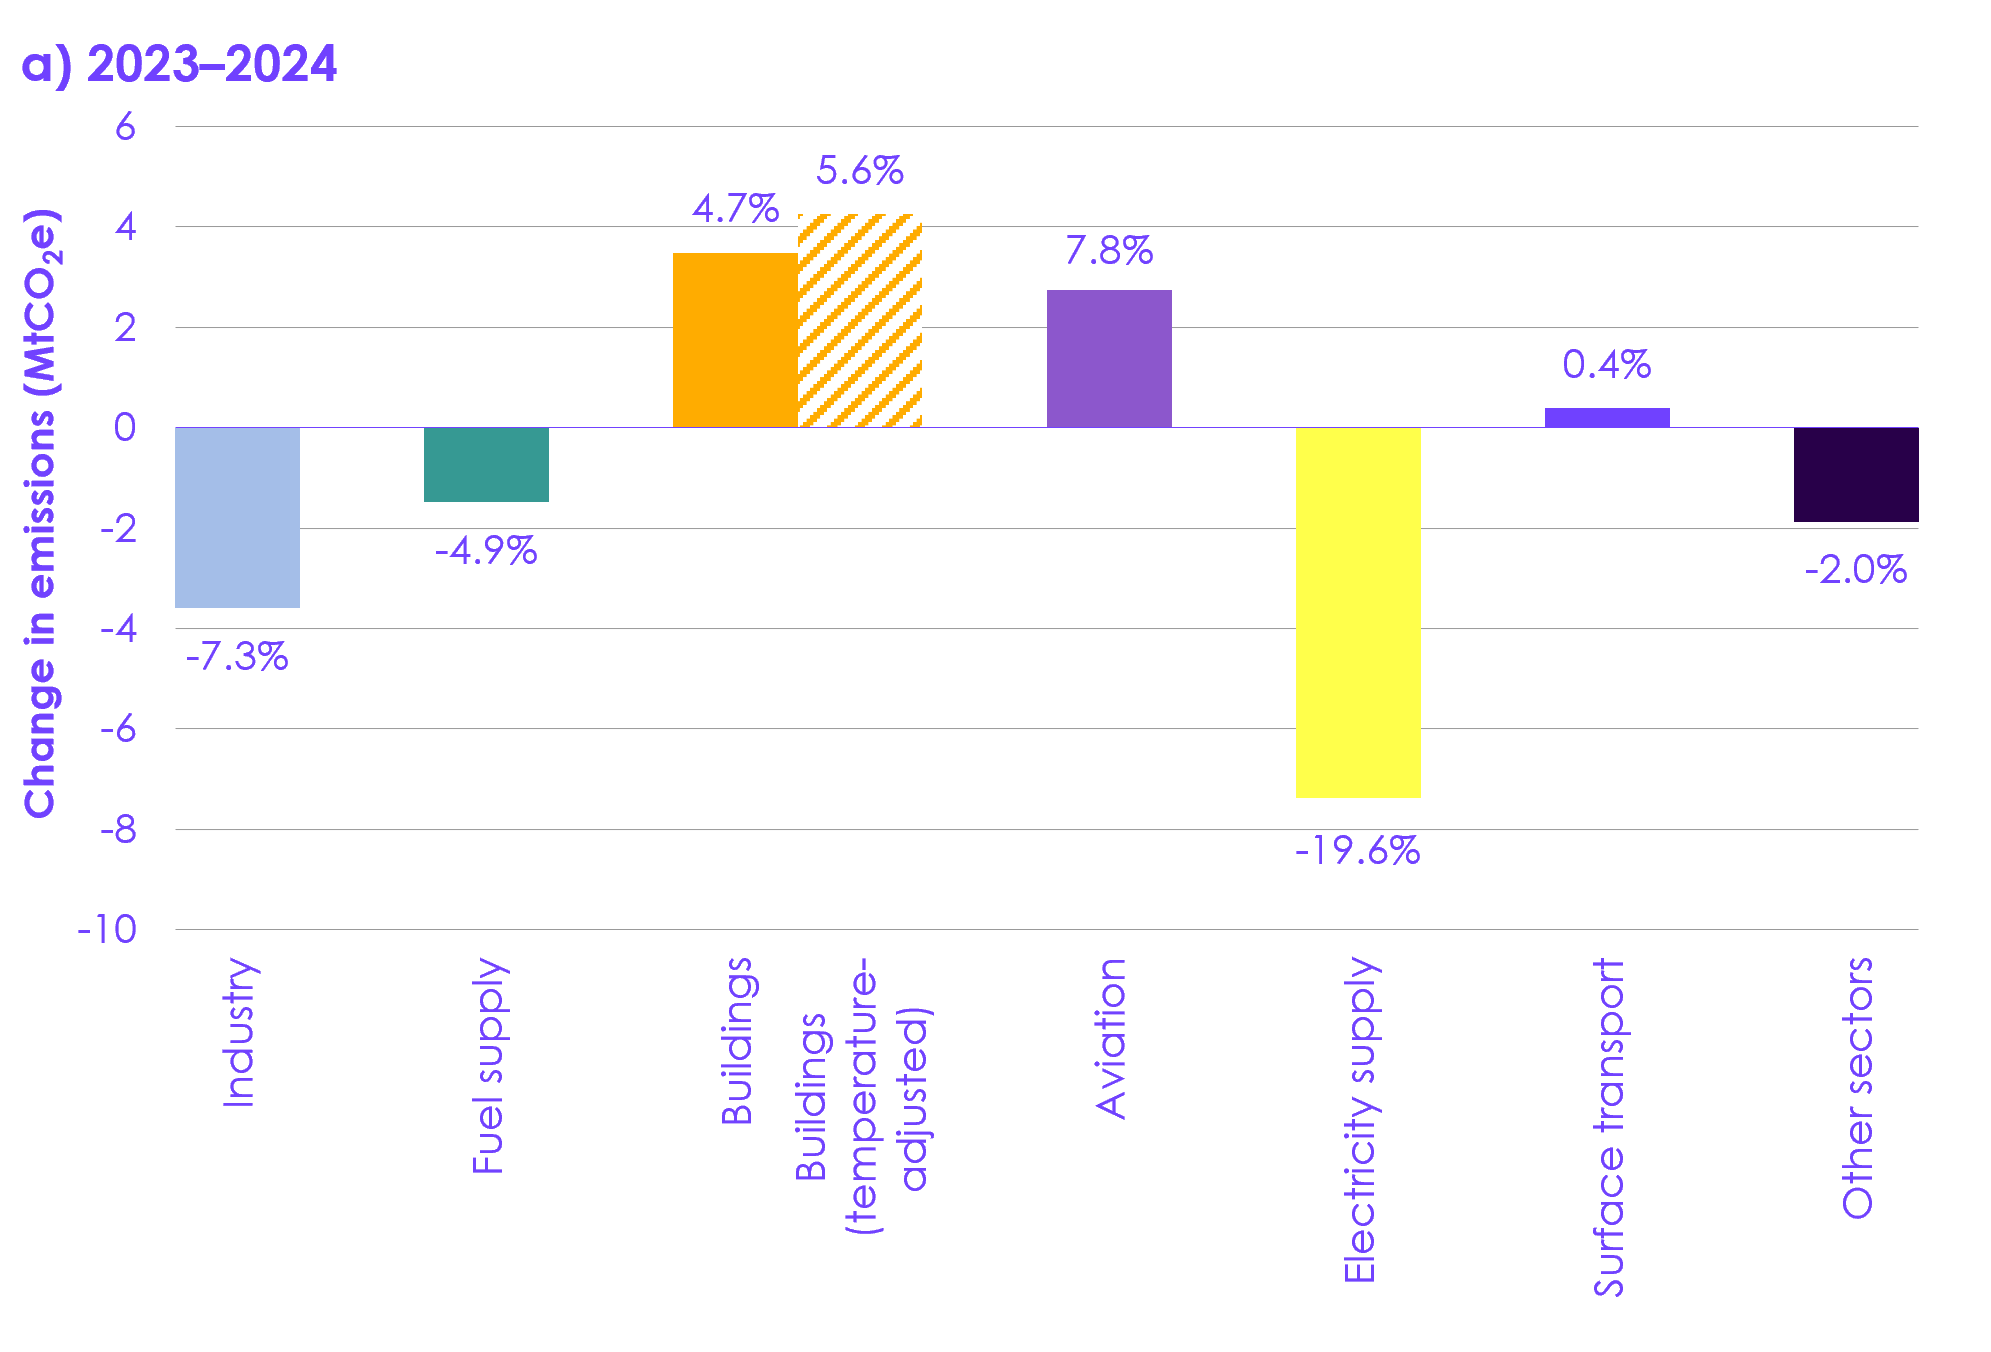 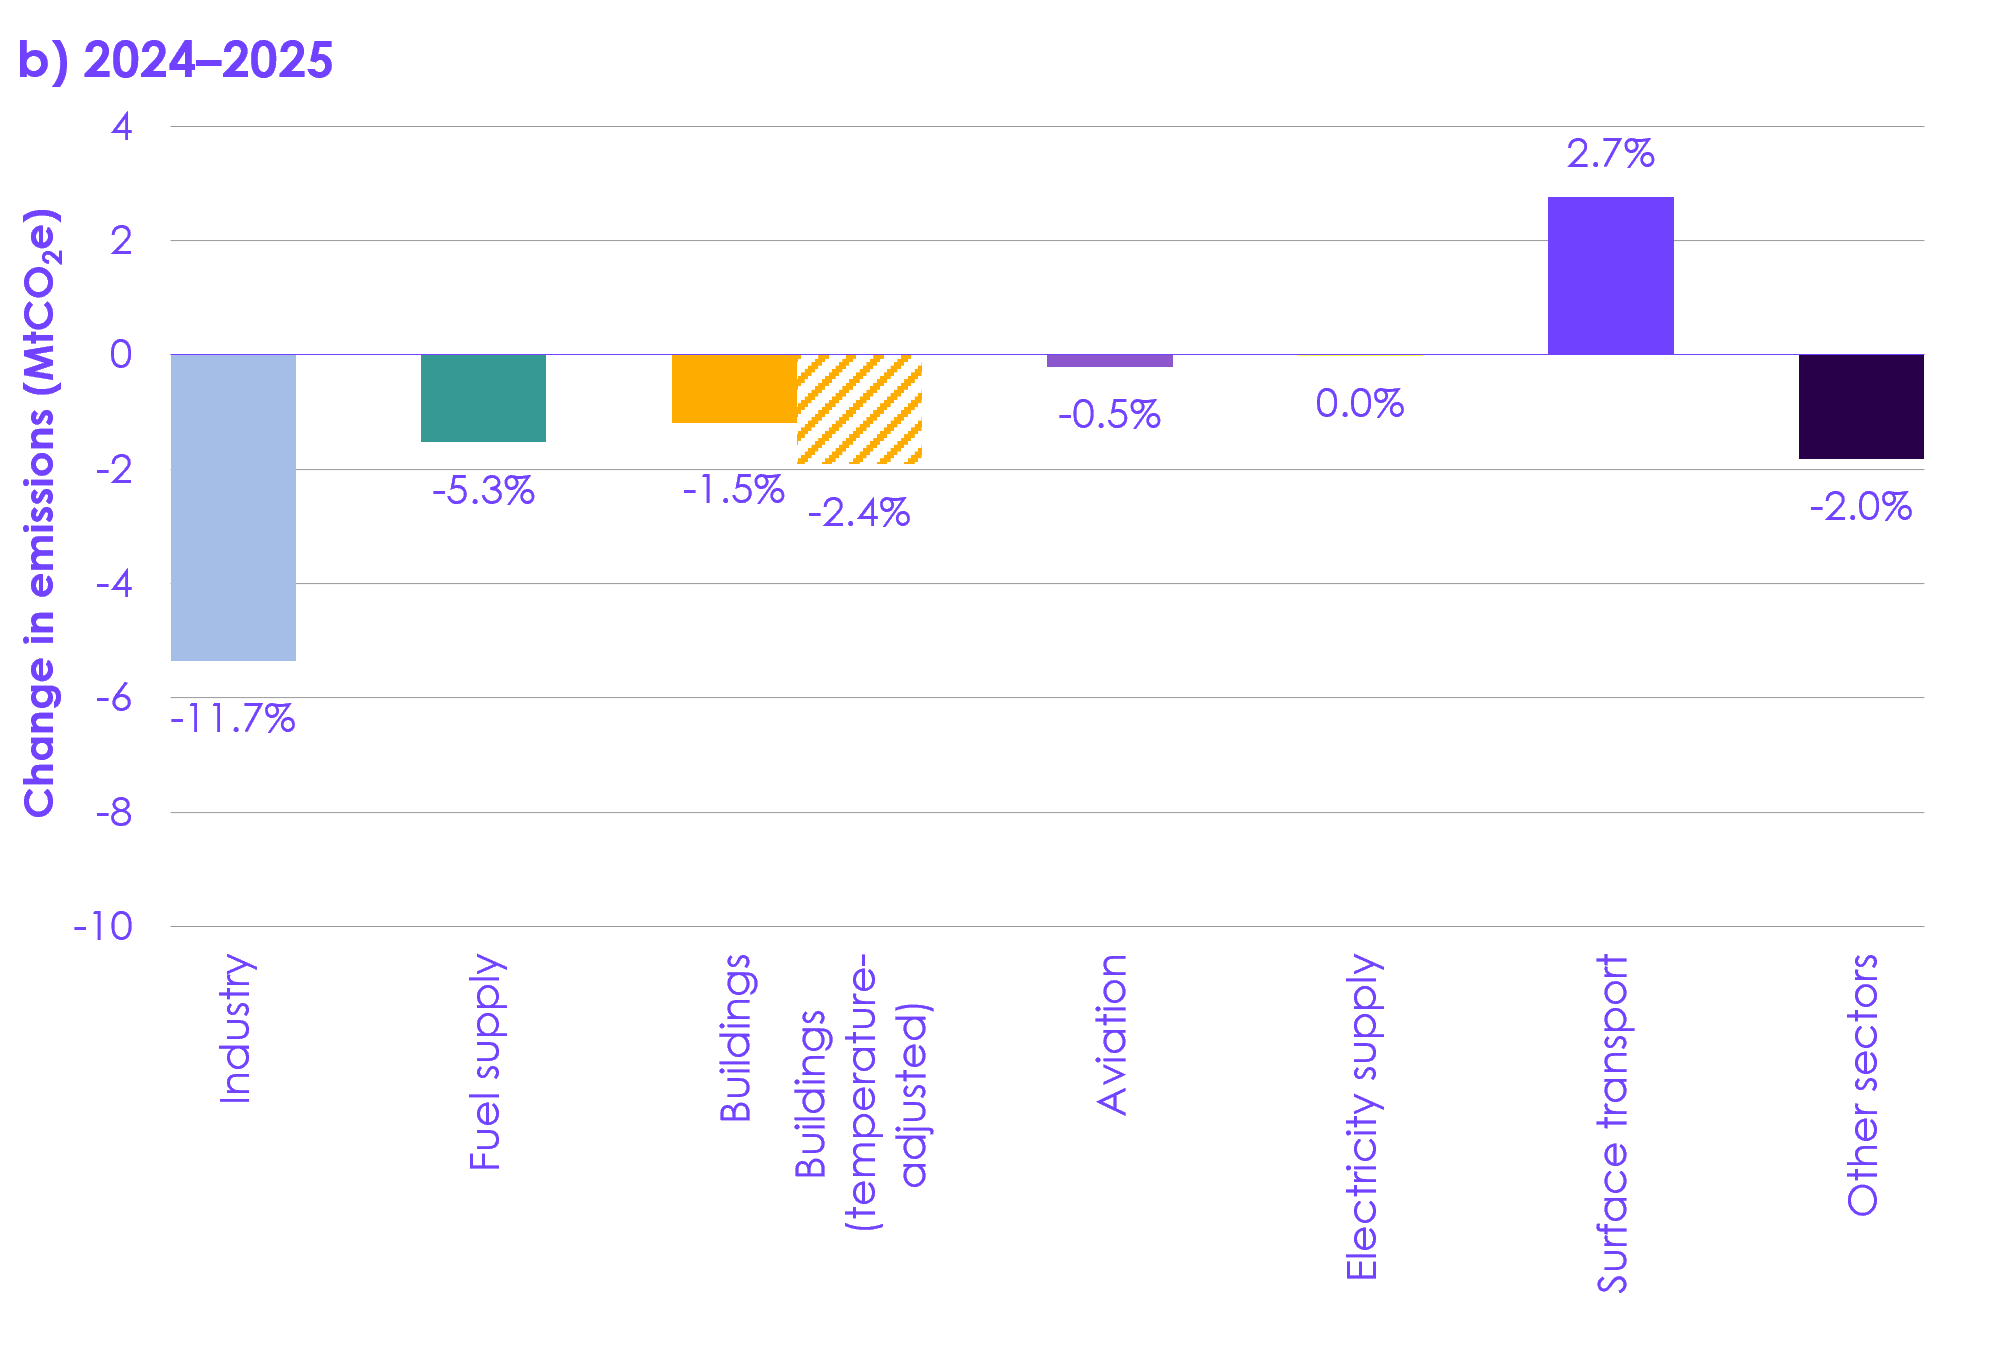 Description: The main reductions in emissions in 2025 were in industry (by 12%) and buildings (by 1.5%). However, emissions from surface transport increased (by 2.7%). Description: The main reductions in emissions in 2025 were in industry (by 12%) and buildings (by 1.5%). However, emissions from surface transport increased (by 2.7%).Source: DESNZ (2026)Provisional UK greenhouse gas emissions statistics 2025; DESNZ (2026) Final UK greenhouse gas emissions national statistics: 1990 to 2024; CCC analysis. Notes: The columns in these charts show the MtCO2e change between years for each sector. The labels present these as the corresponding year-on-year percentage change. |
| Figure 1.3 Provisional and final changes in emissions between 2023 and 2024 for key sectors |
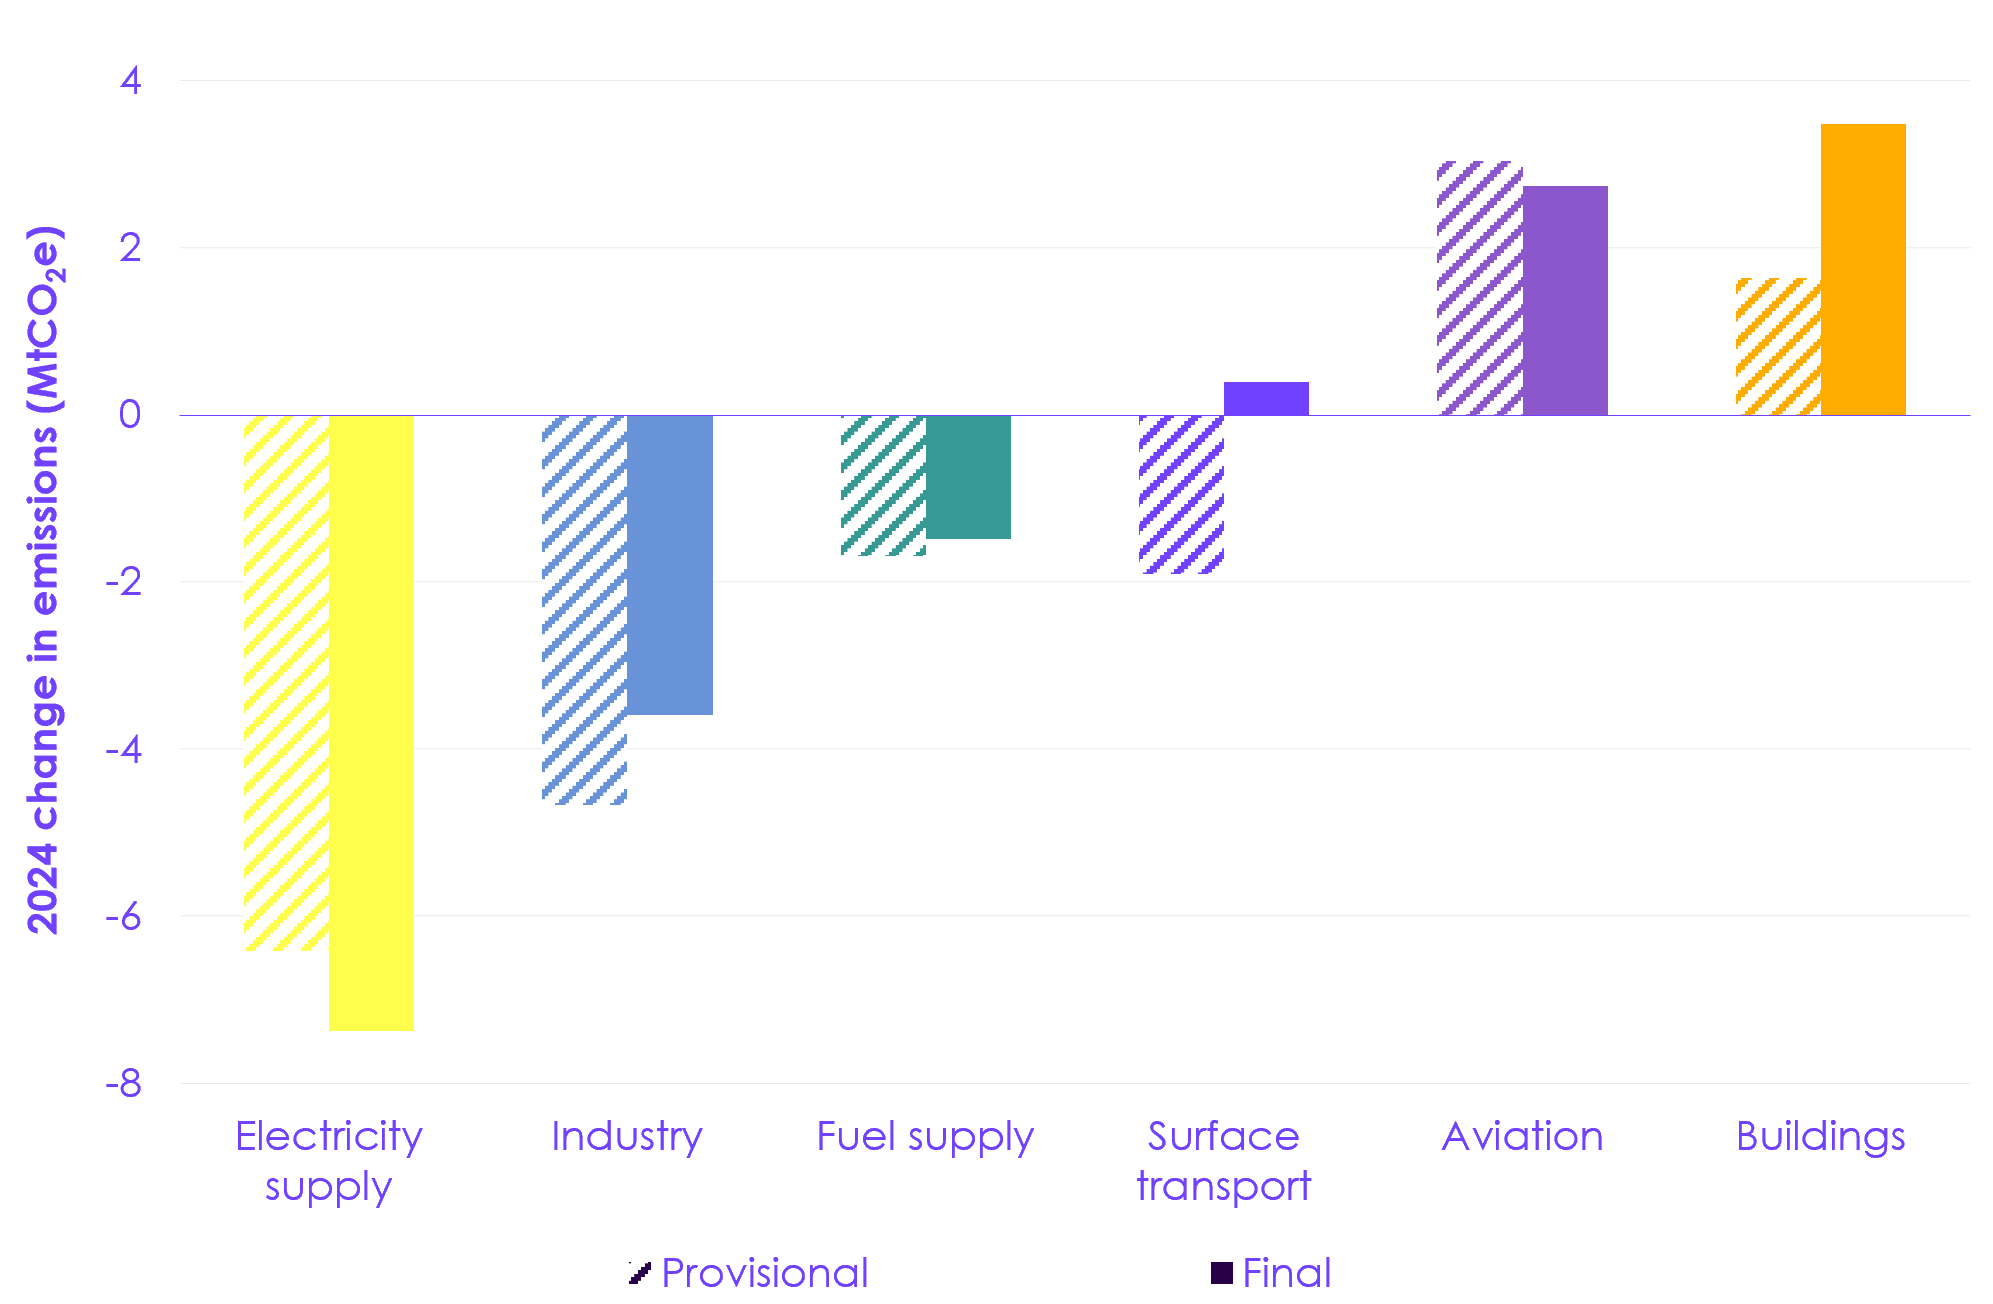 Description: Provisional emissions are uncertain and are subject to change across all sectors. Source: DESNZ (2026) Provisional UK greenhouse gas emissions statistics 2025; DESNZ (2026) Final UK greenhouse gas emissions national statistics: 1990 to 2024; DESNZ (2025) Provisional UK greenhouse gas emissions statistics: 2024; CCC analysis. Notes: Provisional emissions estimates are calculated based on latest quarterly energy statistics to give an early indication of emissions estimates for the most recent year. Because there is limited data available on a quarterly basis for emissions not related to energy use, provisional estimates of other emissions are based on a simplified approach. With more data available, more accurate estimates are possible in the final statistics. |
1.1.2 Sectoral emissions trends
In this section, we discuss recent and longer-term trends in emissions, and the main factors driving these, in key sectors (Figure 1.4). Reductions in emissions since 1990 have been predominantly driven by the electricity supply, industry, fuel supply, and waste sectors. The subset of sectors discussed in more detail below are the most significant for understanding recent overall changes in emissions.
| Figure 1.4 UK emissions by sector since 1990 |
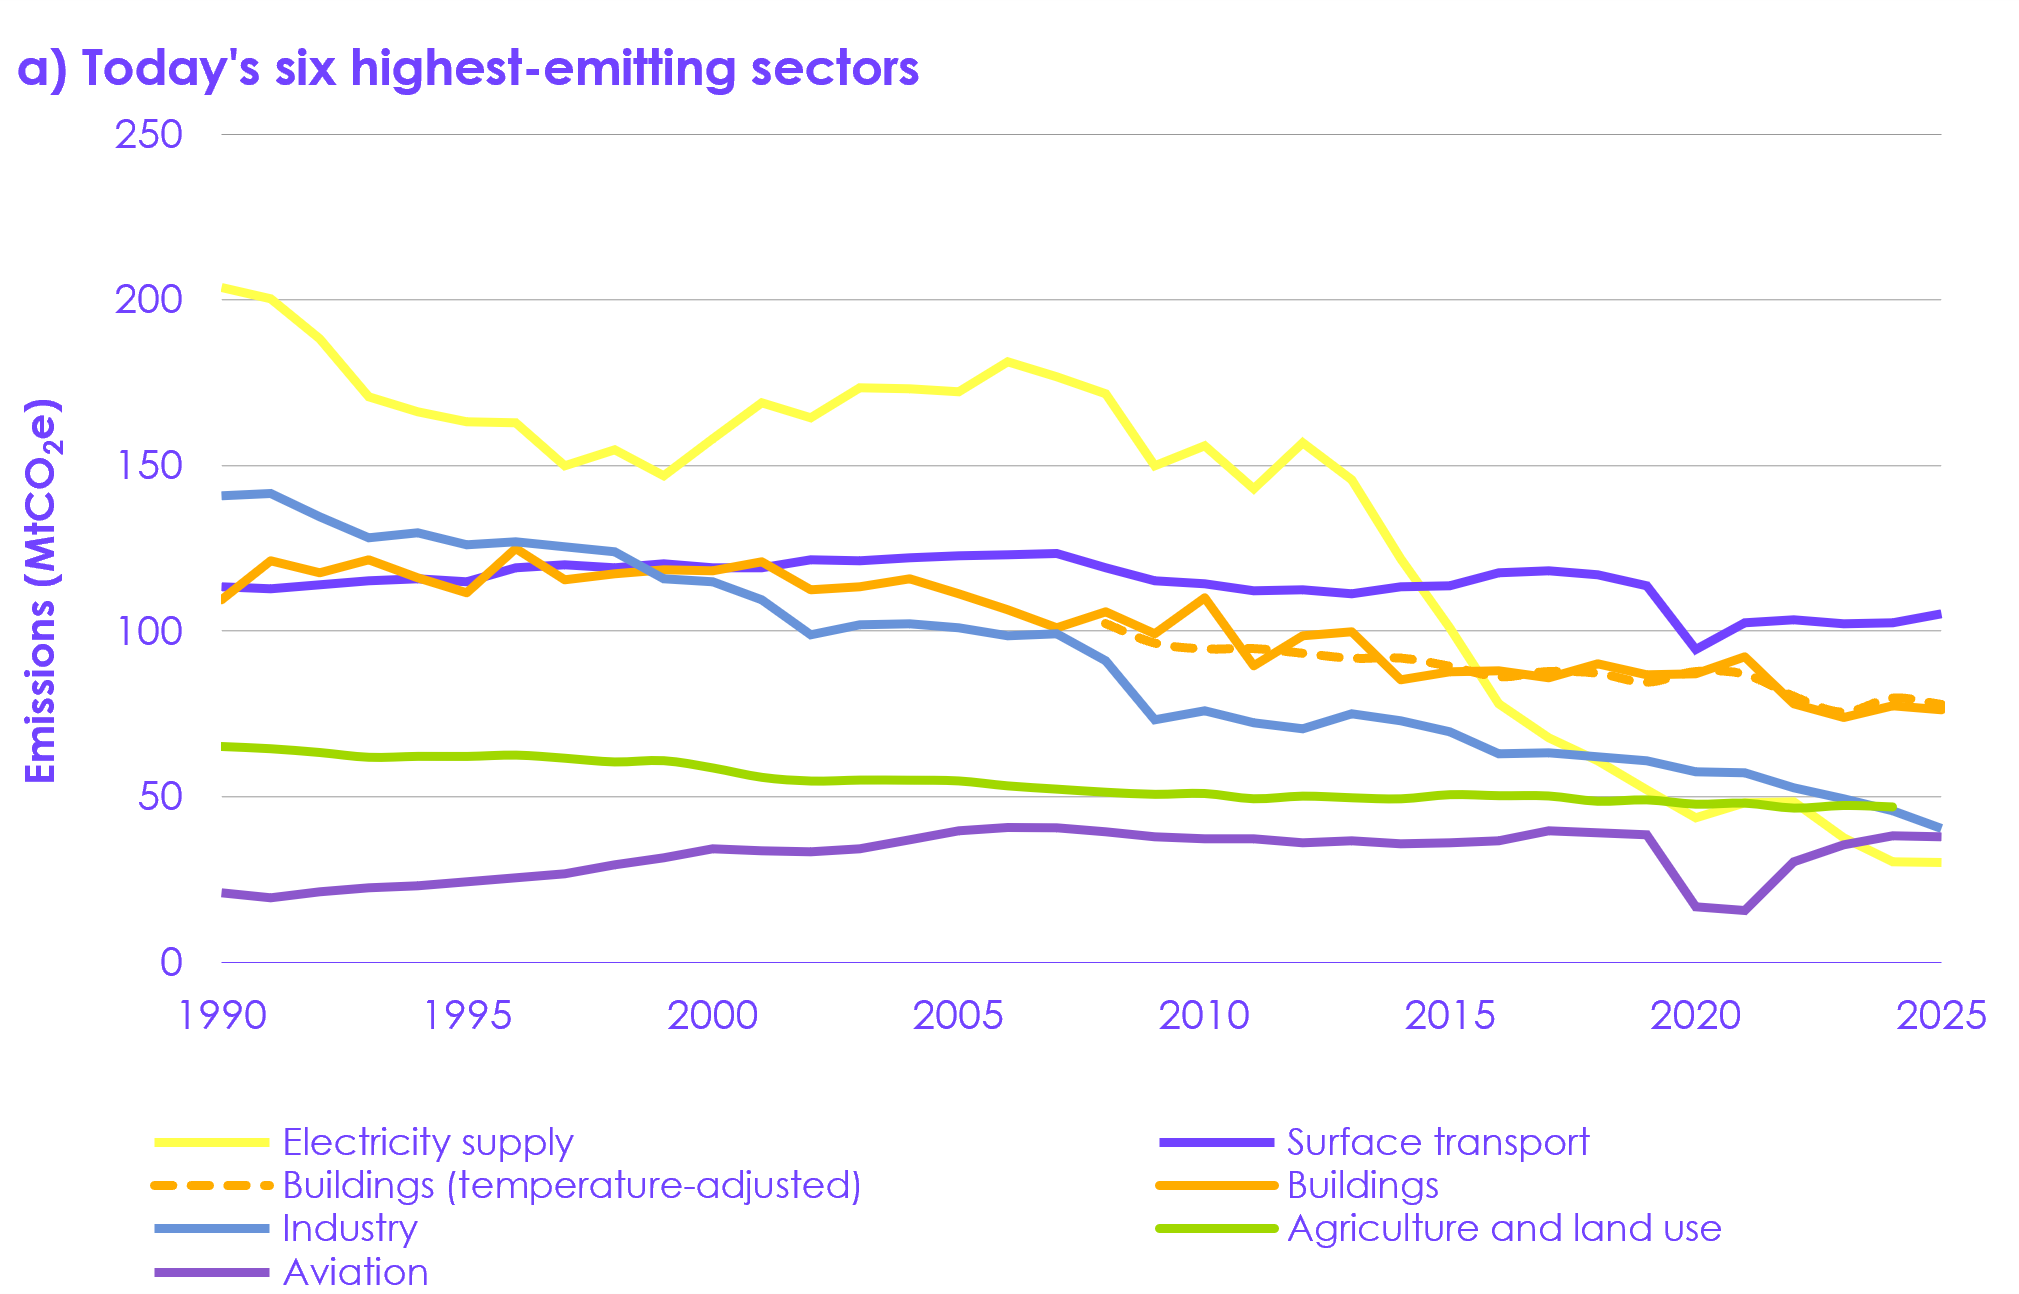 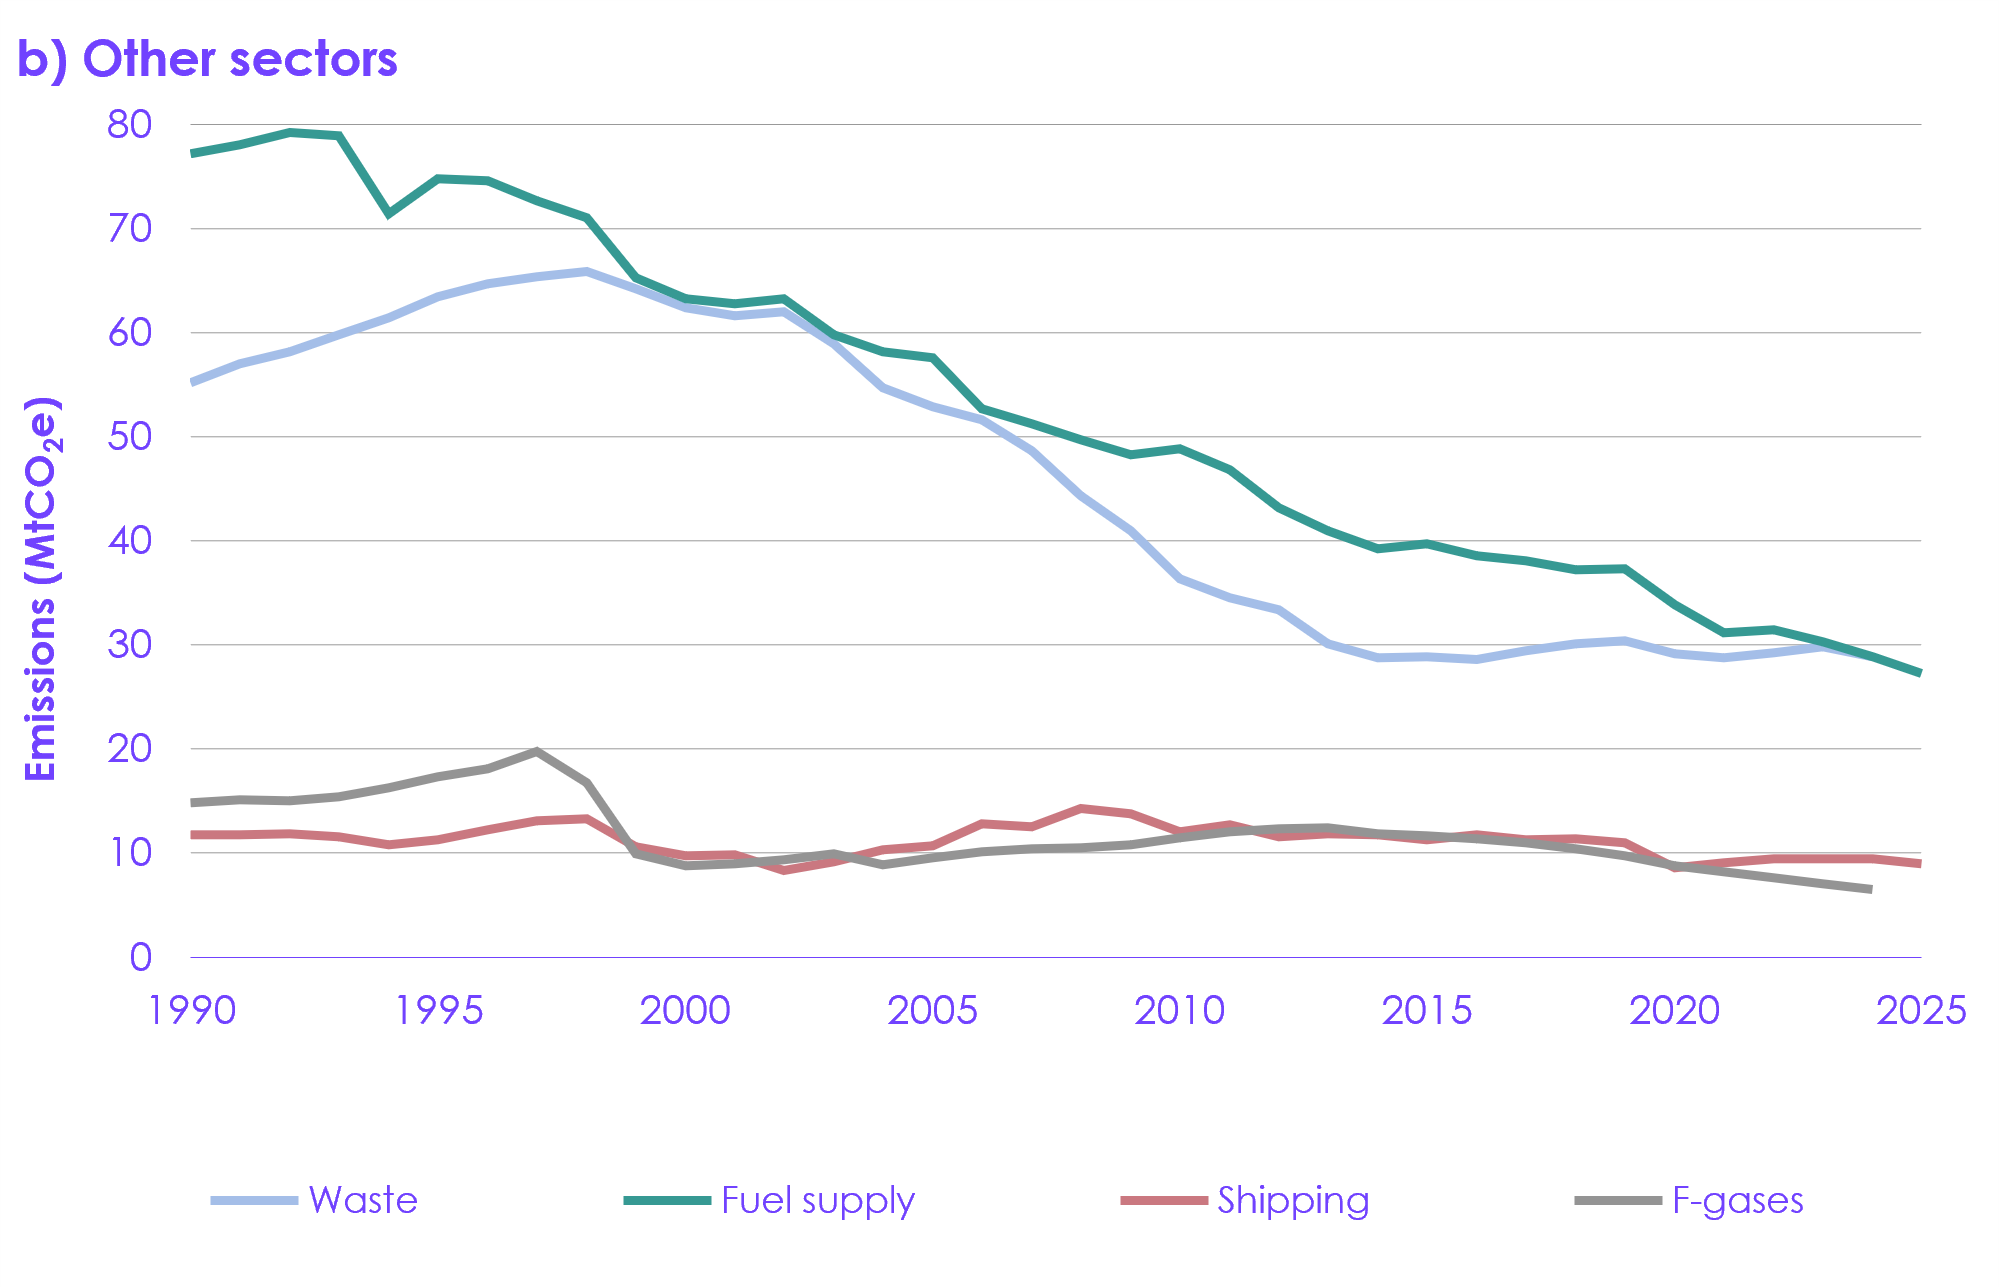 Description: Reductions in emissions since 1990 have been predominantly driven by the electricity supply, industry, fuel supply, and waste sectors. Source: DESNZ (2026) Provisional UK greenhouse gas emissions statistics 2025; DESNZ (2026) Final UK greenhouse gas emissions national statistics: 1990 to 2024; CCC analysis. Notes: (1) The land use sector is a combination of positive sources of emissions and negative sinks of emissions. (2) Agriculture, waste, F-gases, and land use emissions are only shown up to 2024 because the provisional 2025 estimates for these sectors are mostly derived from projections rather than real-world data. |
Surface transport
Surface transport emissions increased by 2.8 MtCO2e (2.7%) in 2025 compared to 2024 levels, reflecting higher total demand for petrol and diesel. While emissions increased in 2025, emissions in the sector are now 12% lower than 2008 levels and 7.3% lower than 2019 levels despite total vehicle-kilometres (km) reaching pre-pandemic levels.
- Surface transport emissions rose since 2024 despite growing EV sales. Growing car- and van-km have increased emissions. This is supported by data showing an increase in demand for petrol and diesel.
- While there is some uncertainty around the provisional emissions data, it appears as though the continued growth in EV adoption has not yet led to an overall reduction in emissions in the surface transport sector compared to 2024. Differences of up to 2.1 MtCO2e have been seen between provisional and final surface transport emissions in recent years, which can affect conclusions on year-on-year emissions changes. For example, according to 2024 provisional data, surface transport emissions fell compared to 2023, but the final data showed them to have risen slightly (Figure 1.3).
- We expect the additional sales of EV cars and vans each year to be reducing emissions by about 0.9 MtCO2e year-on-year currently. This remains within the margin of error between provisional and final emissions data until EV uptake accelerates.
- Total vehicle-km for all vehicle types have reached 2019 levels for the first time since the pandemic due to rising van-km, yet provisional emissions for 2025 were 7.3% lower than 2019.
- Provisional 2025 emissions for cars alone were 12% lower than 2019 levels, despite car-km being 0.2% below 2019 levels. We estimate that the uptake of EVs is likely responsible for around half of this reduction in emissions.
- With sales growing year-on-year, the number of EVs in the fleet is increasing quickly (see Section 3.2.2). As a result, we expect the emissions reductions from EVs to increase quickly in future years.
Buildings
Emissions from the buildings sector fell by 1.2 MtCO2e in 2025. This represents a reduction of 1.3% for non-residential and 1.6% for residential buildings compared to 2024. This was despite the winter months of 2025 being colder overall than in 2024. Emissions in the sector are now 28% lower than 2008 levels. When accounting for the impact of temperature, emissions from the buildings sector fell by 1.9 MtCO2e (2.4%).
- Lower temperature-adjusted emissions (for example, accounting for colder winter months), suggests that factors other than weather were driving this reduction. For example, higher energy prices reducing energy demand by making heating less affordable. While this has caused emissions to fall it does not indicate progress on decarbonising home heating.
- Heat pump deployment is not yet fast enough to meaningfully reduce emissions. Around 50,000 heat pump retrofits were installed per year in 2024 and 2025. However, these would only deliver around an additional 0.1 MtCO2e of emissions savings in 2025.
- Emissions in non-residential buildings fell at a similar rate across both commercial and public sector buildings.
Without further actions to decarbonise buildings it is likely that emissions will rebound if energy prices fall or weather conditions revert to average, as despite having colder winter months than 2024, 2025 was a warmer than average year.
Agriculture and land use
Emissions from agriculture fell by 0.4 MtCO2e to 46.5 MtCO2e in 2024 compared to the previous year. Land use emissions remained the same during this period, remaining a net source of emissions of 0.3 MtCO2e in 2024.[6]
Between 2008 and 2022, total GHG emissions from agriculture fell by 8%, largely driven by a fall in CO2 emissions. Methane emissions contributed less to the reduction in this period with cattle and sheep numbers falling by 1%. Between 2022 and 2024, a steeper 6% reduction in livestock numbers saw methane emissions fall by 4%. However, a significant increase in CO2 emissions led to a small net increase of 0.2% in total GHG emissions from agriculture during this period.
Emissions from land use have fallen by 0.6 MtCO2e since 2008. Emissions declined between 2008 and 2015, becoming a net sink until 2022. Since then, emissions have risen, driven by a smaller forestry sink due to an aging woodland profile and removal of trees for habitat restoration priorities.
Industry
Emissions from the industry sector fell by 5.4 MtCO2e in 2025 compared to the previous year and were a key source of overall reductions between 2024 and 2025. Emissions in the sector are now 56% lower than 2008 levels.
- Emissions fell 3.2 MtCO2e in the iron and steel sector, due to the closure of the blast furnaces at Port Talbot steelworks in late 2024. The site is decarbonising via electrification, and construction has begun on an electric arc furnace which is due to be operational by late 2027.[7] This is positive progress towards the electrification of industry. Overall, the temporary closure of Port Talbot is responsible for almost two-thirds of the emissions reduction in industry between 2023 and 2025.
- The rest of the reduction in industrial emissions partly relates to falling output from energy-intensive industry. This is broadly consistent with a longer-term trend reflecting a structural shift in UK manufacturing. Since the 1990s, the output of emissions-intensive materials has fallen and the sector has shifted to producing less carbon-intensive but higher-value industrial products (Figure 1.5).
- Many factors (including production costs, reduced demand, and growth in developing economies) have contributed to this long-term structural shift in manufacturing. The trend is common across many developed economies and predates climate policy.
- This trend has accelerated in recent years. The gross value added (GVA) of the most energy-intensive manufacturing sectors fell a combined 6% between 2024 and 2025, and several emissions intensive manufacturing sites in the UK closed permanently in 2025. Recent closures include Ineos’ ethanol plant in Grangemouth, SABIC’s ethylene cracker in Teesside and Electric Glass’ fibreglass plant in Wigan.[8];[9];[10];[11] Since 2021, the pressures on energy-intensive industry have increased due to exposure to high gas prices and resulting higher electricity prices.
- Following Russia’s invasion of Ukraine, industrial gas prices in the UK and Europe tripled between 2020 and 2022, before settling at just over double the 2020 price.[12] This fed through to electricity prices, due to the role of gas in setting the price of electricity, with the UK particularly exposed. Facing significantly higher production costs, highly traded, energy-intensive industries, particularly chemicals, have seen a number of closures across Europe.[13] The Iran war is likely to result in similar energy price shocks, further exacerbating these pressures. In the longer term, industrial electrification, combined with the shift to a renewables-based electricity system will reduce this exposure to fossil fuel price shocks.[14]
| Figure 1.5 The change in UK industrial emissions and GVA since 1991 |
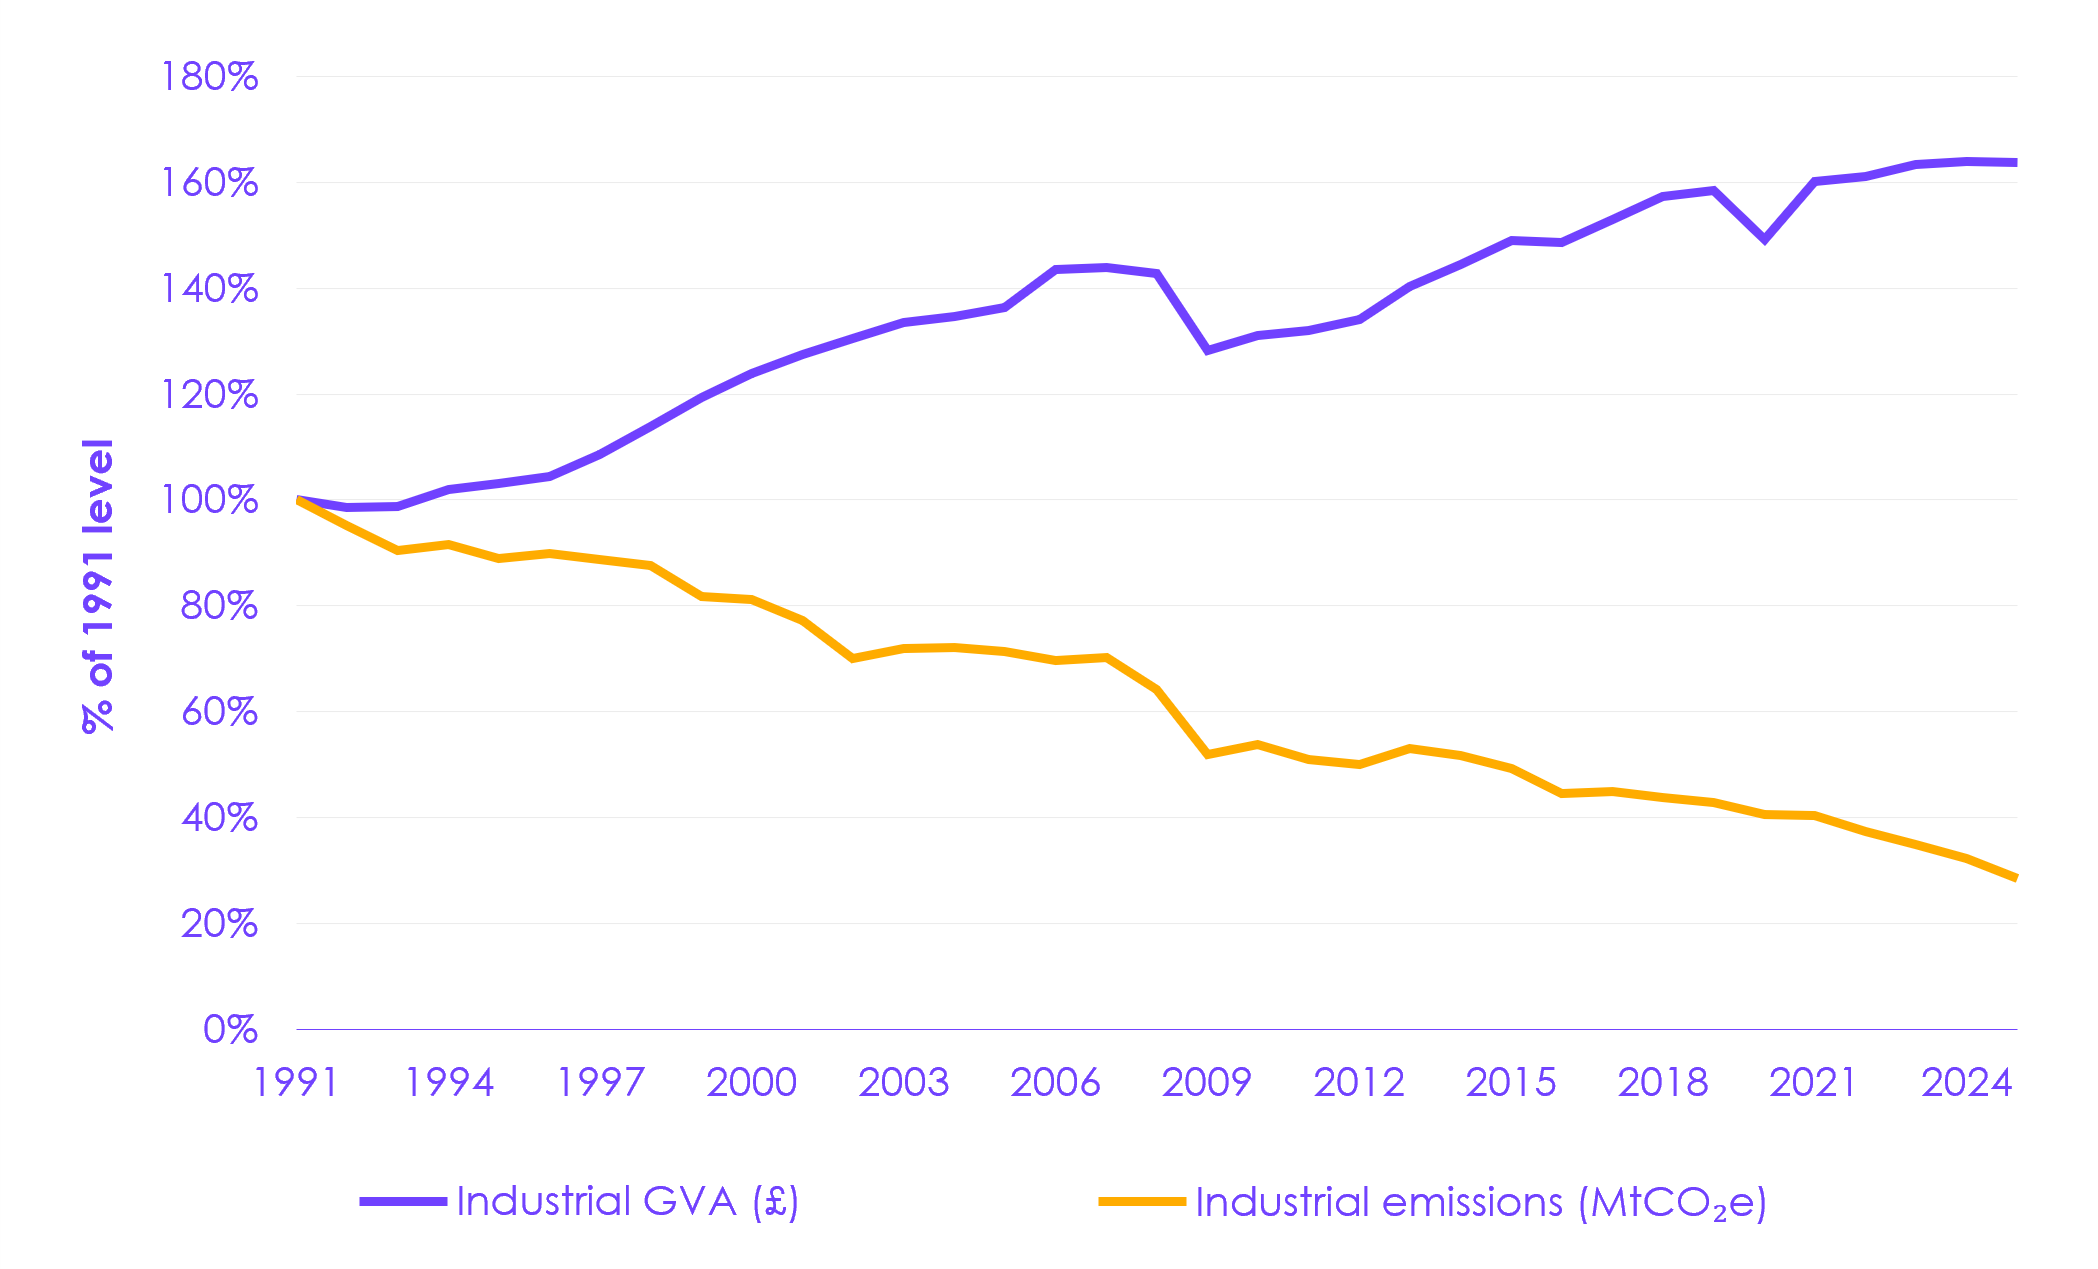 Description: Emissions in the industry sector have declined since the 1990s, whilst gross value added (GVA) has grown over the same period. Source: DESNZ (2026) Provisional UK greenhouse gas emissions statistics 2025; DESNZ (2026) Final UK greenhouse gas emissions national statistics: 1990 to 2024; Office for National Statistics (2025) GDP output approach – low-level aggregates; CCC analysis. Notes: GVA is calculated using a GDP output approach, in chained volume measure. The industry sector includes manufacturing and construction. |
Aviation
Emissions in the aviation sector decreased by 0.5% in 2025 compared to 2024, reaching 37.9 MtCO2e. This is a 1.4 MtCO2e (3.6%) decrease compared to 2008.
- Emissions in 2025 decreased slightly compared to 2024 despite a 3% increase in passenger-km. This is likely due to efficiency improvements from recent changes to the aircraft fleet and a small contribution from sustainable aviation fuel (SAF) uptake (see Section 3.2.6).
- Between 2008 and 2019, aviation emissions were broadly flat, ranging between 36.0–39.7 MtCO2e, they declined sharply in 2020 due to the COVID-19 pandemic, and returned to pre-COVID-19 levels in 2024. It is positive that the high annual emissions growth rate observed between 2022 and 2024 has slowed, but it is too early to say whether future aviation emissions will grow, plateau, or decrease.
- International flights account for most of aviation’s total emissions (95% in 2025). International passenger-km have increased 36% since 2008, whereas domestic passenger-km decreased by 20%.
Electricity supply
The long-term trend in electricity supply emissions has been strongly downward, caused by the phase-out of coal generation and a substantial reduction in gas generation. Emissions in the sector are now 82% lower than 2008 levels, with emissions from gas now less than half 2008 levels and emissions from coal now zero (Figure 1.6). Emissions from coal fell to zero due to the closure of Ratcliffe-on-Soar (which was the UK’s last remaining coal fired power station) in September 2024.
Emissions in this sector did not fall in 2025. This was due to a 5% (4.1 TWh) increase in unabated gas generation year-on-year, which offset the reduction in emissions from coal generation. The increase in gas generation was likely due to a combination of factors:
- A 12% reduction in nuclear generation due to operational challenges at several reactors, particularly at Hartlepool.[15] Nuclear generation fell from 41 TWh in 2024 to 36 TWh in 2025.
- An 11% fall in net imports of electricity via interconnectors, from 33 TWh in 2024 to 30 TWh in 2025. While gross imports were broadly flat, there was an increase in gross exports. This was due, in part, to the opening of the new Greenlink Interconnector (which connects Wales with the Republic of Ireland) in January 2025.
- Underutilisation of wind capacity due to transmission network constraints. There was 9.4 TWh of wind curtailment in Great Britain in the 2024/25 financial year, an increase of 77% on the previous year. The proportion of potential annual wind generation that was curtailed rose from 8% to 13%.[16] Network constraints arise due to a combination of lack of network capacity at key transmission boundaries and operational unavailability during maintenance, asset replacement and reinforcement works. Unabated gas generation currently often replaces constrained wind. The deployment and utilisation of storage and flexibility technologies (including efficient dispatch decisions by the system operator) can help fix this problem, in addition to building out physical networks (see Section 4.3.7).
- Wind capacity additions in 2025 (1 GW) were also lower than the recent historical average (1.9 GW) observed between 2021 and 2024. This was in part due to delays to the Dogger Bank offshore wind farm, which was awarded CfD contracts totalling 3.6 GW in Allocation Round 3 for delivery in 2023/24 and 2024/25, but is not complete as of May 2026. Solar capacity additions were strong in 2025 relative to recent years (see Section 3.2.7).
| Figure 1.6 Decline in emissions from coal and natural gas generation in the electricity supply sector since the Climate Change Act (2008) |
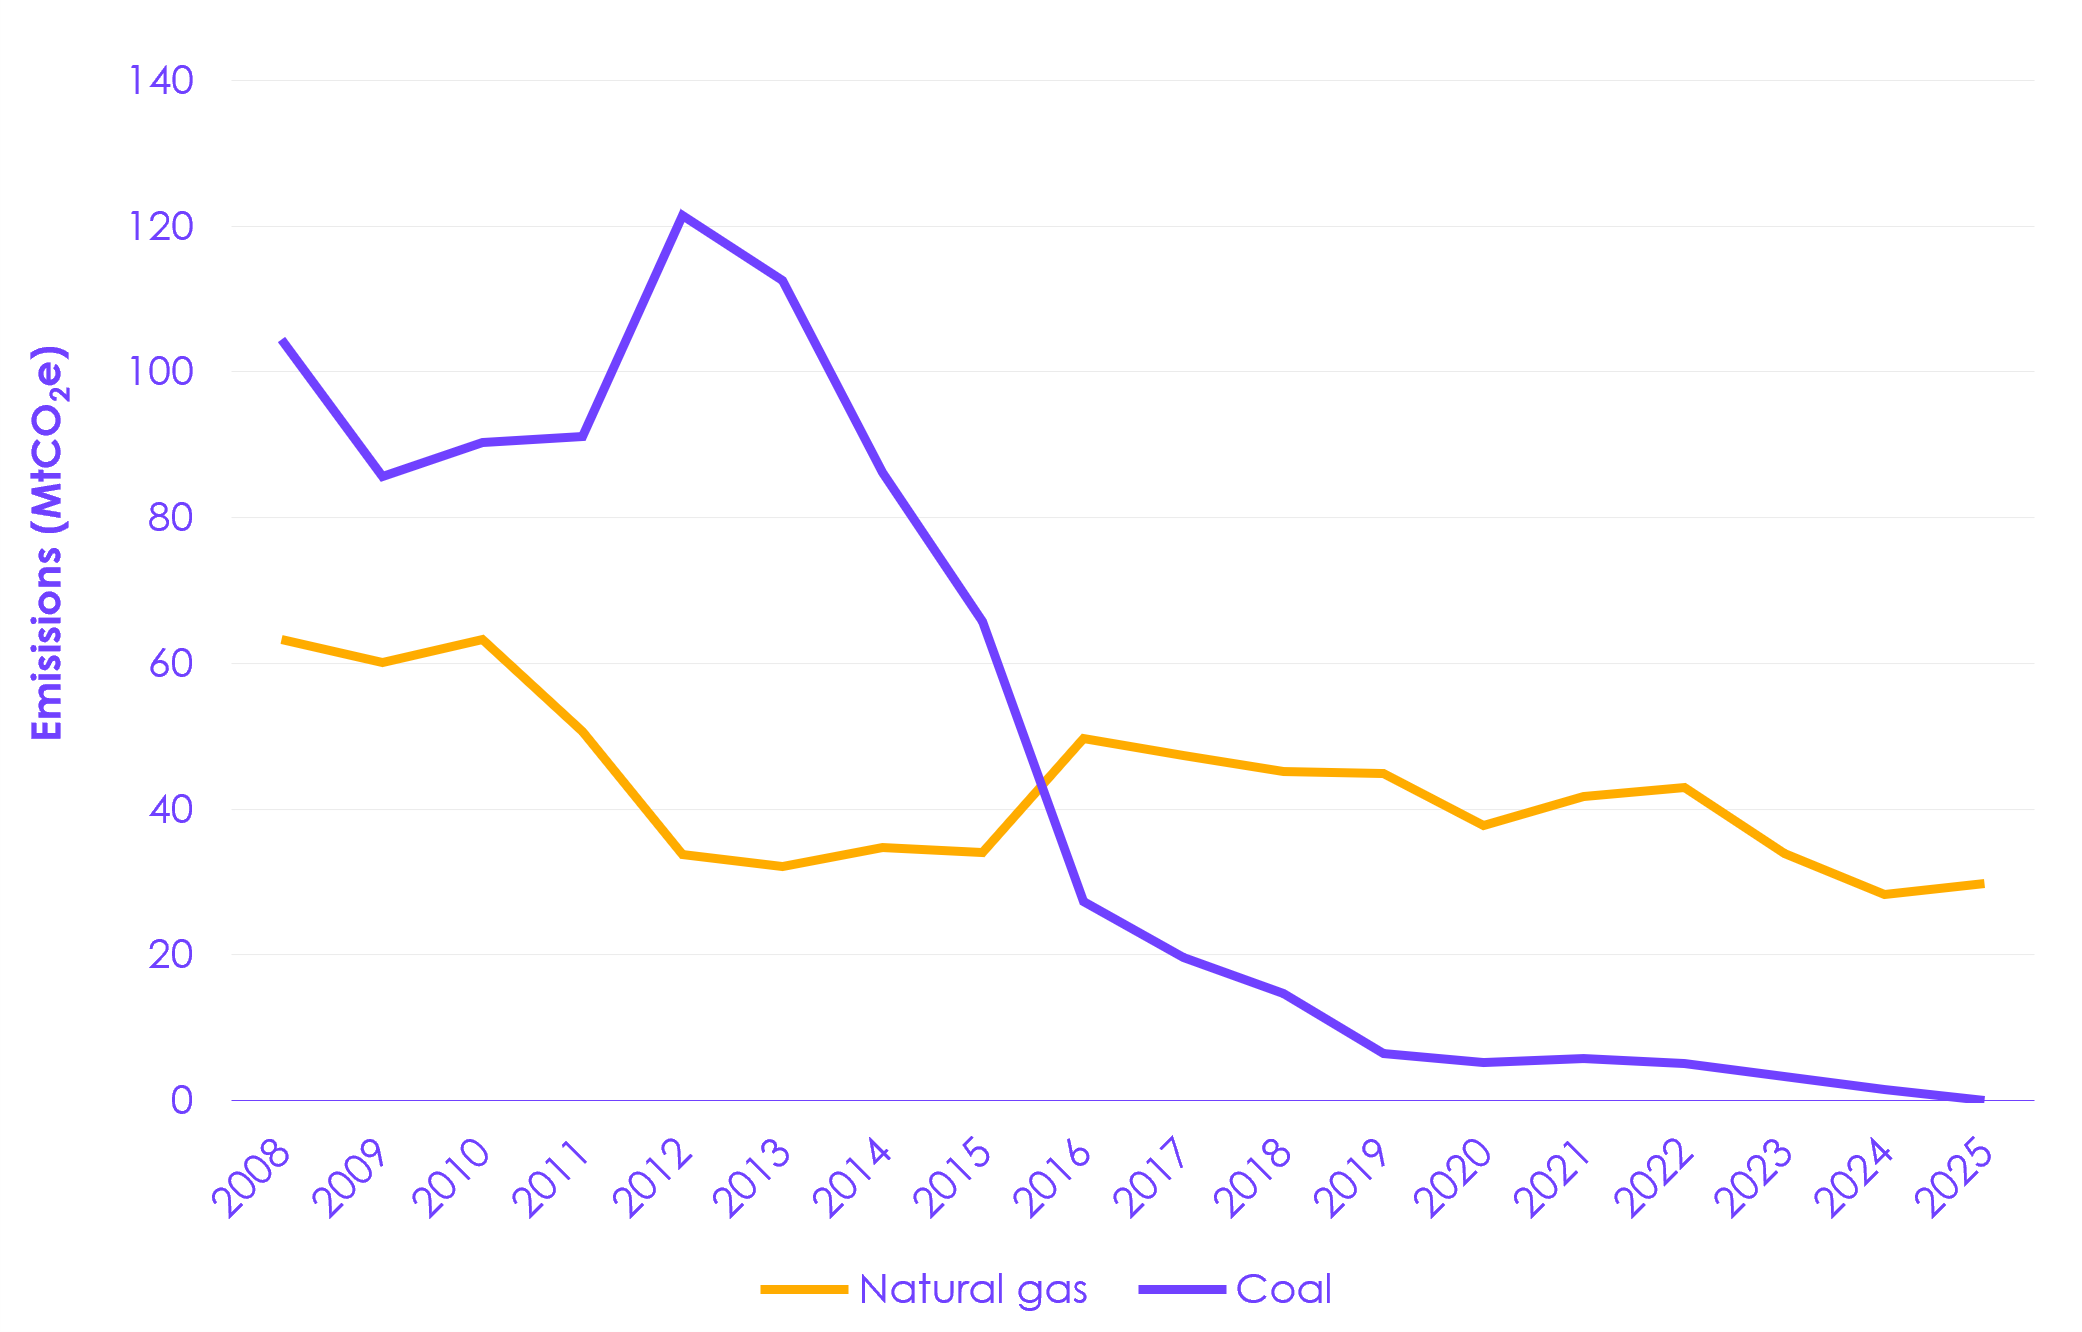 Description: Emissions from coal and natural gas generation in the electricity supply sector have declined substantially since 2008. Emissions from coal generation fell to zero in 2025, while emissions from natural gas generation rose slightly. Description: Emissions from coal and natural gas generation in the electricity supply sector have declined substantially since 2008. Emissions from coal generation fell to zero in 2025, while emissions from natural gas generation rose slightly. Source: DESNZ (2026) Provisional UK greenhouse gas emissions national statistics 2025. Notes: Data shown are annual emissions for gaseous fuels and coal in the electricity supply sector. |
Fuel supply
Emissions from the fuel supply sector fell by 1.5 MtCO2e in 2025, in line with recent annual trends and continuing the significant historical decline seen over the last three decades. Emissions in the sector are now 45.0% lower than 2008 levels:
- The key drivers of emissions reductions between 2024 and 2025 were a fall in emissions from oil refining of 0.9 MtCO2e, largely due to the closure of Grangemouth and Prax Lindsey refineries in 2025, and a reduction in emissions from oil and gas platforms of 0.5 MtCO2e. Much of the reduction in production emissions from oil and gas is due to the closure of oil and gas fields as they reach end of life – the North Sea Transition Authority’s (NSTA) 2025 Emissions Monitoring Report projected an emissions reduction in offshore fields of 0.6 MtCO2e in 2025 due to production ending, in their business-as-usual scenario.[17]
- This is a continuation of a longer-term trend in fossil fuel supply production emissions. Much of the 22.4 MtCO2e reduction since 2008 has been driven by declining emissions from oil and gas production, which fell by 10.4 MtCO2e (58.4%) since 2008 and by 75.3% since their peak in 2000. The decline in oil and gas production is expected to continue as oil and gas reserves in the mature North Sea basin are increasingly depleted – the NSTA project a further decline in combined oil and gas production of 93.2% by 2050.[18]
1.1.3 Emissions from imports
The UK’s legally binding targets are set on the basis of territorial emissions (that is, emissions within the UK’s territorial borders). It is important to also consider emissions associated with UK imports. However, there has been no update on imported emissions data since our progress report last year and the latest available data are from 2022.
Emissions from imports increased by 7% between 2021 and 2022 but have changed very little since 2008. It will be increasingly important to minimise carbon leakage as the UK decarbonises domestically, but as more countries commit to and deliver on Net Zero, particularly among the UK’s major trading partners, the significance of imported emissions should diminish.
1.2 Emissions in Scotland, Wales, and Northern Ireland
Emissions fell in Scotland and Wales but remained relatively stable in Northern Ireland between 2023 and 2024 (the latest available data) (Figure 1.7). The largest reductions were in Wales, where emissions fell by 2.8 MtCO2e compared to 2023, almost five times the percentage decrease seen in the UK overall, mainly due to the temporary closure of the Port Talbot steelworks ahead of electrification (Figure 1.8). The majority of emissions reductions to date in Scotland, Wales, and Northern Ireland have been in mostly reserved sectors, such as electricity supply, fuel supply, and industry. Future action will need to extend to more sectors of the economy, including those with substantial devolved powers, such as agriculture, land use, buildings (where emissions increased in both Wales and Northern Ireland in 2024), and surface transport (where emissions increased in all three nations between 2023 and 2024) (Figure 1.8).
- Scotland: emissions in 2024 were 39 MtCO2e, 1.0% lower than in 2023 and 50% lower than 1990 levels.[19]
- In 2024, the largest emissions reduction in Scotland occurred in the industry sector, where emissions decreased by 0.3 MtCO2e. There were also small reductions in emissions from electricity supply and fuel supply.
- These decreases were partially offset by increases in the surface transport and aviation sectors.
- Since 1990, 63% of emissions reductions in Scotland have been in the electricity supply, fuel supply, and industry sectors. Scotland’s electricity supply has been almost completely decarbonised, with emissions in 2024 96% lower than in 1990.
- Wales: emissions in 2024 were 30 MtCO2e, 8.6% lower than in 2023 and 44% lower than 1990 levels.
- Industry emissions fell by 2.3 MtCO2e (25%) in 2024 compared to 2023, accounting for 74% of total emissions reductions in Wales. This was driven by the closure of the blast furnaces ahead of electrification at Port Talbot.
- There were also reductions in emissions from electricity supply and fuel supply.
- These decreases were partially offset by increases in the buildings, surface transport, and aviation sectors.
- Since 1990, 76% of emissions reductions in Wales have been in the electricity supply, fuel supply, and industry sectors.
- The rate of emissions reduction in Wales has increased since the Environment Act (Wales) was legislated in 2016, with around three quarters of the emissions reduction from 1990 to 2024 occurring since 2016.
- Northern Ireland: emissions in 2024 were 19 MtCO2e, almost unchanged from 2023 and 29% lower than 1990 levels.
- The largest reductions were in the electricity supply sector, where emissions fell by 0.2 MtCO2e (8.2%) in 2024 compared to 2023, accounting for 68% of total reductions in Northern Ireland.
- Emissions in the residential buildings, surface transport, and agriculture sectors all increased between 2023 and 2024.
- Since 1990, 65% of emissions reductions in Northern Ireland have been in the electricity supply and industry sectors.
| Figure 1.7 Emissions reductions in Scotland, Wales, and Northern Ireland compared to the UK |
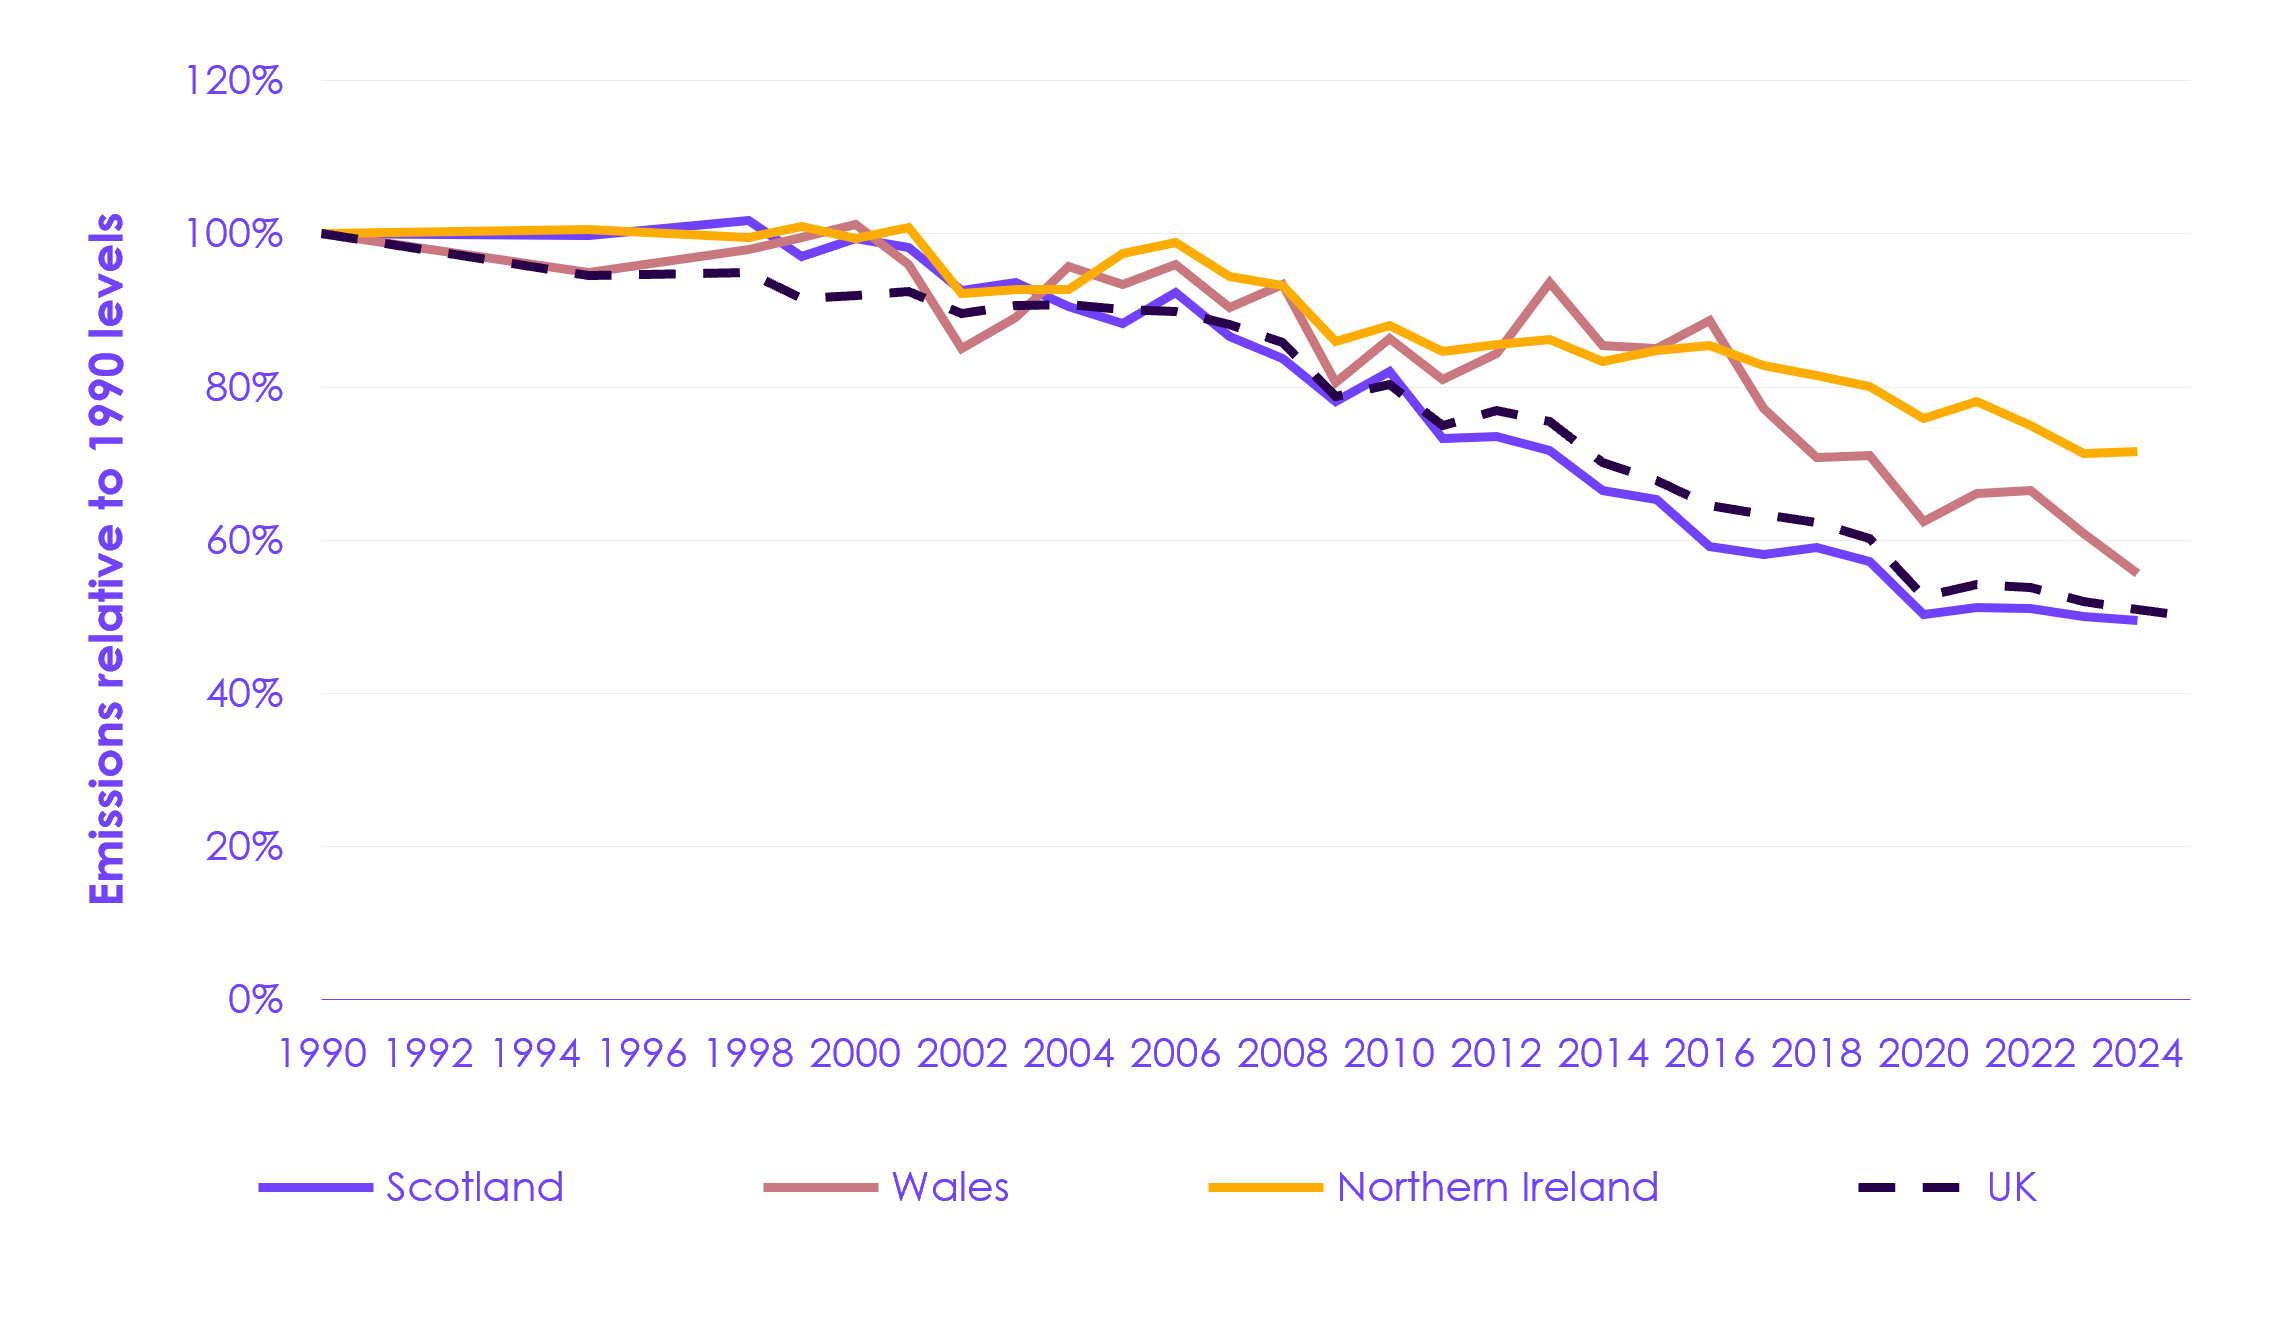 Description: Emissions fell in Scotland and Wales in 2024 but remained almost unchanged in Northern Ireland. |
| Figure 1.8 Change in Scotland, Wales, and Northern Ireland emissions for key sectors (2023–2024) |
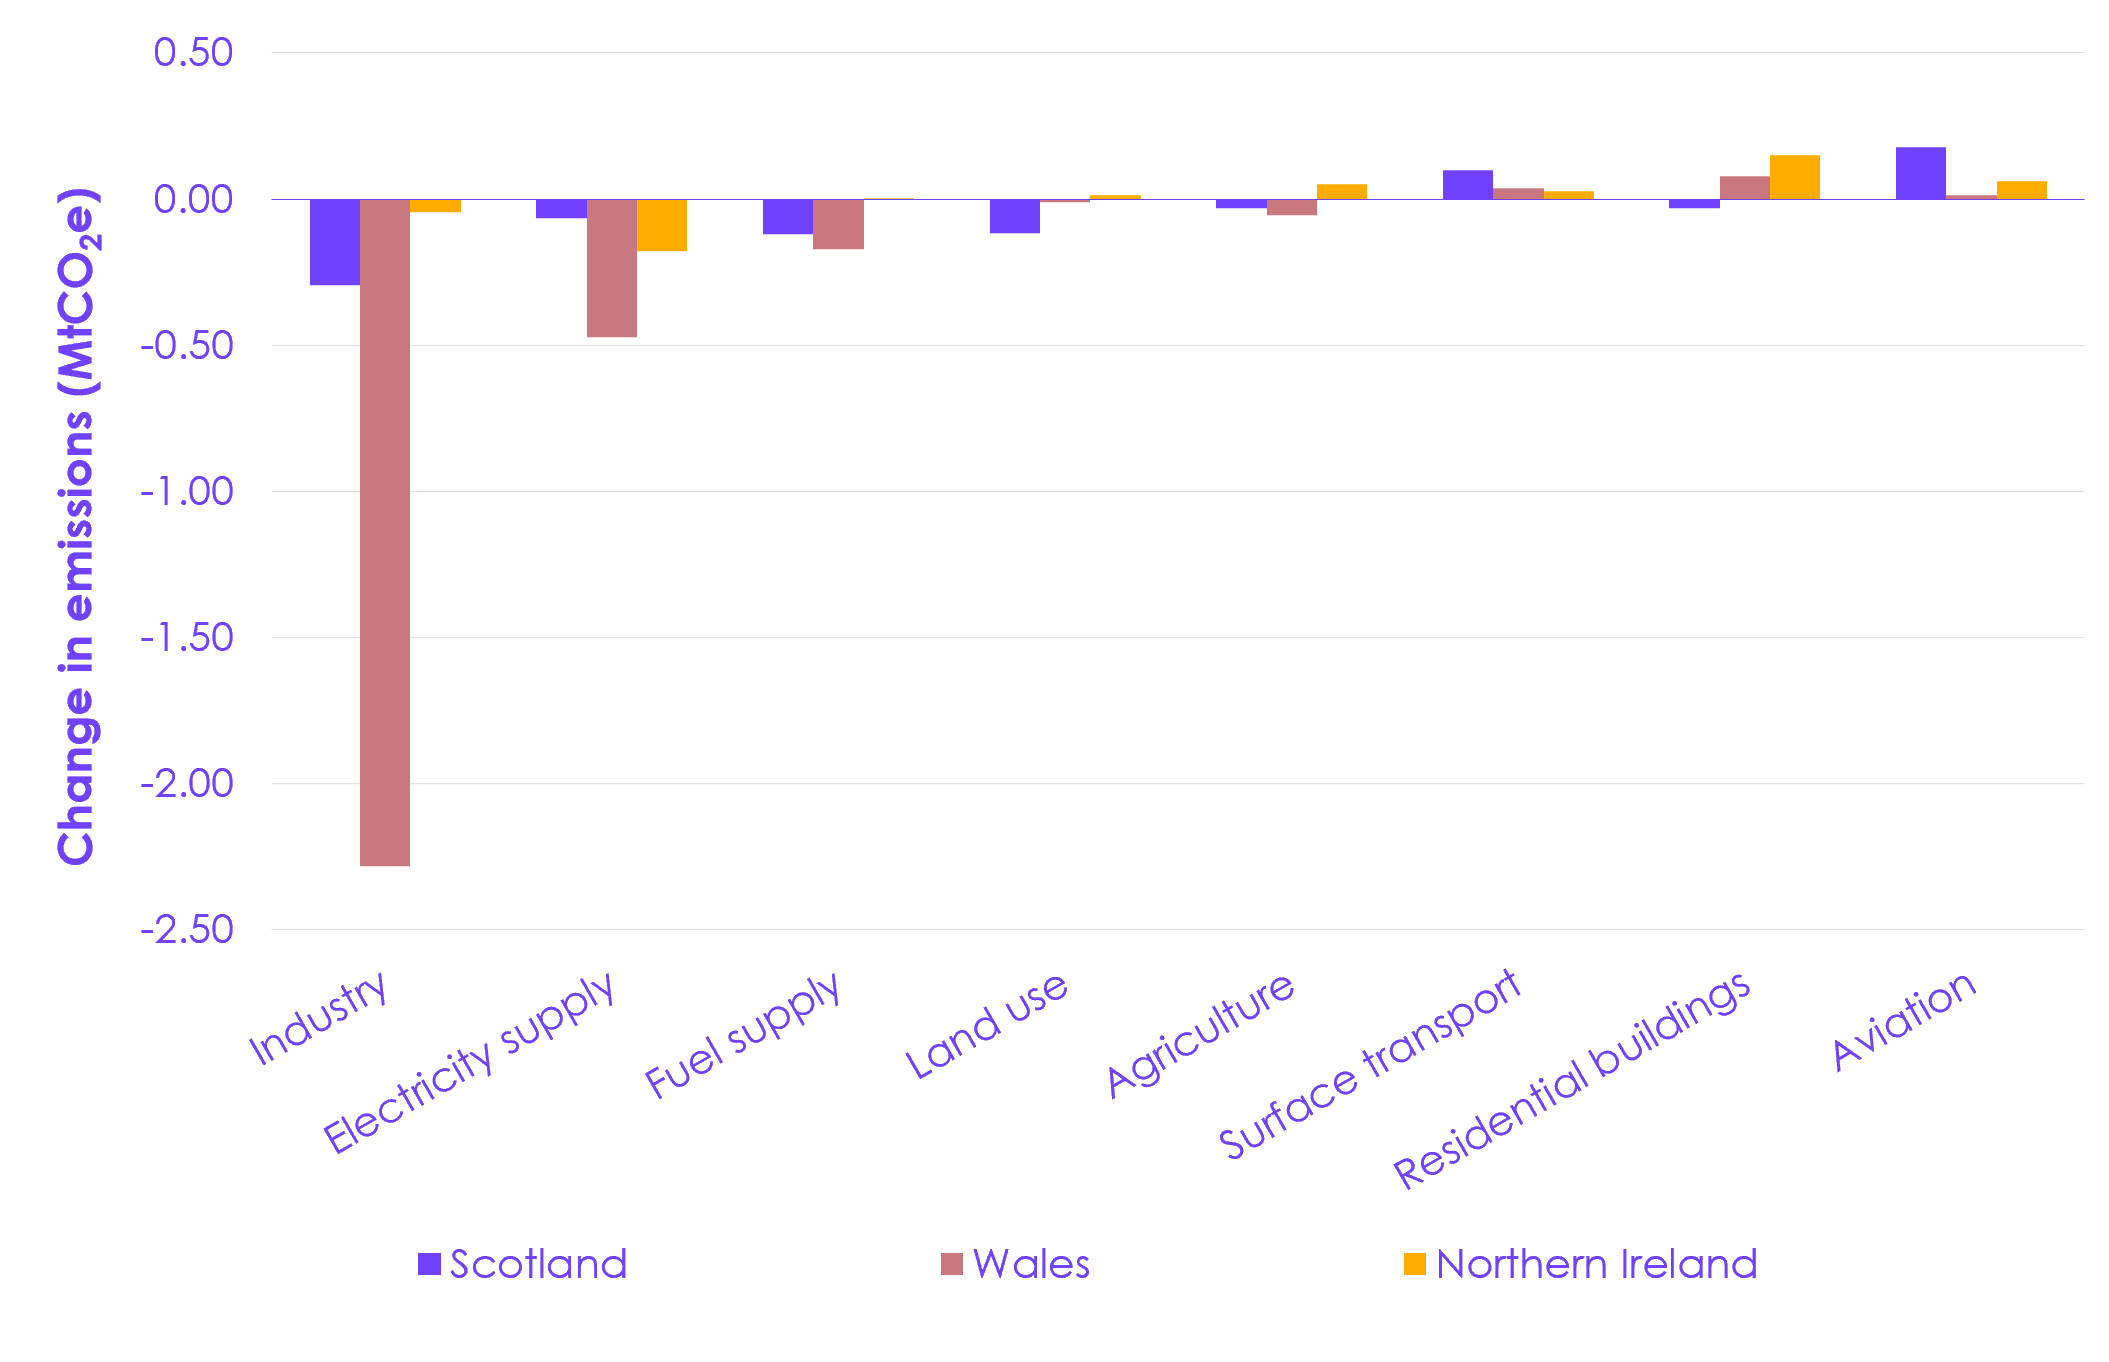 Description: The largest emissions reductions in 2024 were in the industry sector – particularly in Wales, which saw the largest reductions due to the closure of the Port Talbot steelworks. Source: DESNZ (2026) Final UK greenhouse gas emissions national statistics: 1990 to 2024; National Atmospheric Emissions Inventory (2026) Greenhouse Gas Inventories for England, Scotland, Wales and Northern Ireland: 1990-2024; CCC analysis. |
1.3 The UK in an international context
This section sets out the global context of emissions, warming globally and in the UK, and international climate policy in 2026. It assesses the UK’s international role and contribution towards global efforts to mitigate climate change.
Global GHG emissions are yet to peak, with global temperatures continuing to increase at the fastest rates on record and climate impacts worsening.[20] Climate ambition and policy implementation are generally stable or increasing globally but remain well below what achieving global climate goals would require, and there are notable exceptions.[21] Nonetheless, the low-carbon transition is accelerating in most countries and regions, increasingly slowing or reversing annual emissions growth. Many countries, including the UK, are taking actions which will accelerate these trends in response to the repercussions from the Iran war.
While the UK produces less than 1% of global emissions, over a quarter of global emissions are produced by countries with a share of emissions less than 1%.[22] Through its international actions, the UK should seek to continue to drive global decarbonisation progress.
1.3.1 Global GHG emissions and warming
Global GHG emissions remain around all-time highs, despite slowly falling per-capita emissions. This has led to corresponding increases in atmospheric GHG concentrations, global temperatures, and climate impacts.
- Initial projections for 2025 indicate that global CO2 emissions from fossil fuels and industry were 38.9 GtCO2e, an increase of 0.8%, once again reaching their highest ever level.[23] Global CO2 emissions from land use, for which the uncertainty range is proportionately larger, are estimated to have fallen 11%, continuing a downward trend over the last decade.[24] Global methane emissions from the fossil fuel sector were estimated to remain at record high levels of around 124 MtCH4 (3.5 GtCO2e) in 2025.[25];[26]
- CO2 emissions per capita from fossil fuels and industry were broadly flat in 2025, based on population projections for 2024 and 2025, maintaining a broad plateau slightly below peak levels of 2012.[27];[28];[29]
- Atmospheric CO2 concentration reached 425.6 parts per million (ppm) in 2025, an increase of 2.8 ppm on 2024 levels, and around 50% higher than pre-industrial levels.[30]
- 2023, 2024, and 2025 have been the three hottest years on record. In 2025, warming was around 1.39ºC above pre-industrial levels. This is below 2023 and 2024 levels, when strong El Niño events were observed, but is consistent with the acceleration in long-term warming observed in recent decades. The rate of warming is at a record high.[31]
- This warming is driving increasing climate impacts globally. For example, sea level rise has accelerated to an estimated 3.67 mm on average per year in the period 2006 to 2025, more than double the average rate over 1976 to 1995.[32]
1.3.2 Climate change in the UK
The UK is already experiencing the impacts of global climate change. Hotter average temperatures, more severe heatwaves, and more intense periods of rainfall are causing significant damage and disruption and putting lives at risk. This year, the CCC’s Adaptation Committee has set out the latest evidence on climate risks and adaptations. The Fourth Climate Change Risk Assessment – Independent Assessment (CCRA4-IA) Technical Report sets out the evidence on climate risk to the UK.[33] For the first time, the Adaptation Committee also offers advice on potential solutions to address these risks in its A Well-Adapted UK report.
- 2025 was the UK’s hottest year on record. Extremely dry conditions in spring and summer impacted arable crop production and caused the most destructive wildfire season in the UK ever recorded. The May 2026 heatwave saw many weather stations recording their highest May daily maximum temperatures on record, with the highest recorded May temperature in the UK as a whole recorded in Greater London.[34] In summer 2022, temperatures exceeded 40°C for the first time, causing the early deaths of over 3,000 people in England and Wales and a 500% increase in 999 calls to fire control rooms.
- Early 2026 was exceptionally wet in parts of the UK, with long unbroken spells of rain leading to widespread flooding. Parts of southern England saw nearly twice the long-term average rainfall for January, resulting in flooding to homes, farmland, and some local infrastructure. The fluctuations from dry to wet periods seen over the last year demonstrate the extreme swings in weather already happening today.
- By the middle of the century, the UK’s climate will be much more extreme than today. Hotter heatwaves could see 92% of existing homes overheat, creating dangerous conditions for vulnerable people. Peak river flows will be up to 45% higher, last longer, and occur more frequently, driving increased flooding. Drier summers will mean more widespread drought – shortfalls in water supply could reach over five billion litres per day in England by 2050.
- Without global emissions reductions, it becomes increasingly hard to protect people and places with adaptation measures – particularly in the second half of the century.
- As set out in our advice to the UK Government on adaptation, the UK should, at a minimum, prepare for the weather extremes that would be experienced if global warming levels reach 2°C above preindustrial levels by 2050. Alongside this, it should also support global emissions reduction efforts to keep warming to lower levels.
In the A Well-Adapted UK report, the CCC’s Adaptation Committee set out their advice on potential solutions to address the priority risks from climate change and propose targets to the Government on what is required to adapt to a world of 2°C warming by 2050. Taking action on adaptation today is cheaper than dealing with the damages the UK is already experiencing. Cooling, flood preparedness, and water management are key adaptation priorities that can help address many of the climate risks the UK faces. These key adaptations must be deployed alongside actions to reduce emissions. In some key areas integrating adaptation with mitigation is needed to ensure that emissions reductions are delivered despite a changing climate and that cost and disruption for people are minimised. These include ensuring that low-carbon heating retrofits consider the need for cooling (possibly through reversible heat pumps), tree planting prioritises species (and places) that are compatible with the UK’s future climate conditions, and that new infrastructure (including in the electricity sector) is built to be resilient to future weather extremes.
1.3.3 International climate policy
In a volatile geopolitical context, the UK is among a leading group of countries demonstrating consistent and sustained decarbonisation.
- As of May 2026, 137 countries have submitted 2035 emissions pledges to the United Nations Framework Convention on Climate Change (UNFCCC) which were due in 2025, including 18 G20 countries.[35];[36] Those submitted leave a large gap to global pathways consistent with the Paris temperature goal (Figure (1.9).[37] To deliver on the Paris temperature goal, therefore, it is essential that countries implement their existing targets and increase collective ambition.
- At COP30 in Brazil, countries restated aims to keep 1.5ºC warming within reach but acknowledged that the remaining global carbon budget “is now small and being rapidly depleted”. They resolved to limit overshoot of 1.5ºC as far as possible.[38] Plans for fossil fuel and deforestation roadmaps were not agreed, but the Brazilian presidency committed to producing them outside of the formal process.[39] At the first Transitioning Away From Fossil Fuels conference in Colombia, 57 countries agreed to work on national and regional roadmaps, macroeconomic dependencies and financial architecture, and producer-consumer alignment for the fossil fuel transition.[40]
- The United States officially withdrew from the Paris Agreement in January 2026 and has notified the UN of its intention to withdraw from the UNFCCC, which will take effect on 27 February 2027. No other country has followed the United States’ withdrawal.[41];[42]
| Figure 1.9 Global greenhouse gas emissions under current ambition and Paris-aligned pathways |
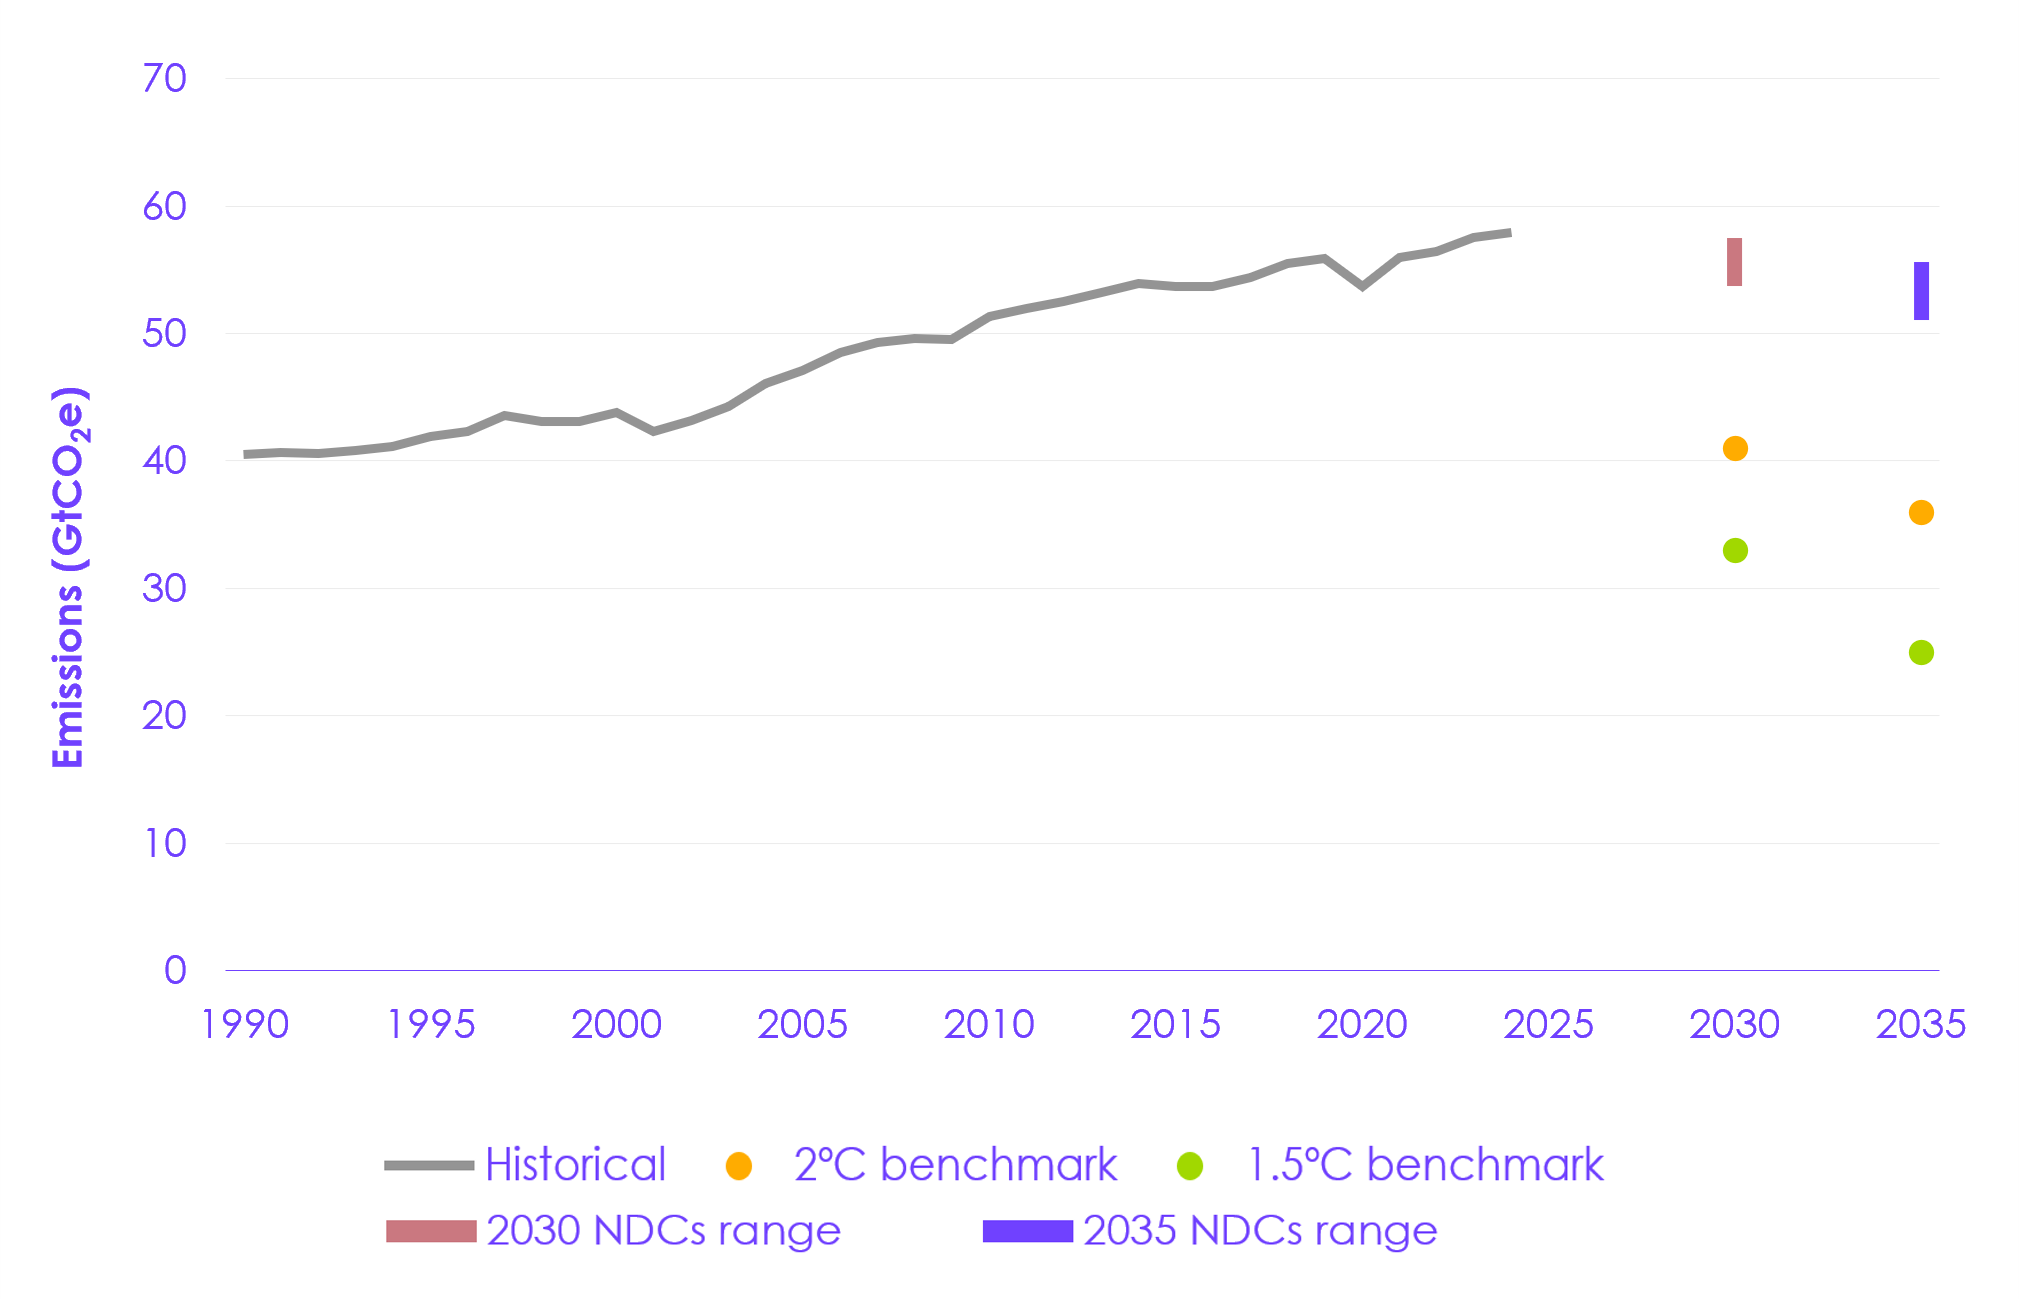 Description: Global emissions have been increasing. Countries’ emissions targets for 2030 and 2035 imply a downward turn in global emissions but leave a large gap to pathways consistent with limiting global warming to 2ºC or 1.5ºC. Source: World Resources Institute (2026) Climate Watch NDC Tracker; Forster, P. et al (2026) Indicators of Global Climate Change; CCC analysis. Notes: (1) NDC ranges shown reflect central estimates for unconditional and conditional NDCs respectively, as of 15 May 2026. (2) Climate Watch historical emissions data extends to 2023. We extend to 2024, the latest year with estimates available for all greenhouse gases, by applying the rate of change of global emissions from the Indicators of Global Climate Change dataset to the Climate Watch 2023 value. (3) Values shown are central estimates, masking wide uncertainty ranges. (4) 1.5ºC and 2ºC scenarios generally assume cost-effective global action beginning in 2020. |
1.3.4 Global low-carbon transition
Even before the current energy crisis, low-carbon technology deployment has continued to accelerate globally, with all regions seeing important shifts.
Global energy transition investment reached a record $2.3 trillion in 2025, exceeding investment in fossil fuels at an accelerating pace.[43] The transition from polluting activities to clean technologies is now progressing in all regions, albeit at a different pace across sectors.
- China’s emissions from energy and industry fell 0.3% in 2025, while India’s CO2 emissions grew just 0.7% in 2025, the slowest rate in more than two decades, excluding the impact of the COVID-19 pandemic in 2020.[44];[45] Coal power generation fell in both China and India in 2025, the first time this has happened simultaneously since 1973.[46]
- Clean sources, led by solar, met all global electricity growth in 2025, preventing a rise in fossil fuel generation.[47] Globally, battery storage was the fastest growing power technology in 2025 with a 40% increase on 2024 deployment levels.[48] In the European Union, wind and solar generated more electricity than fossil fuels for the first time in 2025.[49] In the United States, solar generation grew 28% and battery storage installations grew 29% in 2025.[50] Solar capacity additions in Africa grew 54% in 2025 and are expected to grow at over 20% per year by 2028.[51]
- In 2025, EVs made up 17% of new car sales in the European Union and an estimated 29% in China.[52];[53];[54] A variety of smaller markets are reaching much higher shares, with Norway reaching 96% in 2025, Denmark reaching 69% in 2025, and Ethiopia reaching 60% in 2024 (the last year for which data are available).[55];[56]
- By 2025, there were 77 commercial carbon capture and storage projects in operation with a combined capacity of 64 MtCO2, a 25% increase on 2024 levels.[57] Northern Lights, Europe’s first end-to-end CO2 capture-to-storage project, has begun storing CO2 beneath the Norwegian North Sea.[58]
- In Europe, heat pump sales rose by around 10% in 2025 as government policies supported upfront and running costs.[59] Other regions saw a more mixed picture, with global sales falling 2% in 2025.[60] Data are not available for total heating sales to indicate heat pumps’ share, so it is not clear how much of this is due to changes in total sales.
The 2026 Iran war is the second energy crisis in four years. It has resulted in higher international prices of oil and natural gas, decreasing their competitiveness with clean energy but increasing the competitiveness of coal, where it acts as a direct substitute for natural gas.[61];[62] It is strengthening the long-term case for decarbonisation, with many countries enhancing policies for energy security reasons.[63]
- Several countries have announced plans to increase coal use or review plans to transition away from coal, though it is too early to say what the impact will be.[64] Early research suggests there has been no increase in coal use so far, due to coal being cheaper than natural gas in relevant markets and therefore already running at maximum rates.[65] Under a maximum growth scenario, coal power generation is estimated to increase 1.8% in 2026 compared to 2025 levels.[66]
- Alongside the UK, many countries have announced plans to accelerate the transition to clean energy and low-carbon technologies, as well as direct energy-saving measures in some cases (see Section 4.3).
- The European Commission has proposed a number of measures to speed up the electrification of buildings, transport, and industry, to reduce the cost of electricity, to maximise the deployment of new and existing renewables, and to enhance grid infrastructure.[67] The Commission will present an Electrification Action Plan later this year.
- The French Government has announced it will increase support for electrification from €5.5 billion to €10 billion per year by 2030.[68] This includes plans to end the installation of gas boilers in new buildings from the end of 2026 and increasing support for moving social housing off gas heating. It also includes increases in leasing and subsidy support for EVs and setting domestic EV manufacturing goals.
- Egypt, India, Japan, South Korea, Türkiye, and Vietnam are among countries that have announced plans to accelerate the build out of renewable electricity capacity.[69]
- Chile is offering preferential financing for taxi companies to buy EVs and has limited planned increases on fares for public transport.[70]
- The Philippines, Lao People’s Democratic Republic, and Sri Lanka are promoting energy-saving measures and providing incentives to encourage public transport use.[71] Lao People’s Democratic Republic is also seeking to accelerate the transition to electric trucks, for example through support for charging stations and battery-swap facilities.[72]
While developments over the last year show clear signs of global progress, a significant acceleration is needed to align with scenarios consistent with the Paris Agreement’s temperature goal.[73]
1.3.5 UK international climate actions
The UK has been active in several international coalitions and has made voluntary financial contributions to a number of international programmes, although it has recently announced reductions in funding.
- Building on previous strands of the UK-founded Global Clean Power Alliance, members launched its Supply Chains Mission in November 2025.[74] This seeks to address challenges around supply chains data, electricity transmission component bottlenecks, the circular economy for key materials, and emerging and developing country participation in supply chains.
- Alongside Kenya and Singapore, the UK co-launched the Coalition to Grow Carbon Markets and now co-chairs it.[75] This aims to strengthen high-integrity corporate demand for carbon credits through consistency in approach across jurisdictions.
- From 2025 to 2027, the UK is an elected co-chair of the Climate and Clean Air Coalition, alongside Brazil, offering an opportunity to share domestic policy experience on reducing emissions of short-lived climate pollutants.[76]
- The UK co-launched the Belém Declaration on Global Green Industrialisation, a commitment to accelerate the industrial transition in a coordinated manner with 12 country signatories and 23 organisations.[77]
- The UK has announced a reduction in Official Development Assistance to the equivalent of 0.3% of Gross National Income by 2027, aiming to return to 0.7% when fiscal circumstances allow. Within this, it plans to allocate around £6 billion as international climate finance over 2026/27 to 2028/29.[78] Compared to the previous allocation, this amounts to a reduction of 14% in the annual average in nominal terms, implying a substantially larger reduction after accounting for inflation.[79]
The UK should continue its active engagement in international climate forums, leveraging its strong track record of domestic emissions reduction in support of maximising global decarbonisation progress.
Chapter 2: The Carbon Budget and Growth Delivery Plan
Under the Climate Change Act 2008 (the Act), the UK Government is required to publish plans to achieve the UK’s carbon budgets. In October 2025, the Government published the Carbon Budget and Growth Delivery Plan (CBGDP), an updated plan to achieve the Fourth, Fifth, and Sixth Carbon Budgets (2023 to 2037). The CBGDP replaces the previous government’s 2023 Carbon Budget Delivery Plan (CBDP). The Government will publish a new delivery plan soon after the level of the Seventh Carbon Budget has been legislated.
Our key messages are:
- Performance against targets: the CBGDP pathway outperforms the Fourth (2023 to 2027) and Fifth (2028 to 2032) Carbon Budgets and narrowly achieves the Sixth Carbon Budget (2033 to 2037) but falls short of the UK’s 2030 Nationally Determined Contribution (NDC).
- The Fourth and Fifth Carbon Budgets were set before the UK’s Net Zero target was legislated and need to be outperformed to remain on track for Net Zero by 2050.
- Under the Act, the CBGDP is not required to achieve the UK’s NDC targets. However, the 2030 NDC is the first of the UK’s targets in line with Net Zero and achieving it would put the UK on track to achieve the Sixth Carbon Budget and Net Zero by 2050.
- Distribution of future emissions reductions: emissions reductions to date have been largely driven by electricity supply, but these will make up a declining share of future emissions reductions. Action needs to broaden to more sectors, driven by an accelerated roll-out of electric technologies such as electric vehicles (EVs) and heat pumps, and electrification of industrial heat. There is also a supporting role for demand reduction measures, low-carbon fuels and nature-based measures.
- Reliance on engineered removals: the Government’s pathway has a high reliance on engineered removals to achieve the Sixth Carbon Budget, with 17% of emissions reductions coming from this sector between 2030 and 2037. This is an area with significant risk.
- Contingency plans: we encourage the Government to set out an explicit assessment of contingency options that can be implemented to deliver additional emissions reductions should any aspects of the CBGDP pathway not deliver as expected. This could include a faster uptake of EVs and heat pumps, stronger action to enable modal shift, and more ambition on recycling rates and a reduction of biodegradable waste to landfill. These actions could also help to keep the 2030 NDC in reach.
- Progress monitoring: Effective progress monitoring, including of underlying indicators of progress, and the ability to adjust plans accordingly if things go off track are essential to the effective delivery of the Government’s plans.
2.1 The UK’s emissions targets and the CBGDP
2.1.1 The UK’s emissions targets
The UK has both domestic and international emissions reduction targets. Domestic targets are legally binding under the Climate Change Act 2008 (the Act), the UK’s legislative framework for reducing greenhouse gas (GHG) emissions.[80] International targets are set under the 2015 Paris Agreement, a legally binding international treaty on climate change.[81]
- Under the Act, the UK is required to reach Net Zero emissions by 2050.
- The Act also requires the Government to set carbon budgets, which are five-yearly caps on emissions.
- Six carbon budgets have been set to date, and the UK has achieved its first three carbon budgets (2008 to 2022). In 2025 we provided our advice on the recommended level of the Seventh Carbon Budget, which is due to be legislated by 30 June 2026. The Government has proposed to set the Seventh Carbon Budget in line with our advice.[82]
- The UK’s first five carbon budgets did not include emissions from international aviation and shipping (IAS) and were set before the UK’s Net Zero target. These targets therefore need to be outperformed to remain on track for Net Zero.
- The Sixth Carbon Budget (2033 to 2037) was set at a level that was assumed to include IAS emissions and to be consistent with the Net Zero target. The Government has laid a statutory instrument to formally include IAS emissions in the Sixth Carbon Budget and all subsequent carbon budgets and the Net Zero target. This will be debated alongside the level of the Seventh Carbon Budget (2038 to 2042).[83]
- Under the Paris Agreement, countries are required to submit NDCs. NDCs should set out ambitious targets and plans to reduce emissions in line with the aims of the Agreement. The UK has submitted NDCs for 2030 and 2035. These NDCs were set to be consistent with the Net Zero target, which is why the 2030 NDC is more ambitious than the Fifth Carbon Budget (2028 to 2032). The 2030 NDC is the first of the UK’s targets that is in line with Net Zero.
Under Section 14 of the Act, the Government is required to publish its plan to achieve the legislated carbon budgets as soon as is reasonably practicable after setting a new carbon budget. These plans are not required to achieve the UK’s NDCs.
2.1.2 The CBGDP
In October 2025, the Government published the CBGDP, an updated delivery plan setting out the policies and plans to achieve the Fourth, Fifth, and Sixth Carbon Budgets (2023 to 2037).[84] The CBGDP replaces the previous government’s 2023 CBDP.
The Government is required to publish a new delivery plan that includes the Seventh Carbon Budget period (2038 to 2042) soon after the level of the Seventh Carbon Budget has been legislated.
2.2 Performance of the CBGDP pathway against the UK’s emissions targets
2.2.1 Performance against the UK’s emissions targets
The CBGDP pathway achieves the Fourth, Fifth, and Sixth Carbon Budgets (Table 2.1 and Figure 2.1). We have adjusted the published CBGDP pathway to account for the latest changes in the GHG emissions inventory and to include the impact of the Department for Transport’s correction to aviation emissions in the CBGDP pathway.[85];[86];[87] The CBGDP pathway includes quantified policies and plans, including wider factors and cascade effects (see Section 2.4.2).
- Fourth Carbon Budget (2023 to 2027): the pathway outperforms the Fourth Carbon Budget. With emissions in 2025 below the annual average required, it is now highly likely that the Fourth Carbon Budget will be achieved (see Section 1.1.1).
- Emissions between 2023 and 2025 were an annual average of 7.2 MtCO2e (1.8%) higher than the CBGDP pathway (Table 2.2). This is largely due to higher emissions in electricity supply and buildings, which are partially offset by lower emissions in fuel supply and aviation (see Section 2.3.1).
- Fifth Carbon Budget (2028 to 2032): the pathway significantly outperforms the Fifth Carbon Budget.
- Sixth Carbon Budget (2033 to 2037): the pathway narrowly achieves the Sixth Carbon Budget.
However, the CBGDP pathway does not achieve the 2030 NDC.[88] The CBGDP reaches a reduction versus the 1990 baseline of 65% by 2030, compared to the target of 68%. This leaves a gap of 26 MtCO2e of further emissions reductions required to achieve the 2030 NDC. The 2030 NDC is the UK’s first target set in line with the Net Zero target, so achieving it is important to put the UK on a credible trajectory to achieve future carbon budgets and Net Zero.
- It remains possible to achieve the 2030 NDC by going further than the CBGDP pathway, but only if barriers for households and businesses to transition to commercially available electric technologies are removed (see Section 4.5).
- In the CBGDP pathway, the target set in the 2030 NDC is reached two years later in 2032.
| Table 2.1 Performance of the Carbon Budget and Growth Delivery Plan pathway against the UK’s emissions targets |
|||
|---|---|---|---|
| Emissions target | Current legislated level | Carbon Budget and Growth Delivery Plan pathway | Level of overperformance against the target |
| Fourth Carbon Budget (2023 to 2027) | 1,950 MtCO2e | 1,788 MtCO2e | 162 MtCO2e |
| Fifth Carbon Budget (2028 to 2032) | 1,725 MtCO2e | 1,404 MtCO2e | 1,725 MtCO2e |
| Sixth Carbon Budget (2033 to 2037) | 965 MtCO2e | 963 MtCO2e | 2 MtCO2e |
| 2030 NDC | 68% reduction on 1990 baseline | 65% reduction on 1990 baseline | -3 percentage points |
| 2035 NDC | 81% reduction on 1990 baseline | 80% reduction on 1990 baseline | -1 percentage points |
| Source: Department for Energy Security and Net Zero (DESNZ) (2026) Provisional UK greenhouse gas emissions statistics 2025; DESNZ (2026) Final UK greenhouse gas emissions statistics: 1990 to 2024; DESNZ (2025) Carbon Budget and Growth Delivery Plan; Climate Change Committee (CCC) analysis. Notes: (1) The carbon budgets are set as an absolute emissions limit (in MtCO2e) and the NDC targets are set as a percentage reduction in emissions relative to the 1990 baseline. (2) The CBGDP projections include quantified policies and plans, including wider factors and cascade effects. We have adjusted emissions in the published pathway to use the 2024 final inventory basis. (3) The Sixth Carbon Budget target includes emissions from international aviation and shipping (IAS). The other emissions targets in this table do not include IAS emissions. (4) The 2035 NDC is aligned with the Sixth Carbon Budget. However, after adjustments to the latest emissions inventory, the 2035 NDC is narrowly missed. This is due to the inventory adjustments reducing the 1990 baseline against which the NDC is calculated. Before these adjustments, the CBGDP pathway achieves the 2035 NDC. |
|||
| Table 2.2 Historical emissions compared to the Carbon Budget and Growth Delivery Plan (CBGDP) pathway |
|||
|---|---|---|---|
| Emissions (MtCO2e) | 2023 | 2024 | 2025 |
| Historical emissions | 422.3 | 414.6 | 407.3 |
| CBGDP indicative pathway | 417.8 | 406.9 | 398.0 |
| Source: DESNZ (2026) Provisional UK greenhouse gas emissions statistics 2025; DESNZ (2026) Final UK greenhouse gas emissions statistics: 1990 to 2024; DESNZ (2025) Carbon Budget and Growth Delivery Plan; CCC (2025) The Seventh Carbon Budget; CCC analysis. Notes: (1) Emissions estimates in this table include emissions from international aviation and shipping. (2) The CBGDP projections include quantified policies and plans, including wider factors and cascade effects. The CBGDP pathway is indicative only; the UK does not have annual targets. We have adjusted emissions in the published pathway to use the 2024 final inventory basis. | |||
| Figure 2.1 UK greenhouse gas emissions and the UK Government’s targets and pathway |
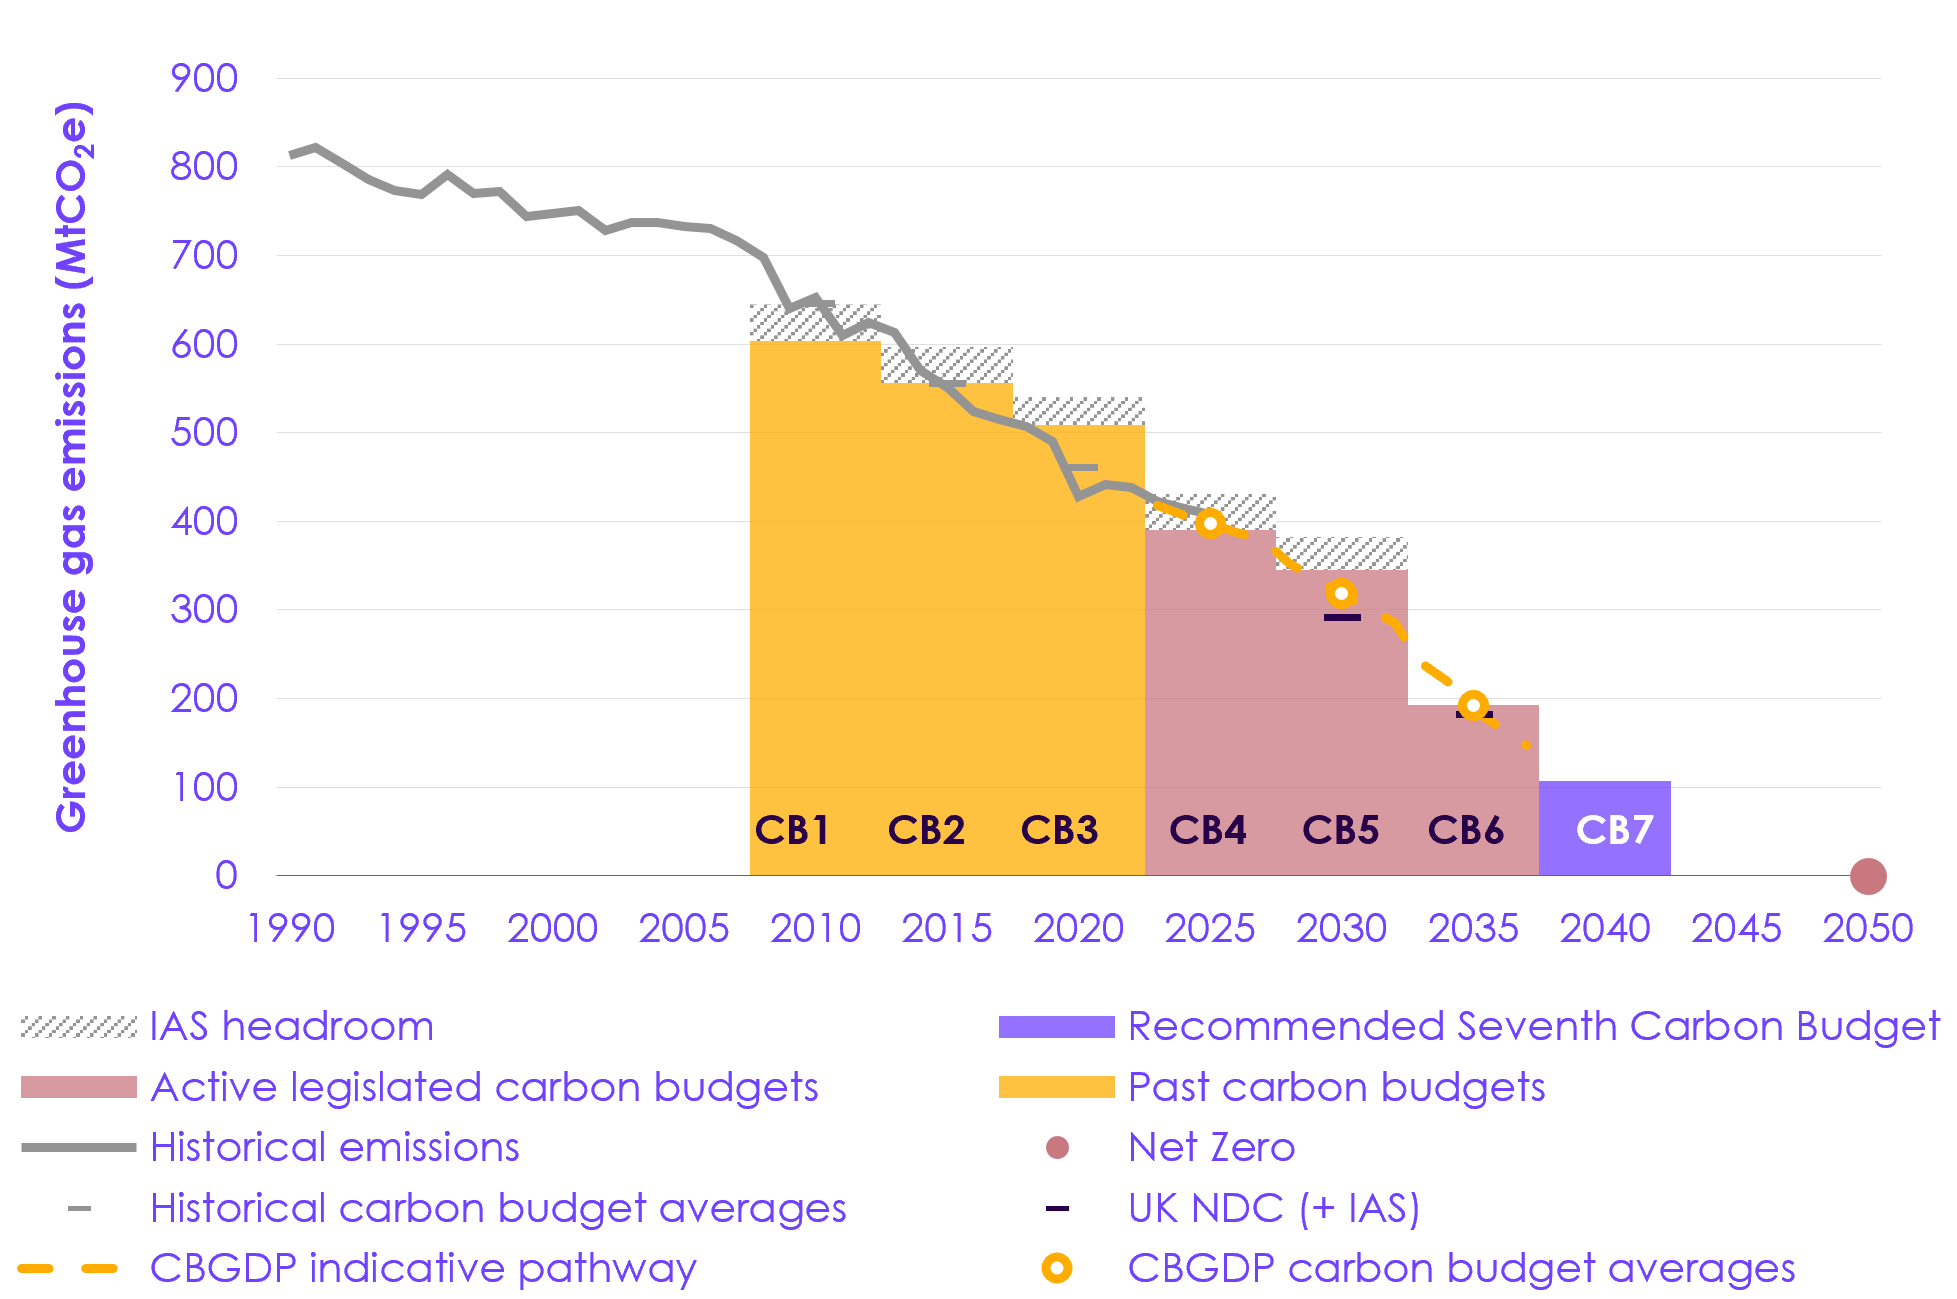 Description: The UK is halfway to Net Zero emissions and has achieved its first three carbon budgets. The Carbon Budget and Growth Delivery Plan (CBGDP) pathway achieves the Fourth, Fifth, and Sixth Carbon Budgets but does not achieve the 2030 Nationally Determined Contribution (NDC). Source: DESNZ (2026) Provisional UK greenhouse gas emissions statistics 2025; DESNZ (2026) Final UK greenhouse gas emissions statistics: 1990 to 2024; DESNZ (2025) Carbon Budget and Growth Delivery Plan; CCC (2025) The Seventh Carbon Budget. Notes: (1) Emissions from international aviation and shipping (IAS) are included in historical emissions and the CBGDP pathway and added to the NDCs to allow for a direct comparison. (2) The CBGDP projections include quantified policies and plans, including wider factors and cascade effects. (3) The annual pathway is an indication of emissions reduction. The UK does not have annual targets but the five-year carbon budgets and NDCs must be achieved. (4) ‘CB’ refers to the UK’s carbon budgets. ‘CB1’ refers to the First Carbon Budget, subsequent numbers refer to subsequent carbon budgets. |
2.2.2 Required pace of future emissions reductions
Since the introduction of the Act in 2008, annual emissions reductions have averaged 17.1 MtCO2e per year excluding IAS. However, this rate has slowed to an average of 13.9 MtCO2e per year excluding IAS over the most recent four years of data (Figure 2.2).[89]
- More than half of the emissions reduction over the period 2008 to 2021 came from the electricity supply sector, as the rapid deployment of renewables facilitated a phase-out of coal generation. The average annual emissions reduction in this sector over this period was 9.2 MtCO2e per year.
- However, emissions reductions from electricity supply have slowed in recent years. Over the period 2022 to 2025, the average annual emissions reduction in the sector was 4.5 MtCO2e per year. Over this period, coal generation was at very low levels, before being fully phased out of the electricity system in 2025. A relative slowdown in emissions reduction from electricity supply is expected following the phase-out of coal as further emissions reduction will now need to come from cuts in gas-fired generation alone (with gas being significantly less emissions intensive than coal).
- Emissions reductions in other sectors have slightly increased in recent years, relative to the long-term average. Over the full period 2008 to 2021, emissions reductions in all other sectors averaged 8.9 MtCO2e per year. This has increased to 9.4 MtCO2e per year in the most recent four years of data.
The pace of emissions reduction will need to accelerate to achieve the 2030 NDC and the Sixth Carbon Budget. Future emissions reductions will depend largely on sectors other than electricity supply (Figure 2.2).
- 2030 NDC: to achieve the 2030 NDC, annual emissions reductions will need to average 22.5 MtCO2e per year excluding IAS from now until the end of the decade. This is a 62% increase compared to the average rate of reduction over the period 2022 to 2025. The CBGDP pathway represents only a 24% increase, as it falls short of achieving the 2030 NDC.
- Sixth Carbon Budget: based on the CBGDP pathway, annual emissions reductions will need to average 24.3 MtCO2e per year including IAS over the period 2031 to 2037. Excluding IAS, the required average over this period is 22.9 MtCO2e per year. Sectors other than electricity supply will need to deliver 97% of these emissions reductions.
The transition to a decarbonised electricity system is progressing rapidly, and a similar change can be expected with the roll-out of electric technologies, provided the right incentives are in place. There are some positive indicators that the pace of emissions reduction in sectors other than electricity supply will increase, particularly with the uptake of electric vehicles (EVs) in surface transport. However, the overall picture is mixed, with less progress expected in the transition to heat pumps (see Section 3.2).
| Figure 2.2 Emissions reductions required to achieve the 2030 NDC and Sixth Carbon Budget |
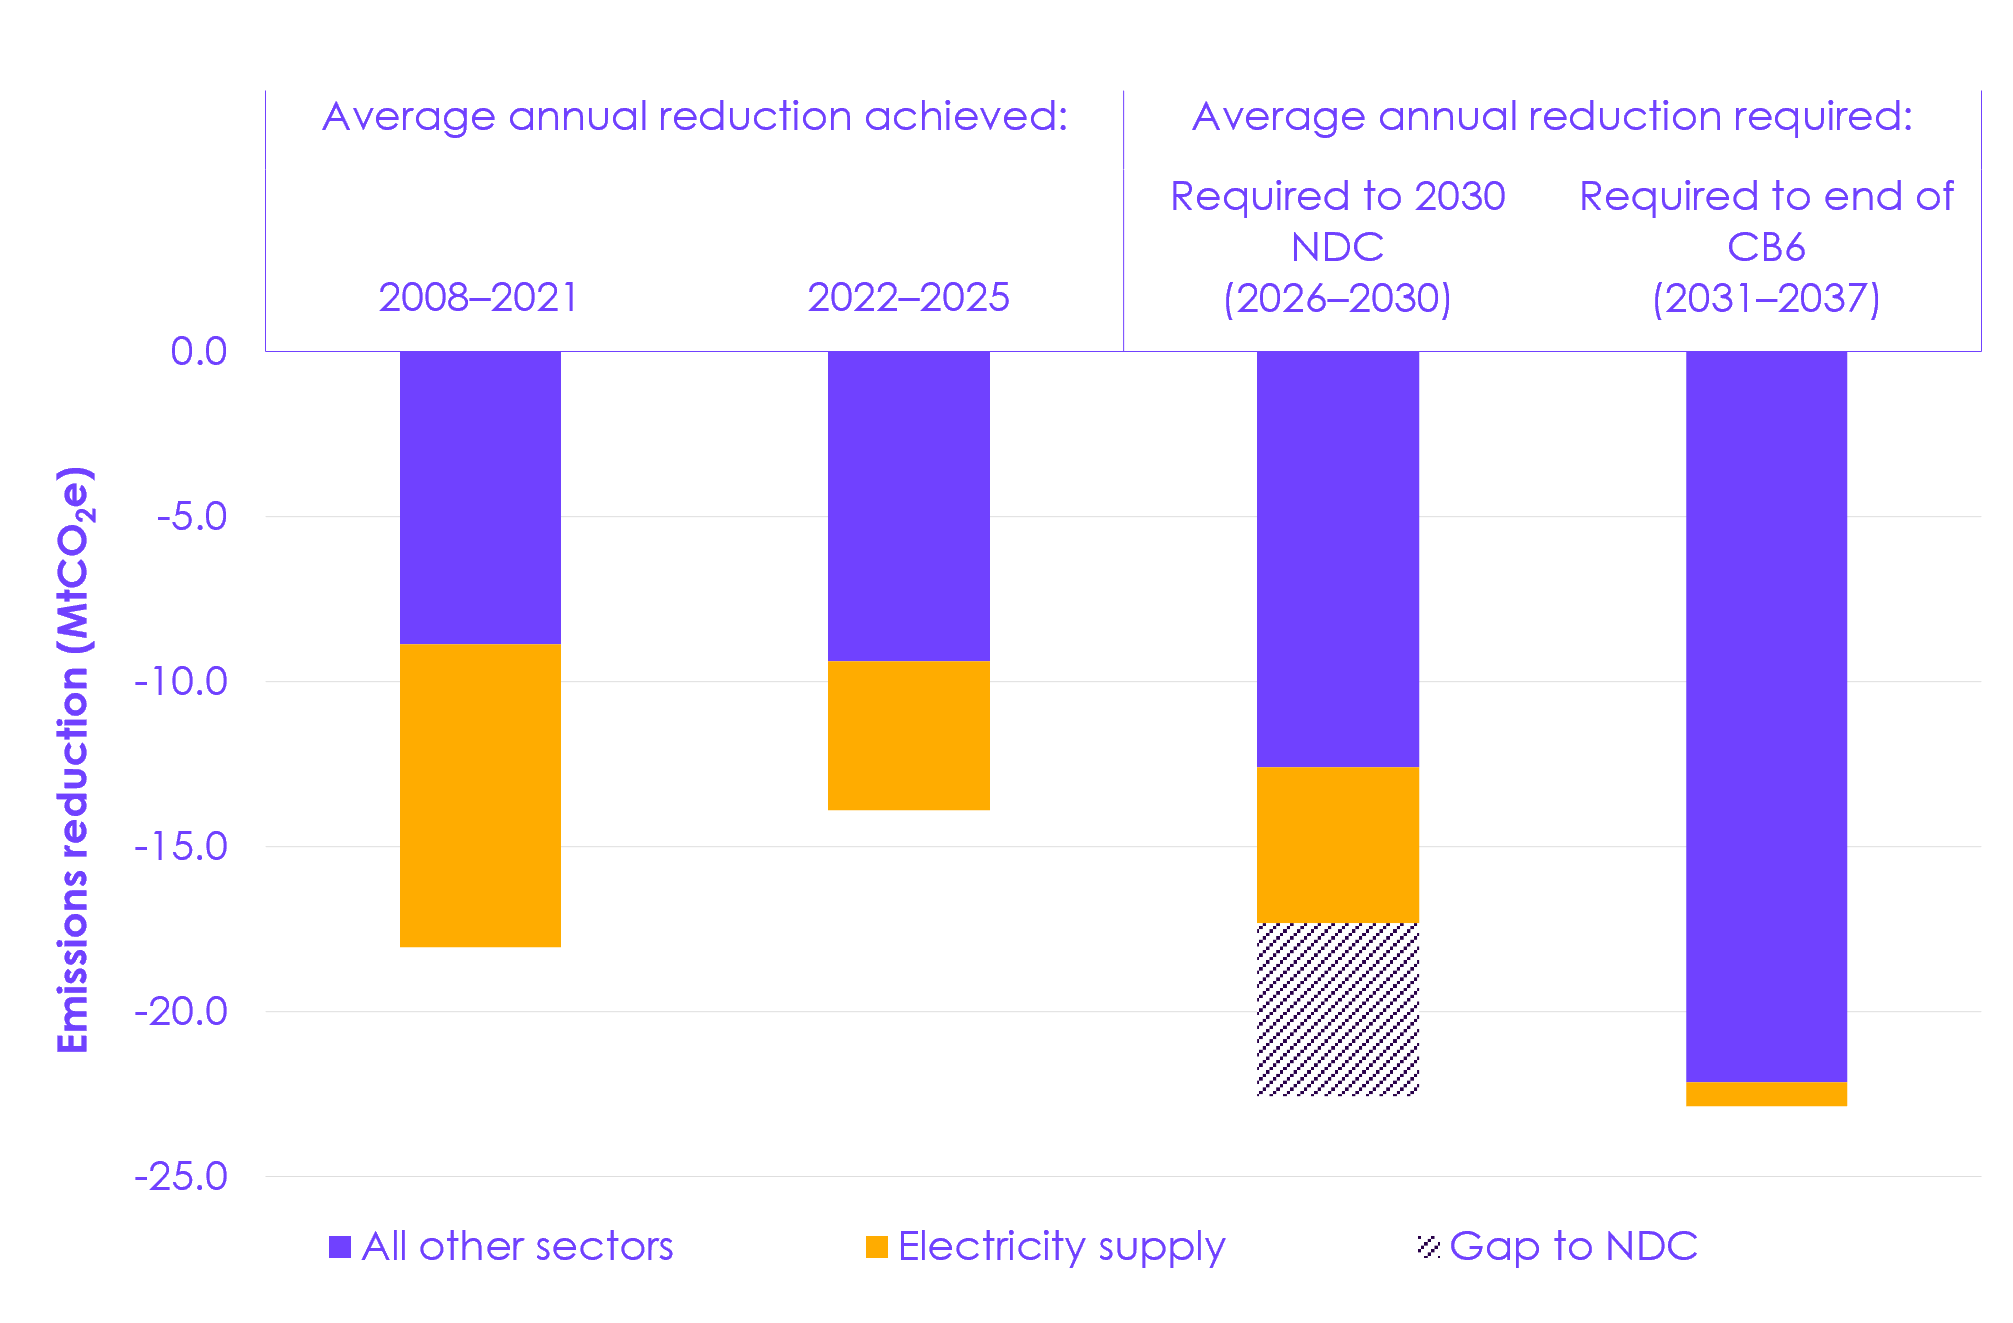 Description: The pace of emissions reduction will need to accelerate to achieve the 2030 Nationally Determined Contribution (NDC) and the Sixth Carbon Budget (CB6). To date, the electricity supply sector has contributed a large proportion of emissions reductions. Future emissions reductions will depend largely on other sectors. Source: DESNZ (2026) Provisional UK greenhouse gas emissions statistics 2025; DESNZ (2026) Final UK greenhouse gas emissions statistics: 1990 to 2024; DESNZ (2025) Carbon Budget and Growth Delivery Plan; CCC analysis. Notes: (1) These bars show emissions reductions achieved in the published data for those periods (compared to the year prior to the beginning of each period). (2) ‘CB’ refers to the UK’s carbon budgets. ‘CB1’ refers to the First Carbon Budget, subsequent numbers refer to subsequent carbon budgets. (3) The solid bars show the average annual reduction required set out in the Government’s Carbon Budget and Growth Delivery Plan (CBGDP) pathway. We have adjusted emissions in the published pathway to use the latest inventory basis, the DESNZ (2026) Final UK greenhouse gas emissions statistics: 1990 to 2024 inventory. (4) The ‘Gap to NDC’ represents the additional emissions reductions required to achieve the 2030 NDC beyond the CBGDP pathway. If these additional reductions are achieved, then the reduction required in the 2031 to 2037 period may reduce. |
2.3 Sectoral contributions to the Carbon Budget and Growth Delivery Plan pathway
2.3.1 The Carbon Budget and Growth Delivery Plan pathway by sector
The pathway set out in the CBGDP sees emissions fall across all sectors, with the biggest reductions coming from the surface transport, electricity supply, industry, and buildings sectors (Table 2.3 and Figure 2.3). There are differences between the CBGDP pathway and the previous government plans, set out in the CBDP, with less rapid emissions reductions in the CBGDP for the surface transport and buildings sectors. The CBGDP pathway also has a different sectoral balance of emissions reduction than our Balanced Pathway, which was developed in our advice on the Seventh Carbon Budget, which represents another possible route to achieving the carbon budgets and the 2030 NDC.
- Surface transport: emissions from surface transport fall from 105.4 MtCO2e in 2025 to an annual average of 44.1 MtCO2e in the Sixth Carbon Budget (2033 to 2037). This is an average annual reduction of 6.0 MtCO2e per year between 2025 and 2037. Surface transport remains the highest-emitting sector in the CBGDP pathway throughout the Fourth and Fifth Carbon Budgets.
- This emissions reduction is largely achieved through electrification, underpinned by the zero-emission vehicle (ZEV) mandate. The EV transition is being delivered by increasingly competitive markets, underpinned by the ZEV mandate’s supply side incentives and a supportive broader policy environment, including policies to support the deployment of charging infrastructure.
- The CBGDP pathway for surface transport has a slower rate of emissions reductions than in the CBDP. Emissions are therefore higher during the Fifth Carbon Budget period before catching up by the Sixth Carbon Budget period. Increasing ambition in this sector is a key opportunity to close the gap to the 2030 NDC (see Section 4.5).
- The CBGDP also assumes slower emissions reductions than our Balanced Pathway, particularly during the Fifth Carbon Budget period. This is mainly because we assume a market-led transition to EV adoption will outpace the ZEV mandate once a key tipping point of upfront price parity is met in the coming years. At this point, EVs will be cheaper to buy, as well as already being significantly cheaper to run for most drivers.
- Buildings: emissions from buildings fall from 76.3 MtCO2e in 2025 to an annual average of 51.5 MtCO2e in the Sixth Carbon Budget. This is an average annual reduction of 2.9 MtCO2e per year between 2025 and 2037. The buildings sector is expected to become the highest-emitting sector in the CBGDP pathway during the Sixth Carbon Budget period.
- This emissions reduction is largely achieved through electrification of heat in buildings after 2030, although the mechanisms to deliver much of this deployment are not yet clear.
- The CBGDP pathway for buildings has a slower rate of emissions reductions than the CBDP and our Balanced Pathway. Despite assuming a lower starting point, the CBGDP’s slow pace of emissions reduction in the early years means emissions are above the Balanced Pathway from the Fifth Carbon Budget period onwards, and are 11.1 MtCO2e higher by the end of the pathway in 2037. This is largely due to a slower assumed transition to low-carbon heating.
- However, historical emissions between 2023 and 2025 were an annual average of 2.2 MtCO2e higher than in the CBGDP pathway. Deployment of heat pumps is not yet fast enough to meaningfully reduce emissions (see Section 1.1.2).
- Agriculture: emissions from agriculture fall from 46.5 MtCO2e in 2024 to an annual average of 38.6 MtCO2e in the Sixth Carbon Budget. This is an average annual reduction of 0.7 MtCO2e per year between 2024 and 2037.
- This emissions reduction is largely achieved through efficiency measures. The largest contributions are achieved through animal diets via methane suppressing feed products and actions assigned to ‘devolved policy making’, which are not clearly explained (see Section 4.3.4).
- The CBGDP pathway assumes slower emissions reductions than our Balanced Pathway in the Sixth Carbon Budget period. This is due to the lack of policy addressing numbers of ruminant livestock.
- Industry: emissions from industry fall from 40.3 MtCO2e in 2025 to an annual average of 13.0 MtCO2e in the Sixth Carbon Budget. This is an average annual reduction of 2.5 MtCO2e per year between 2025 and 2037.
- This emissions reduction is largely achieved through electrification of industrial processes, with a smaller role for low-carbon fuels, including low-carbon hydrogen, carbon capture and storage (CCS), and resource and energy efficiency.
- The CBGDP contains a stronger focus on electrification than the CBDP, in line with growing evidence that electrification will be the main route to decarbonisation for many industries.
- The CBGDP pathway goes further than our Balanced Pathway in the Sixth Carbon Budget period. This is due to a more rapid scale up of CCS during that period.
- Aviation: emissions from aviation decrease from 37.9 MtCO2e in 2025 to an annual average of 31.0 MtCO2e in the Sixth Carbon Budget. This is an average annual reduction of 0.7 MtCO2e per year between 2025 and 2037.
- This emissions reduction is achieved through a mixture of measures. The largest contribution is from the Sustainable Aviation Fuel (SAF) mandate, followed by the UK Emissions Trading Scheme (ETS) and Carbon Offsetting and Reduction Scheme for International Aviation (CORSIA) carbon pricing increasing the cost of flying, which reduces emissions compared to the baseline by decreasing the growth rate of aviation demand. CORSIA credits, purchased by UK-registered airlines for compliance with the CORSIA, and ambitious fuel efficiency improvements also decrease emissions.
- Historical emissions in 2024 and 2025 were an annual average of 1.4 MtCO2e lower than in the CBGDP pathway, likely due to efficiency improvements from recent changes to the aircraft fleet and a small contribution from SAF uptake.
- Electricity supply: emissions from electricity supply fall from 30.3 MtCO2e in 2025 to an annual average of 2.9 MtCO2e in the Sixth Carbon Budget. This is an average annual reduction of 2.4 MtCO2e per year between 2025 and 2037.
- This emissions reduction is achieved through the expansion of low-carbon electricity supply, with extensive roll-out of renewables, supported by storage, nuclear power, and dispatchable low-carbon electricity generation.
- The CBGDP pathway assumes faster emissions reduction than our Balanced Pathway over each of the carbon budgets. This is due to a more rapid reduction in unabated gas generation.
- However, historical emissions in 2024 and 2025 were an annual average of 8.4 MtCO2e higher than in the CBGDP pathway, driven by higher fossil fuel generation than assumed in the pathway (see Section 1.1.2).
- Waste: emissions from waste fall from 28.9 MtCO2e in 2024 to an annual average of 16.5 MtCO2e in the Sixth Carbon Budget. This is an average annual reduction of 1.1 MtCO2e per year between 2024 and 2037.
- This includes measures such as CCS at energy from waste sites, the near elimination of biodegradable waste from landfill, and increasing landfill gas capture rates.
- The CBGDP pathway assumes slower emissions reductions than our Balanced Pathway over the Fourth and Fifth Carbon Budgets. This is due to less ambitious assumptions on waste reduction and the elimination of biodegradable waste from landfill. The CBGDP pathway is more ambitious during the Sixth Carbon Budget period due to assumed increases in landfill gas capture rates.
- Fuel supply: emissions from fuel supply decrease from 27.3 MtCO2e in 2025 to an annual average of 13.7 MtCO2e in the Sixth Carbon Budget. This is an average annual reduction of 1.4 MtCO2e per year between 2025 and 2037.
- The largest contributions are from measures to decarbonise oil refining (including CCS and low-carbon hydrogen use), measures to reduce emissions in oil and gas production (including reductions in flaring and venting and electrification of platforms), and reduced methane leakage from the gas distribution network. There is also a significant emissions reduction in the baseline from declining oil and gas production due to the closure of oil and gas fields as they reach end of life.
- Historical emissions in 2024 and 2025 were an annual average of 2.2 MtCO2e lower than in the CBGDP pathway. The CBGDP pathway does not reflect the closure of oil refineries in 2025, nor does it assume that a reduced demand for oil across the economy results in a further reduction in oil refining. It also assumes lower levels of reduction in methane leakage, flaring, and venting than our Balanced Pathway. This results in lower emissions reductions than our Balanced Pathway.
- Shipping: emissions from shipping decrease from 8.9 MtCO2e in 2025 to an annual average of 5.0 MtCO2e in the Sixth Carbon Budget. This is an average annual reduction of 0.4 MtCO2e per year between 2025 and 2037.
- This emissions reduction is largely achieved through regulations to reduce the GHG intensity of fuels and drive the uptake of zero and near-zero GHG emission fuels and energy sources.
- F-gases: emissions from F-gases fall from 6.5 MtCO2e in 2024 to an annual average of 1.8 MtCO2e in the Sixth Carbon Budget. This is an average annual reduction of 0.4 MtCO2e per year between 2024 and 2037.
- This emissions reduction is largely achieved through the continuation of regulatory measures to reduce the use of F-gases across the UK. This is primarily through the EU-aligned F-gas Regulation, requiring increasing reductions in use of hydrofluorocarbons.
- Land use: emissions from land use fall from 0.3 MtCO2e in 2024 to an annual average of -3.6 MtCO2e in the Sixth Carbon Budget. This is an average annual reduction of 0.3 MtCO2e per year between 2024 and 2037.
- This emissions reduction is largely achieved through actions to restore peatlands and create new woodlands.
- The CBGDP pathway is 1.7 MtCO2e below historical emissions in 2024. This is largely driven by assumed emissions savings in Northern Ireland, Scotland, and Wales in the pathway. However, land use emissions in the devolved nations did not fall substantially between 2023 and 2024 (see Section 1.2). The CBGDP pathway also assumes faster emissions reductions than our Balanced Pathway, particularly during the Sixth Carbon Budget period. This is driven by a faster emissions reduction in Northern Ireland, Scotland, and Wales in the CBGDP pathway.
- Engineered removals: contributions begin at low levels in the Fifth Carbon Budget and rapidly increase to reach an annual average of -17.4 MtCO2e of removals in the Sixth Carbon Budget.
- These removals are presented as a single policy in the CBGDP, with no detail on the technology breakdown or specific policies expected to deliver them.[90]
- The CBGDP pathway has reduced reliance on engineered removals compared to the CBDP, with significantly lower deployment assumed during both the Fifth and Sixth Carbon Budget periods. However, the CBGDP has a faster ramp-up of engineered removals in the mid-2030s, reaching a similar level to the CBDP by the end of the Sixth Carbon Budget period.
- The CBGDP pathway also assumes fewer engineered removals than our Balanced Pathway over the Fifth Carbon Budget period but has a much faster ramp-up in engineered removals over the Sixth Carbon Budget period.
| Table 2.3 Provisional UK emissions in 2025 and average annual emissions in each carbon budget period in the CBGDP |
||||
|---|---|---|---|---|
| Sector | Provisional 2025 emissions (MtCO2e) | Average annual emissions in the CBGDP pathway (MtCO2e) | ||
| Fourth Carbon Budget (2023–2027) | Fifth Carbon Budget (2028–2032) | Sixth Carbon Budget (2033–2037) | ||
| Surface transport | 105.4 | 101.7 | 80.3 | 44.1 |
| Buildings | 76.3 | 74.4 | 69.5 | 51.5 |
| Agriculture* | 46.5 | 45.9 | 41.9 | 38.6 |
| Industry | 40.3 | 43.0 | 28.4 | 13.0 |
| Aviation | 37.9 | 38.2 | 36.2 | 31.0 |
| Electricity supply | 30.3 | 22.8 | 7.4 | 2.9 |
| Waste* | 28.9 | 28.3 | 25.1 | 16.5 |
| Fuel supply | 27.3 | 29.2 | 21.1 | 13.7 |
| Shipping | 8.9 | 9.5 | 8.1 | 5.0 |
| F-gases* | 6.5 | 5.9 | 4.1 | 1.8 |
| Land use* | 0.3 | -1.0 | -1.8 | -3.6 |
| Engineered removals | 0.0 | 0.0 | -0.5 | -17.4 |
| Source: DESNZ (2026) Provisional UK greenhouse gas emissions statistics 2025; DESNZ (2026) Final UK greenhouse gas emissions statistics: 1990 to 2024; DESNZ (2025) Carbon Budget and Growth Delivery Plan; CCC analysis. Notes: (1) Sectors marked with an asterisk (*) are those for which provisional emissions are mostly based on projections rather than real-world data. For these sectors, the final 2024 emissions have been used instead of the 2025 provisional emissions. (2) The Carbon Budget and Growth Delivery Plan (CBGDP) projections include quantified policies and plans. These projections also include wider factors and cascade effects, based on an assumed split of the abatement set out in the CBGDP, among the sectors in which they are expected to be able to deliver emissions reduction. We have adjusted emissions in the published pathway to use the latest inventory basis (the 1990 to 2024 inventory). (3) The CBGDP was published before 2025 emissions data were available. Provisional 2025 emissions are lower than the CBGDP pathway Fourth Carbon Budget average annual emissions in the industry, aviation, fuel supply, and shipping sectors. |
||||
| Figure 2.3 Comparing the CBGDP pathway and our Balanced Pathway by sector |
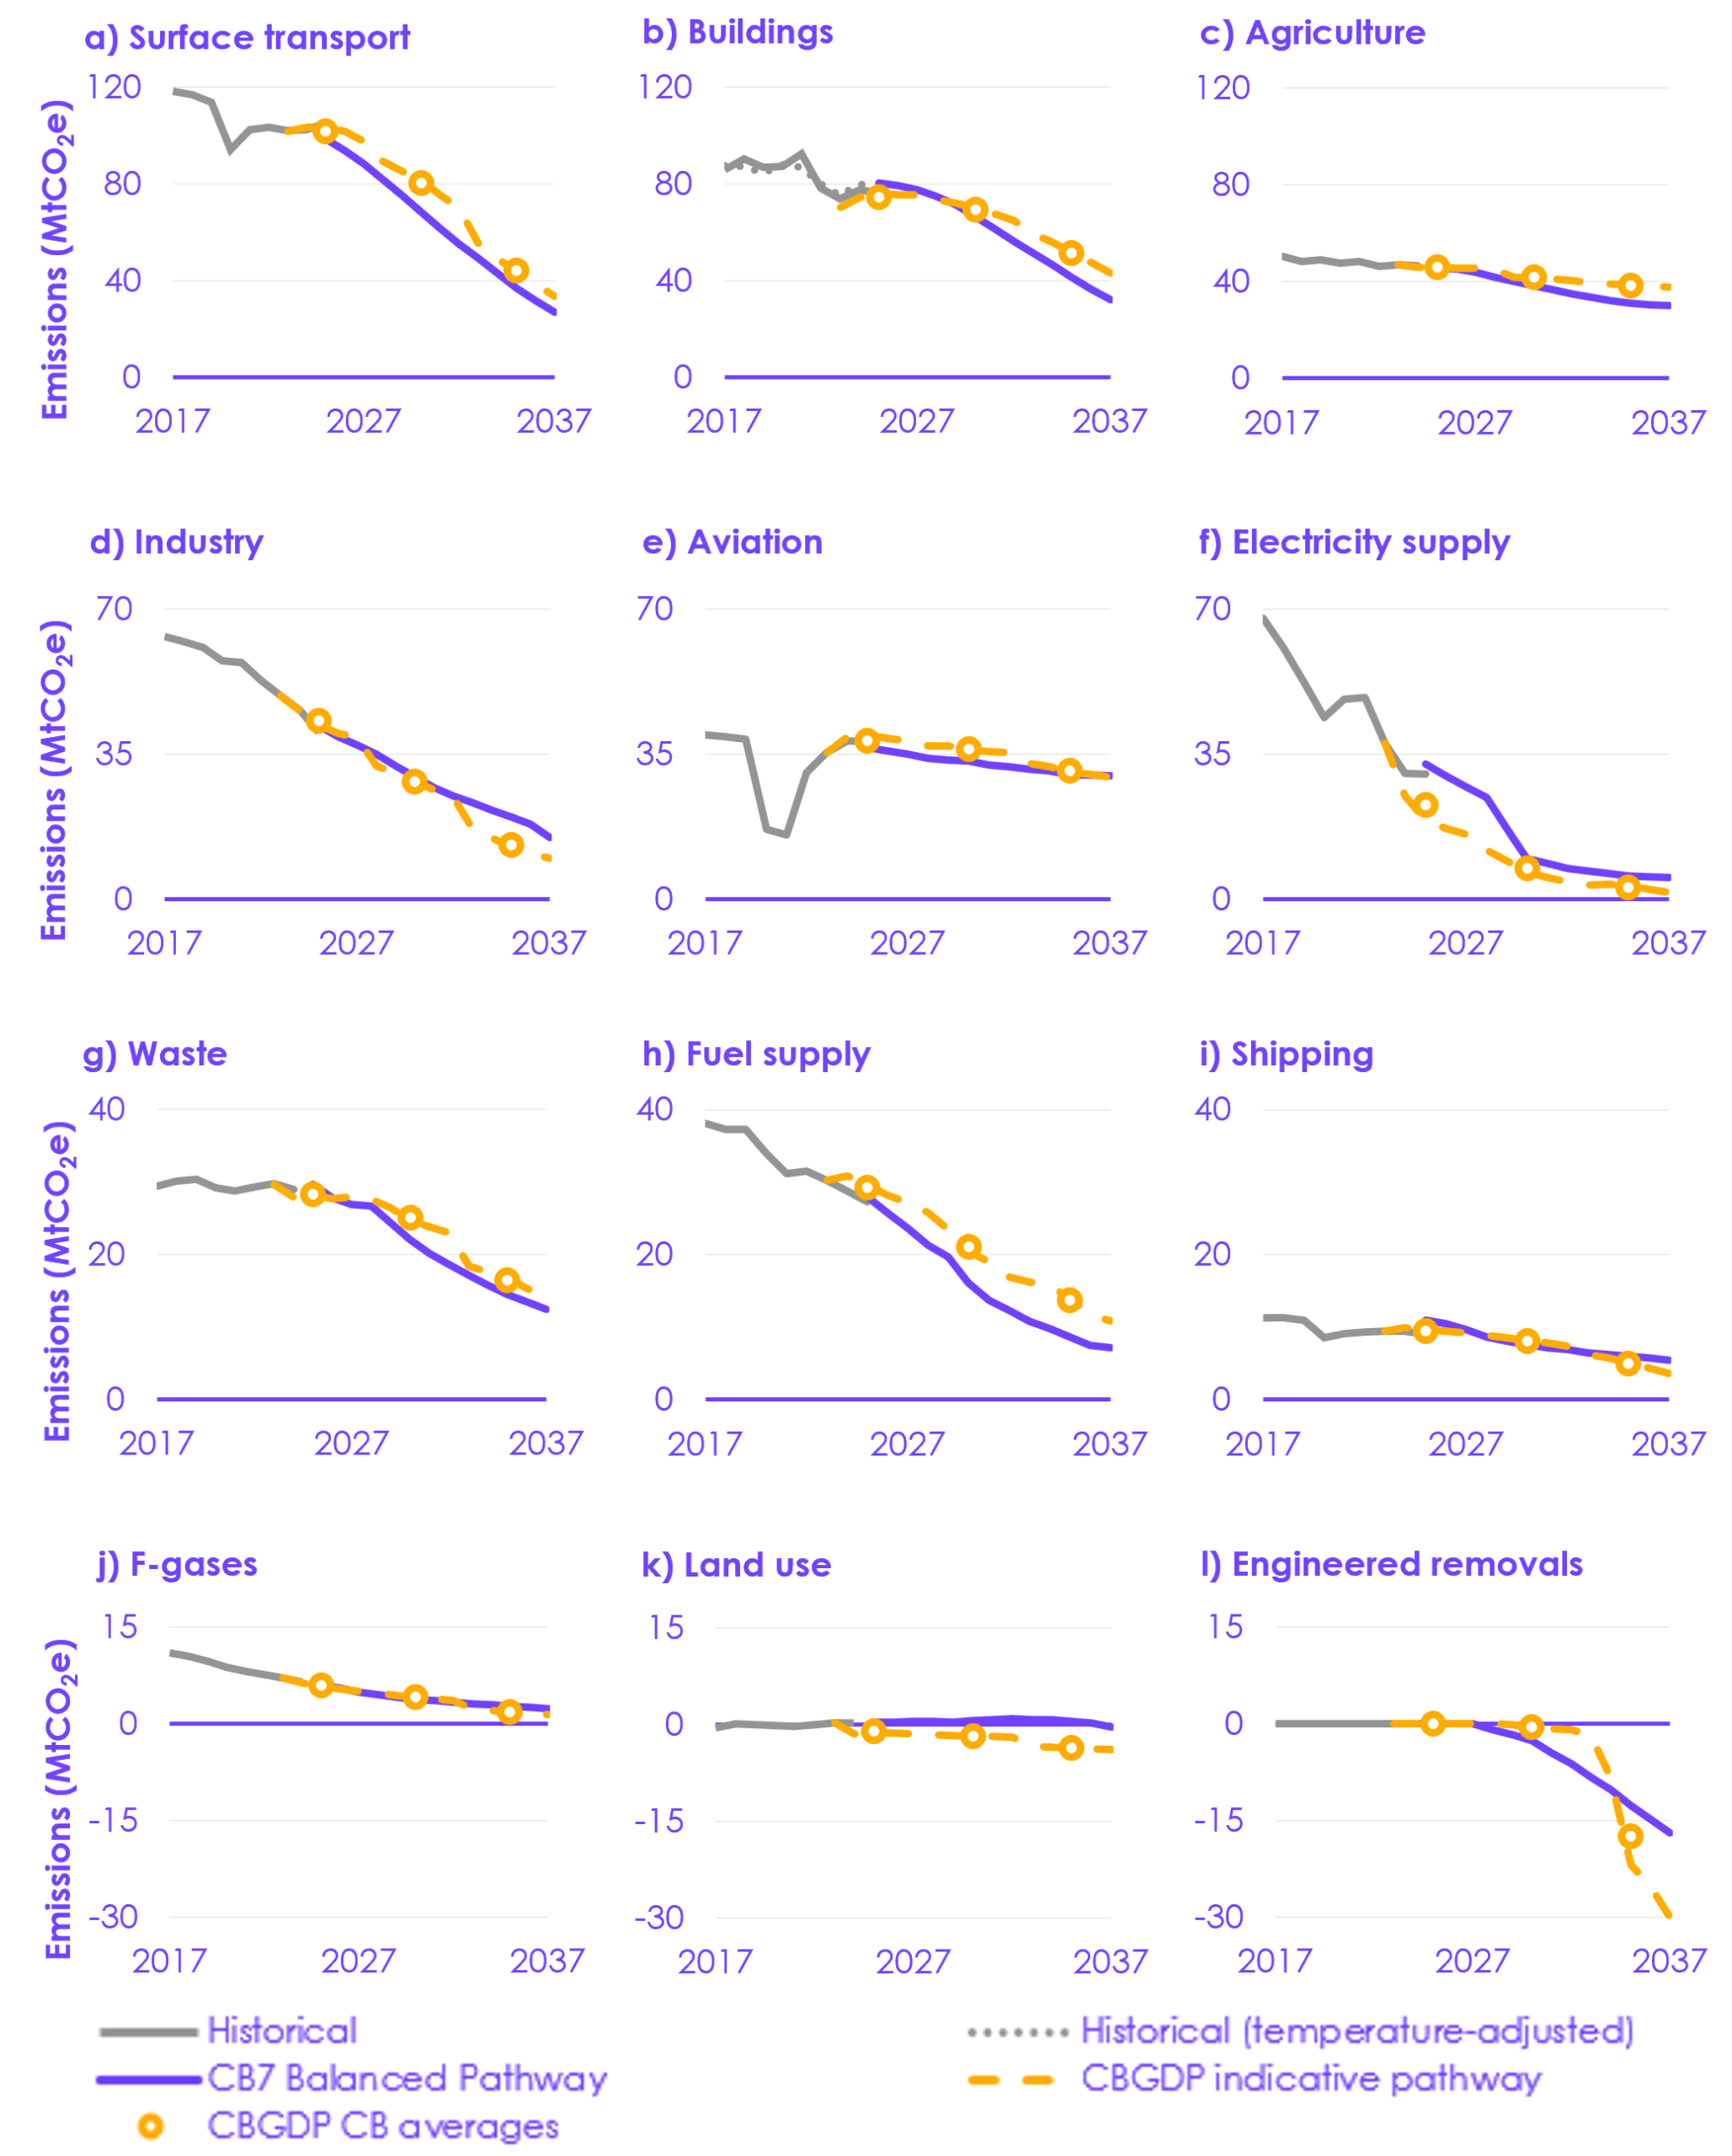 Description: The main differences between the Carbon Budget and Growth Delivery Plan (CBGDP) pathway and our Seventh Carbon Budget (CB7) Balanced Pathway are in surface transport and buildings (where in both cases the CBGDP assumes slower emissions reduction than the Balanced Pathway), and in engineered removals (where the CBGDP assumes slower initial growth followed by a faster ramp-up in the 2030s). Source: DESNZ (2026) Provisional UK greenhouse gas emissions statistics 2025; DESNZ (2026) Final UK greenhouse gas emissions statistics: 1990 to 2024; DESNZ (2025) Carbon Budget and Growth Delivery Plan; CCC analysis. Notes: (1) The historical data uses the DESNZ (2026) Provisional UK greenhouse gas emissions statistics 2025 inventory. We have adjusted emissions in the published CBGDP pathway and the CB7 Balanced Pathway to use the latest inventory basis, the DESNZ (2026) Final UK greenhouse gas emissions statistics: 1990 to 2024 inventory. (2) ‘CB’ refers to the UK’s carbon budgets. (3) The orange CBGDP pathway and CBGDP CB averages data includes wider factors and cascade effects based on an assumed split of the abatement set out in the CBGDP among the sectors in which they are expected to be able to deliver emissions reduction. The largest share of this abatement is within the surface transport and buildings sectors. (4) In chart h), the CCC pathway for shipping has a higher starting point than the CBGDP pathway as we used the UK Department for Transport’s emissions model as the starting point for the majority of emissions in shipping. This was based on potential future changes to the inventory. |
2.3.2 Distribution of future emissions reductions
Future emissions reductions in the CBGDP
Since the introduction of the Act in 2008, 47% of emissions reductions have been in the electricity supply sector (Figure 2.4). However, electricity supply is now largely decarbonised, with emissions 82% lower in 2025 than in 2008.
- Electricity supply will make up a declining share of emissions reduction over the CBGDP pathway, contributing 26% of the emissions reduction required to 2030 in the CBGDP pathway and just 3% of the emissions reduction required from then until the end of the Sixth Carbon Budget (2037).
- However, further expanding low-carbon generation, electricity storage, flexibility, and supporting network infrastructure remains critical to electrification of other sectors.
The industry and fuel supply sectors have contributed around of a quarter of emissions reductions over the period since 2008. These sectors will continue to make an important contribution to the CBGDP pathway.
- Reductions in industry have largely been achieved by shifting to less emissions-intensive industrial activity. Sometimes emissions-intensive industrial sites can reduce high-carbon activity ahead of adopting low-carbon alternatives, for example Port Talbot Steelworks, which is converting to an electric arc furnace (see Section 1.1.2).
Action needs to broaden across a wider range of sectors to deliver the emissions reductions that are required to achieve the UK’s emissions targets (Figure 2.4).
- In the Government’s CBGDP pathway, this is largely driven by electrification in the surface transport, buildings, and industry sectors. 47% of emissions reductions required to 2030 in the CBGDP pathway are projected to come from these sectors. This increases to 55% from then until 2037.
- The Government’s pathway also has a high reliance on engineered removals to achieve the Sixth Carbon Budget, with over 17% of emissions reductions coming from this sector over the period 2031 to 2037. As a sector yet to begin deployment and with uncertainty over elements of future policy and funding mechanisms, this is an area with significant risk.
| Figure 2.4 Distribution of emissions reduction by sector in the CBGDP |
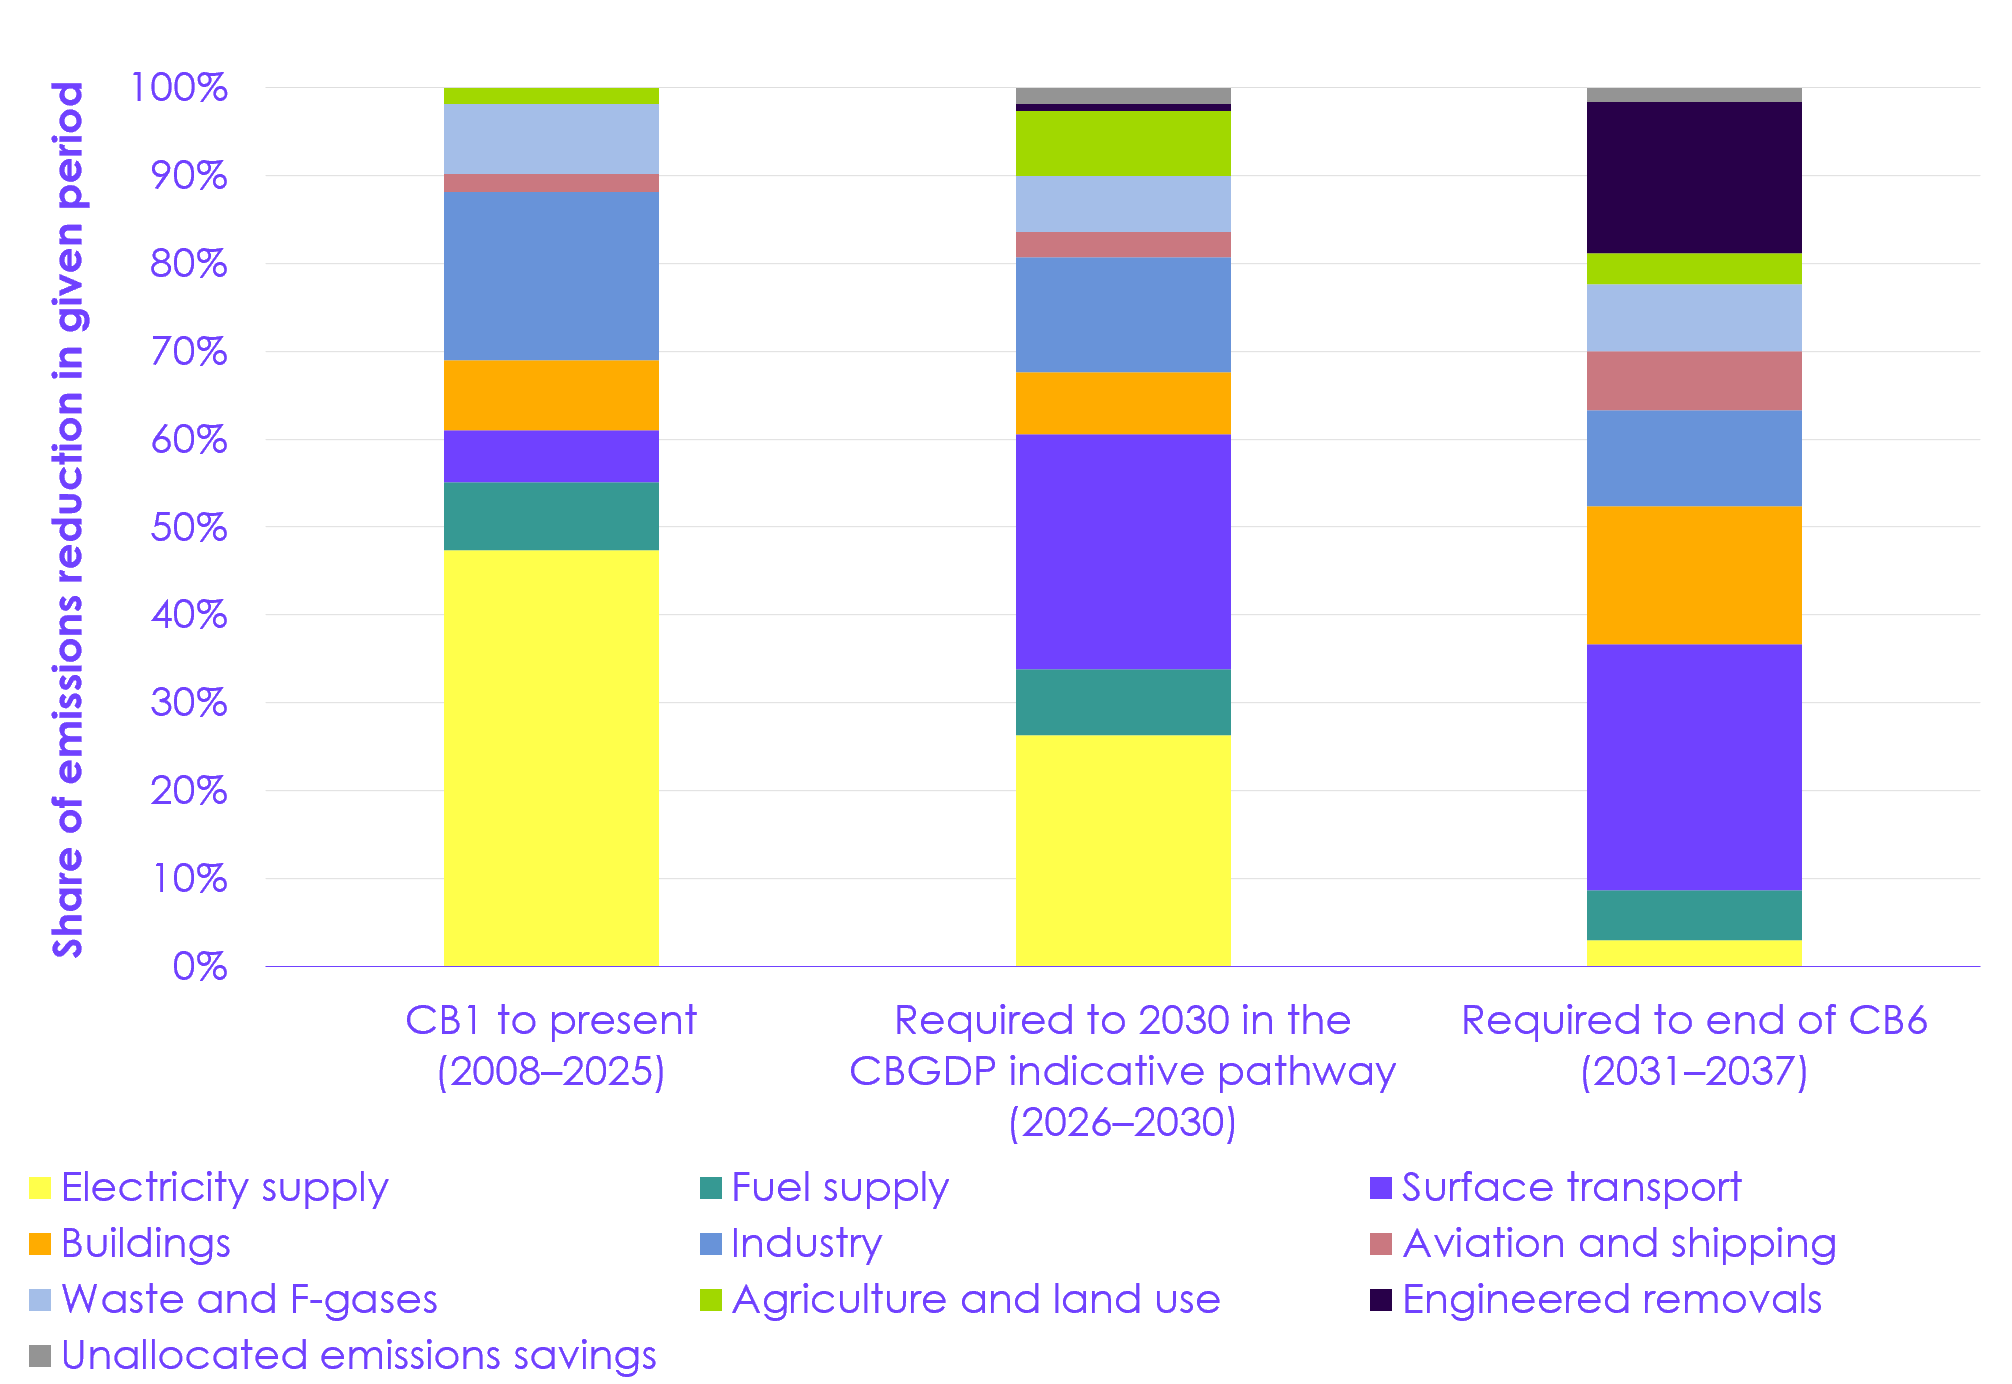 Description: Nearly half of emissions reductions since the introduction of the Climate Change Act 2008 have come from the electricity supply sector. Emissions reductions will increasingly need to come from other sectors, with surface transport, buildings, and industry playing a key role. Engineered removals are expected to play a crucial role in offsetting emissions in the Sixth Carbon Budget period. Source: Department for Energy Security and Net Zero (DESNZ) (2026) Provisional UK greenhouse gas emissions statistics 2025; DESNZ (2026) Final UK greenhouse gas emissions statistics: 1990 to 2024; DESNZ (2025) Carbon Budget and Growth Delivery Plan; CCC analysis. Notes: (1) These bars show emissions reductions achieved in the published data for those periods (compared to the year prior to the beginning of each period). (2) ‘CB’ refers to the UK’s carbon budgets. ‘CB1’ refers to the First Carbon Budget, subsequent numbers refer to subsequent carbon budgets. (3) The CBGDP projections include quantified policies and plans, including wider factors and cascade effects. Unallocated emissions savings refer to wider factors and cascade effects that span multiple sectors. (4) We use grouped sectors for the waste and F-gases, aviation and shipping, and agriculture and land use sectors in this chart. |
Key abatement measures
The CBGDP pathway is delivered through five key sources of abatement: electricity, demand,
low-carbon fuels and CCS, nature, and engineered removals (Figure 2.5). Many of the solutions are available today and could be rapidly deployed, provided the right incentives are put in place. Other solutions, particularly within low-carbon fuels and engineered removals, are less certain and industry and government should continue to pursue multiple options for now.
- Electrification and the expansion of low-carbon electricity supply is the key source of abatement in the CBGDP pathway, delivering 55% of the emissions reduction required in the CBGDP pathway.[91] The largest contribution to electrification comes from EVs.
- Demand also has an important role, delivering 19% of the emissions reduction in the CBGDP pathway through efficiency measures and low-carbon choices. The majority of these emissions reductions relate to efficiency measures. Low-carbon choices provide a smaller contribution in the CBGDP pathway than in our Balanced Pathway. Around one-quarter of the emissions reductions from demand relate to wider factors, which have a significant contribution from artificial intelligence (AI) enabled efficiency measures.
- Low-carbon fuels and CCS delivers 13% of the emissions reduction in the CBGDP pathway, with a further 3% provided by nature-based measures. Although this contribution from nature is small, actions taken today will have a larger impact on future emissions – including achieving the Net Zero target – due to the time lag between trees being planted and delivering meaningful carbon sequestration.
- Engineered removals deliver 10% of the emissions reduction in the CBGDP pathway. This contribution increases quickly in the 2030s.
| Figure 2.5 Sources of abatement in the CBGDP |
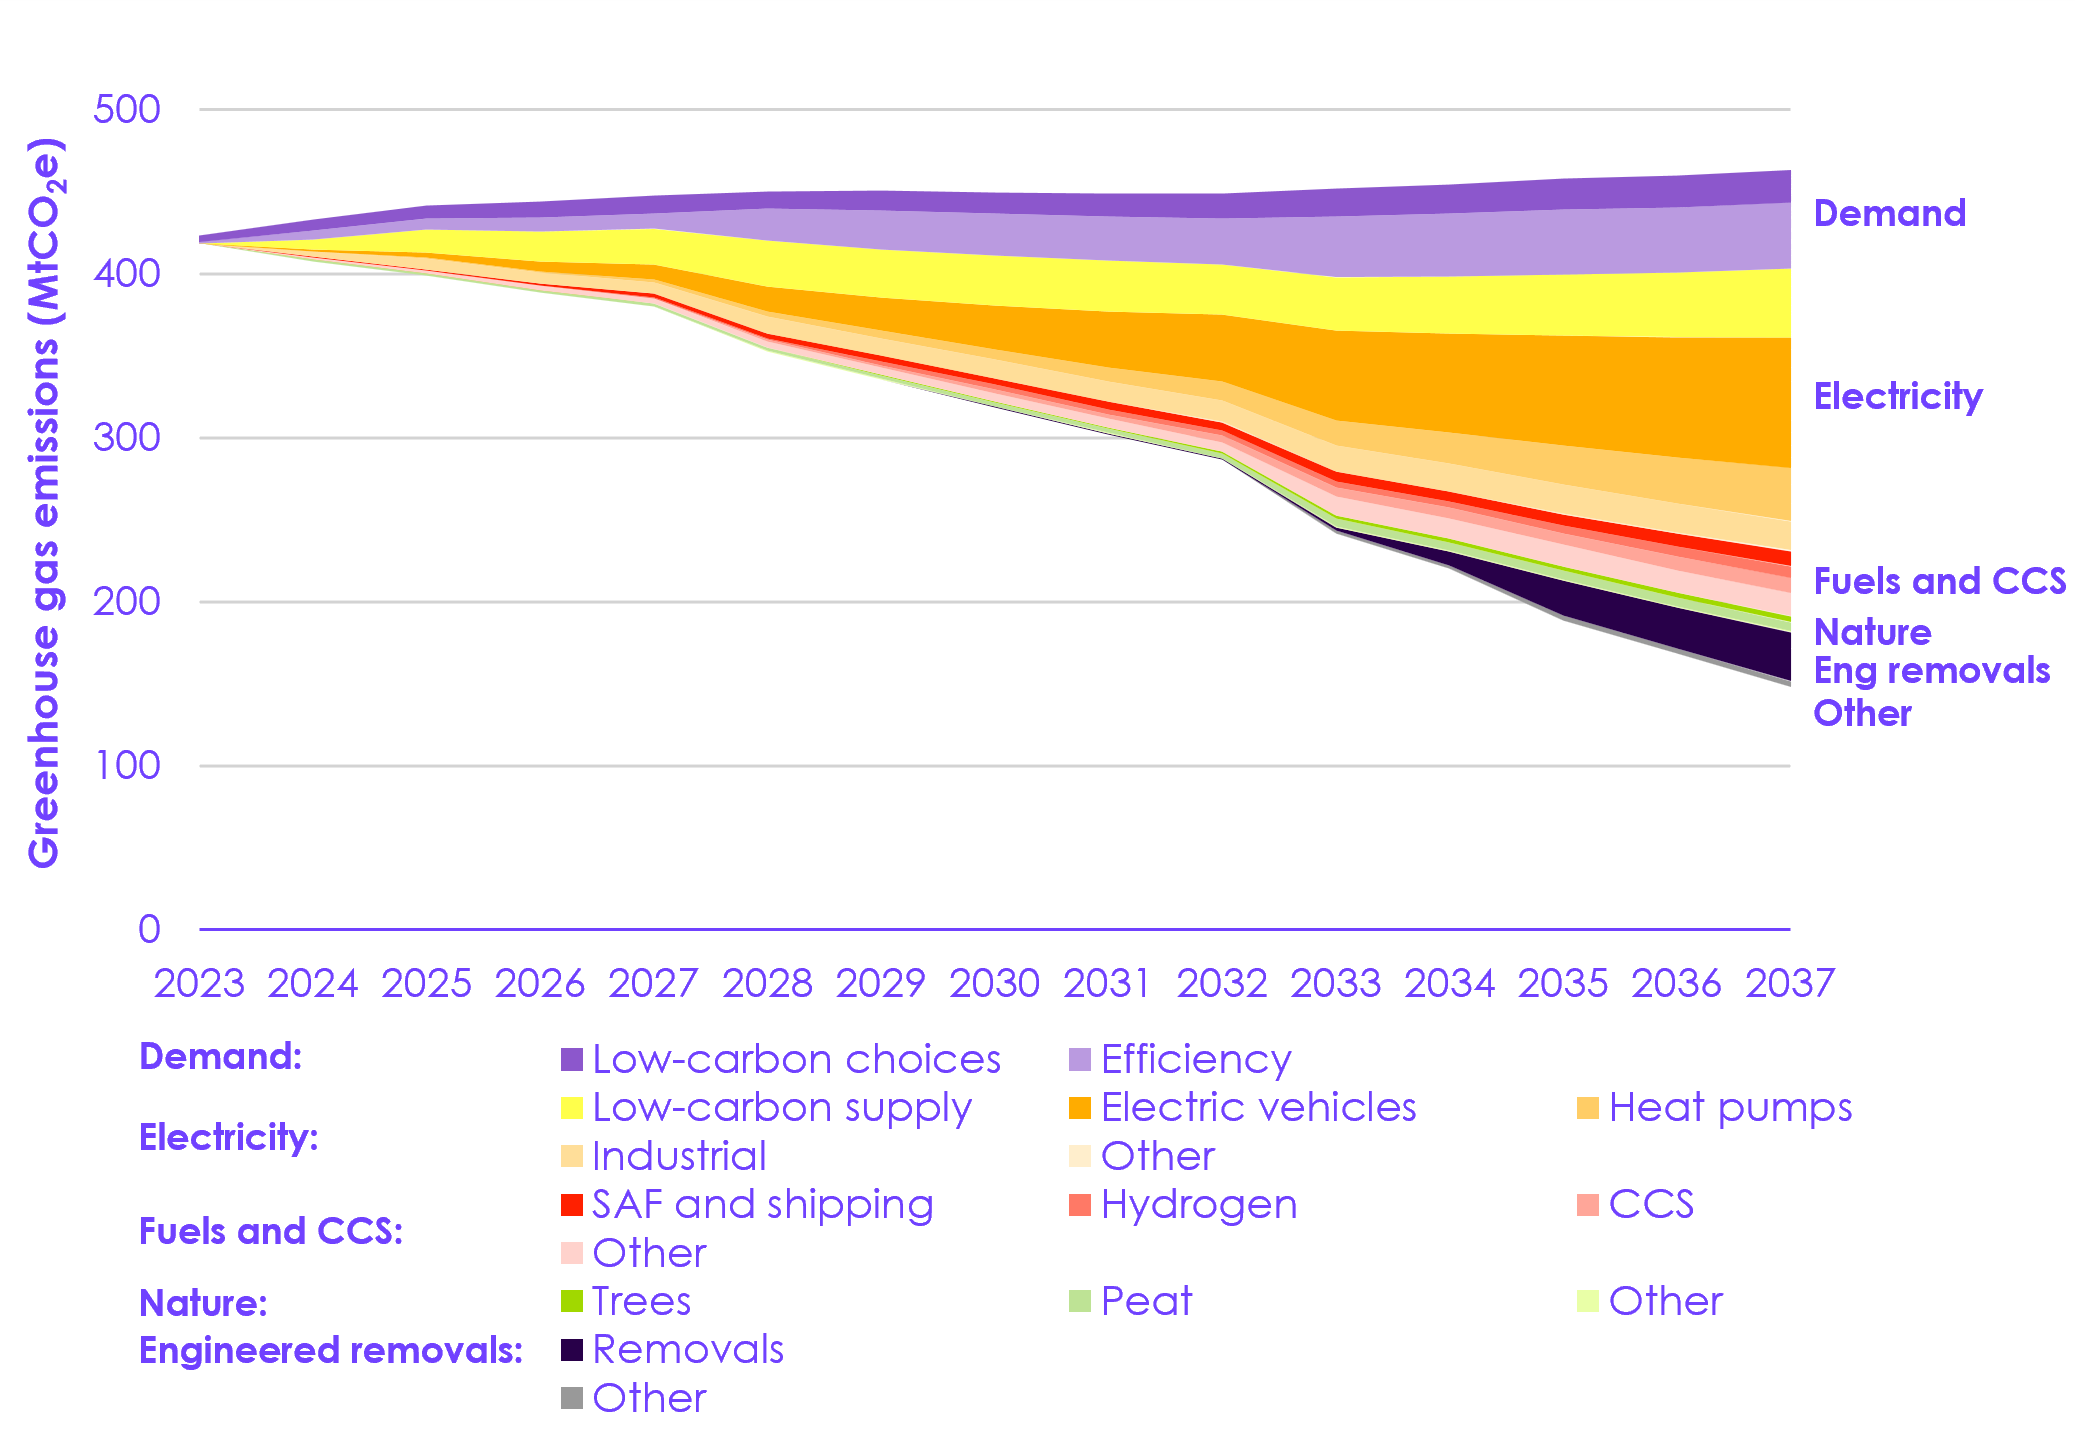 Description: The Government’s pathway is largely driven by electrification and the expansion of low-carbon electricity supply and has a high reliance on engineered removals to achieve the Sixth Carbon Budget – this is an area with significant risk. Source: DESNZ (2026) Provisional UK greenhouse gas emissions statistics 2025; DESNZ (2026) Final UK greenhouse gas emissions statistics: 1990 to 2024; DESNZ (2025) Carbon Budget and Growth Delivery Plan; CCC analysis. Notes: (1) The CBGDP projections include quantified emissions savings from the policies and plans set out in the plan, including wider factors and cascade effects and the adjustments to the baseline set out in Section 4.2.1. The chart is based on an approximate categorisation of these into the measure groups shown. Where a policy could span multiple types of measure, we have used our judgement to assign it to the category that is expected to cover the largest share of abatement by the end of the plan period. As a result, the exact contributions expected from each type of measure may differ from those shown in the chart. (2) ‘Electric vehicles’ includes electrification of cars, vans, motorcycles, buses, and HGVs. ‘Heat pumps’ includes heat pumps for heating or hot water in residential, public, and commercial buildings (including those used in communal heating and heat networks). ‘Industrial electrification’ covers all electricity use in industry, including for heating, machinery, and other industrial processes. ‘Low-carbon supply’ shows the abatement from decarbonising electricity generation. All of these are enabled by improvements to the grid. (3) ‘CCS’ covers the abatement due to the direct use of carbon capture and storage (CCS) to capture CO2 from emitting processes outside the electricity system – it is also used, alongside hydrogen, to enable use of long-term storable fuels for dispatchable generation in the electricity supply sector and to underpin engineered removals. (4) ‘Eng removals’ refers to engineered removals. ‘SAF’ refers to sustainable aviation fuel. |
Further reductions to achieve the 2030 NDC
The CBGDP pathway does not achieve the 2030 NDC target (Figure 2.6). Additional emissions reductions beyond the pathway will be needed in some sectors, making up 23% of the total emissions reductions required by 2030. The Government states in the CBGDP that it is committed to delivering its international commitments, including the 2030 and 2035 NDCs, and that it will need to explore further measures to achieve the targets. See Section 4.5 for further discussion of potential options to achieve the 2030 NDC, predominantly by accelerating electrification.
| Figure 2.6 Emissions reduction by sector in the CBGDP and the gap to the 2030 NDC |
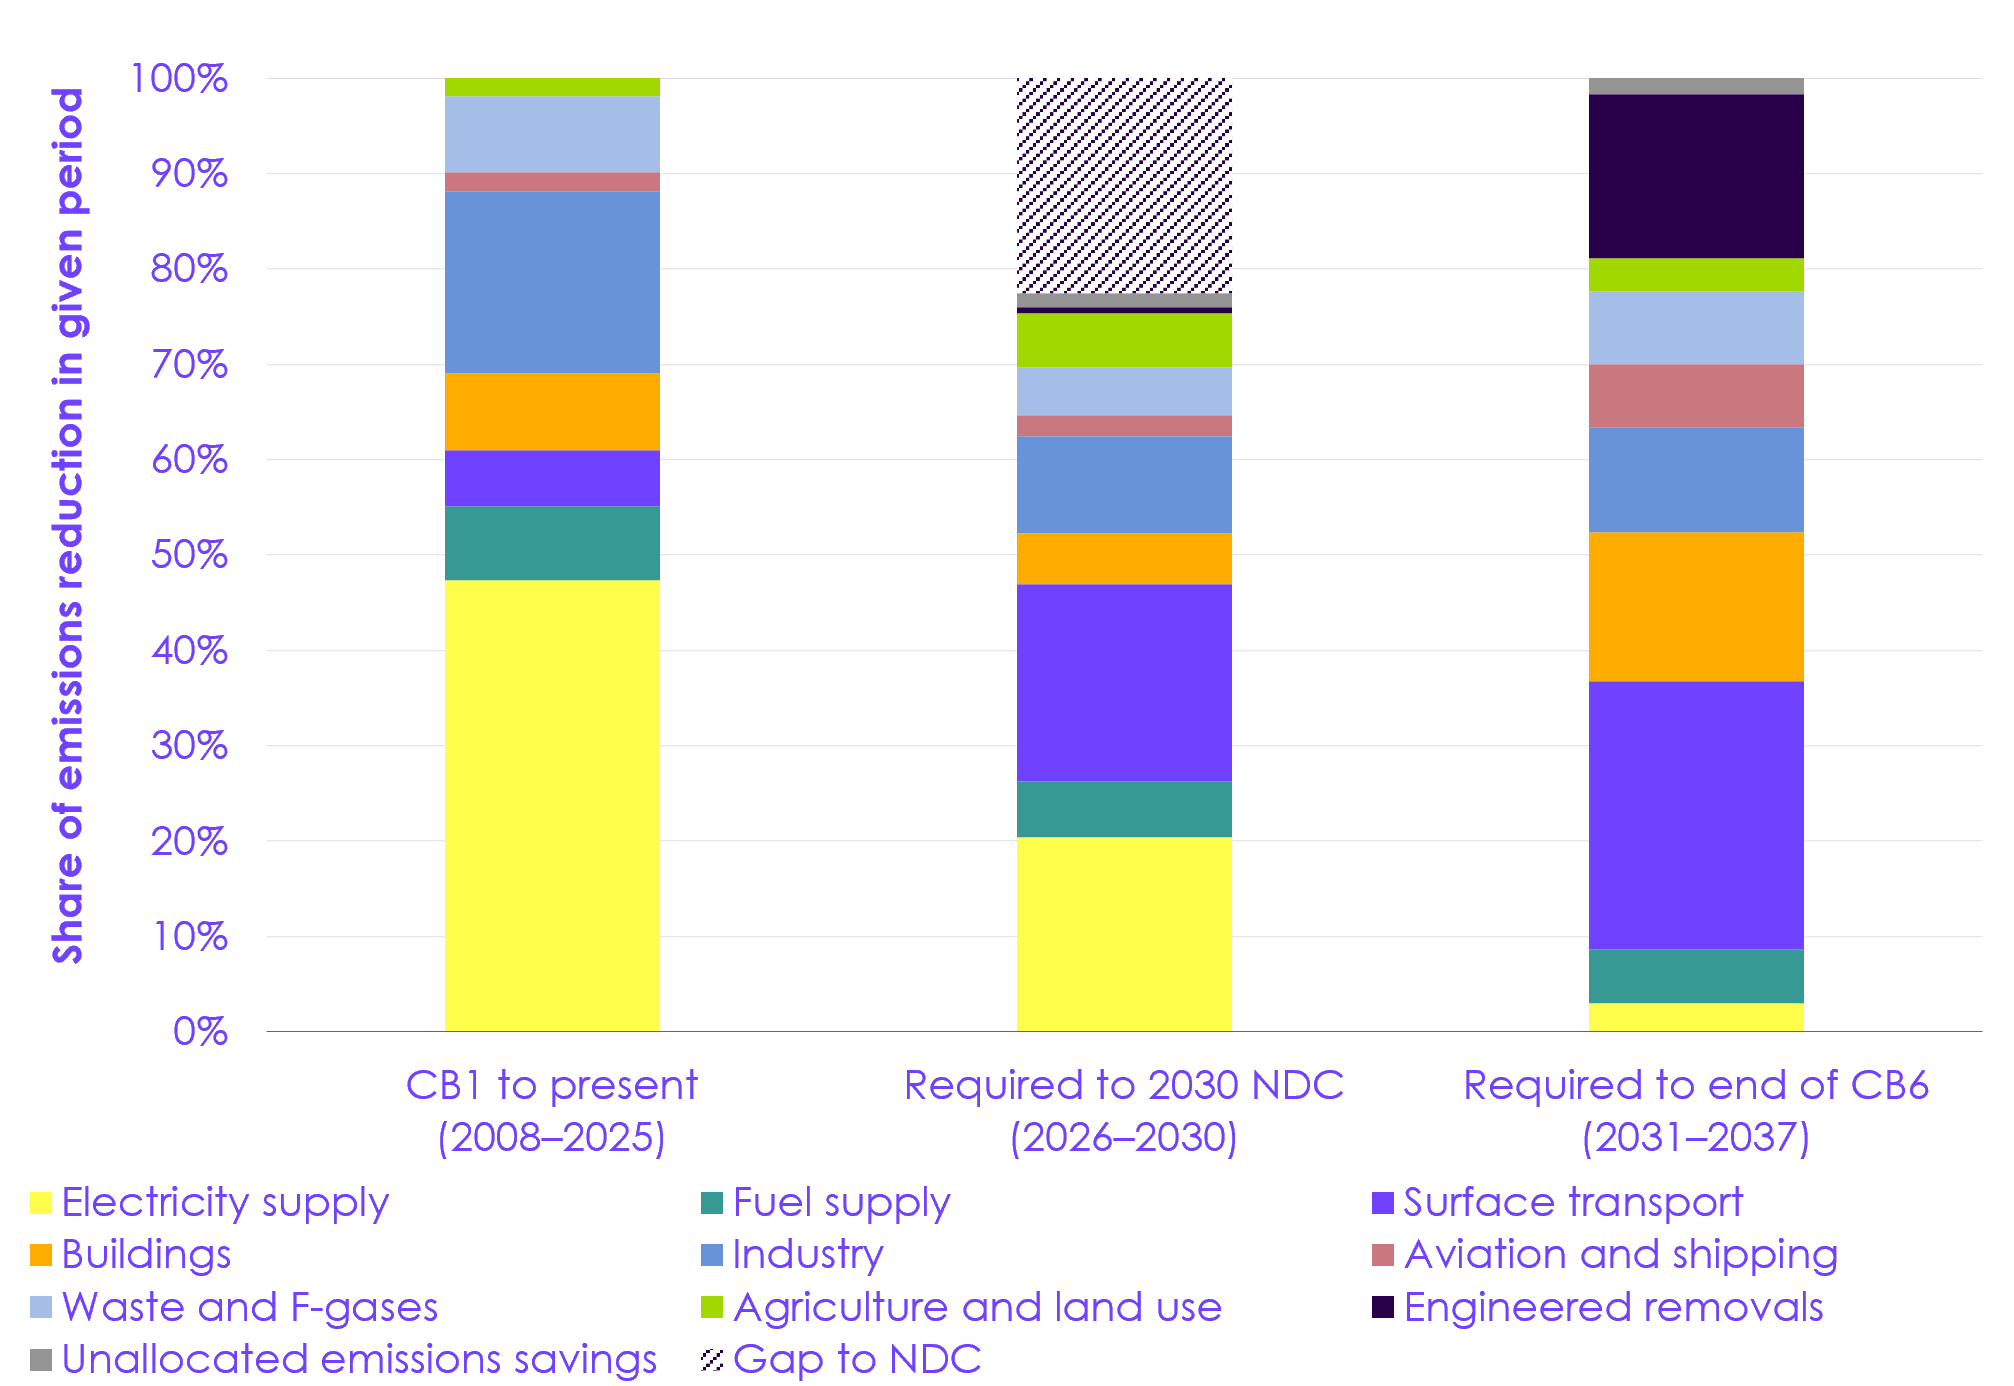 Description: To achieve the UK’s 2030 Nationally Determined Contribution (NDC), reductions will need to go beyond the UK Government’s Carbon Budget and Growth Delivery Plan (CBGDP) pathway. Source: DESNZ (2026) Provisional UK greenhouse gas emissions statistics 2025; DESNZ (2026) Final UK greenhouse gas emissions statistics: 1990 to 2024; DESNZ (2025) Carbon Budget and Growth Delivery Plan; CCC analysis. Notes: (1) These bars show emissions reductions achieved in the published data for those periods (compared to the year prior to the beginning of each period). (2) ‘CB’ refers to the UK’s carbon budgets. ‘CB1’ refers to the First Carbon Budget, subsequent numbers refer to subsequent carbon budgets. (3) The CBGDP projections include quantified policies and plans, including wider factors and cascade effects. (4) We use grouped sectors for the waste and F-gases, aviation and shipping, and agriculture and land use sectors in this chart. (5) Unallocated emissions savings refer to wider factors and cascade effects that span multiple sectors. (6) The ‘Gap to NDC’ represents the share emissions reductions required that go beyond the Carbon Budget and Growth Delivery Plan to achieve the 2030 NDC. |
2.4 Treatment of uncertainties in the CBGDP
2.4.1 Key sources of uncertainty
The CBGDP acknowledges that there are a range of significant uncertainties that could affect the UK’s emissions reduction pathway. Uncertainties could both act to increase or reduce emissions relative to the central pathway.
- Population and GDP growth, emissions accounting methodologies, and fuel costs are key sources of uncertainty. There are also uncertainties in how key technology costs will evolve, as well as year-to-year weather fluctuations and general trends in weather, including from climate change. Uncertainties vary across sectors.
- There is also a risk that policies and proposals could fail to deliver the expected level of emissions reductions. The risks associated with each policy or proposal will vary, but could include bottlenecks in scaling up supply chains, changing technology costs, evolving consumer preferences, and delays to infrastructure roll-out.
- In either case, it is important to monitor both the emissions trajectory (see Chapter 1) and underlying indicators of progress (see Chapter 3), as well as factors such as GDP, population, the GHG emissions inventory methodology, costs, and any wider factors that are assumed to play a key role in delivering the pathway. This will enable early identification of a long-term risk of underperforming on emissions reductions and allow the Government to use contingency options (see Section 2.4.3).
- The trajectories included in the CBGDP are not sufficient to monitor progress (see Section 3.1).
2.4.2 The CBGDP’s approach to uncertainty
Quantified emissions savings for individual policies and proposals
In the CBGDP, the Government states that it has confidence that the quantified emissions savings for each individual policy and proposal in the pathway are credible and take delivery risks into account.
- The quantified emissions savings included in the energy and emissions projections (EEP) baseline are assumed to be low risk as the policies have either already been implemented or are planned policies where funding has already been agreed and the policy design is near final.
- However, we assess that some policies included within the EEP baseline carry a higher level of risk, such as the SAF mandate (see Section 4.3).
- Policies and proposals that are additional to the EEP baseline are assumed to be higher risk, given the inherent implementation risk associated with long-term policy making. The Government states that it is confident that it has measures in place to manage risks to their implementation, or measures that can be implemented if necessary, to ensure that the stated emissions savings for each individual policy and proposal will be delivered at a minimum.
Other early-stage policies
The Government has identified a set of policies that are very early in their stage of development, but which are expected to contribute to the overall CBGDP pathway. This includes exploring the implementation of a long-term methane capture scheme and investment in peatland research to improve mapping and emissions data.
For these ‘other early-stage policies’, the Government has provided an indicative estimate for the scale of emissions savings that are expected to be achieved in the Sixth Carbon Budget, based on currently available evidence. These policies are not expected to contribute to earlier carbon budgets or the 2030 NDC.
In previous plans, the emissions savings from early-stage policies were unquantified. We welcome the approach in the CBGDP to attempt to quantify early-stage policies and encourage the Government to continue to develop the evidence base in these areas.
Wider factors and cascade effects
The CBGDP includes an assessment of the potential for wider factors and cascade effects to deliver additional emissions savings beyond those delivered through policies.
- Wider factors are defined as the potential for social trends to evolve or technological breakthroughs to occur independently of government action to reduce emissions. This could include emissions savings resulting from greater optimisation of the energy system using AI, energy-saving behaviour in homes, or diet change. These areas are inherently uncertain but could act to reduce emissions faster than expected.
- Cascade effects are defined as changes that propagate through connected systems and can both enable faster change or hinder delivery in other parts of the system. For example, someone who has a positive experience switching to an EV may be more likely to get a heat pump, rooftop solar, or a battery energy storage system.
It is a reasonable approach to estimate the potential of wider factors and cascade effects to deliver additional emissions reductions. However, the CBGDP only includes wider factors and cascade effects that deliver additional emissions reductions. Therefore, there is a risk that this approach overestimates the net impact on emissions, as wider factors could also act to increase emissions.
- For example, the potential for AI to improve emissions reduction is nuanced: AI could reduce emissions by helping drive efficiencies across a range of emissions-intensive processes or accelerating adoption of low-carbon technologies. These possibilities are the focus of the AI-related wider factors set out in the CBGDP.
- However, AI is power intensive, which creates the risk that significant growth in its use could increase emissions in the electricity supply sector beyond those assumed in the CBGDP pathway if that power comes from additional fossil-fuelled generation.
The Government should provide more detail in the next delivery plan on how the estimated emissions savings from wider factors and cascade effects have been quantified and how these emissions savings will be monitored.
Enabling policies and proposals
The CBGDP also includes a set of ‘enabling’ policies and proposals. These are policies that underpin the delivery of the quantified emissions reductions but do not have direct quantified emissions savings. These enablers include policies to support innovation, develop supply chains, and support the public to make low-carbon choices.
2.4.3 Contingency planning
The Government has confidence that the CBGDP pathway is deliverable and that sufficient mitigations and contingencies are in place to ensure that the planned emissions reductions are achieved.
However, the CBGDP acknowledges that there are a range of uncertainties and risks that could affect the delivery of the planned emissions pathway either positively or negatively. We therefore encourage the Government to set out an explicit assessment of contingency options that can be implemented to deliver additional emissions reductions should any aspects of the CBGDP pathway not deliver as expected. This should be included as part of the upcoming delivery plan for the Seventh Carbon Budget (2038 to 2042). Effective progress monitoring and the ability to adjust plans accordingly if things go off track are essential to the effective delivery of the plan.
- The contingency actions that could have the largest impact are expected to change in different carbon budget periods. A credible contingency framework should include contingency options that can address risks across different timescales and should include a mix of measures with longer lead times and those that could be implemented quickly if needed. The Government should undertake low-cost preparatory measures to reduce lead times where possible.
- The Government could explore contingency options in areas where the CBGDP has slower emissions reductions than the Balanced Pathway developed for our 2025 Seventh Carbon Budget advice. Our Balanced Pathway provides an alternative, cost-effective route to Net Zero that achieves all carbon budgets. In some sectors, our Balanced Pathway goes further than the CBGDP pathway.
- Contingency options could include a faster uptake of electric vehicles and heat pumps, stronger action to enable modal shift, and more ambition on recycling rates and a reduction of biodegradable waste to landfill (see Section 4.5).
Chapter 3: Indicators of current delivery progress
In this chapter, we assess progress in delivering the changes that are required to achieve the UK’s emissions targets. This includes monitoring the pace at which markets for low-carbon technologies are growing, their prices are falling, and low-carbon choices by households and businesses are developing.
Our key messages are:
- Overall progress: there is mixed progress this year, with 15 of the 31 assessed indicators on track to achieve government targets. A further three indicators are almost on track, and six indicators are off track or significantly off track.
- Electricity supply: there has been progress on low-carbon electricity deployment. 3.8 GW of variable renewable electricity capacity was delivered in 2025, and a record-breaking 14.7 GW of new capacity was procured through the Contracts for Difference Allocation Round Seven (AR7) renewable energy auction. However, some risks persist in delivering offshore wind capacity given the scale and long delivery times of offshore wind projects.
- Electrification in key sectors: to make full use of increasing renewable electricity generation capacity, more progress is needed in electrifying end uses of energy. Across key sectors:
- Surface transport: falling prices of electric cars continue to encourage uptake in line with the zero-emission vehicle (ZEV) mandate, with electric vehicles making up nearly one in four new cars. Sales of electric vans are currently off track but can recover if, alongside investment from the market, policy addresses key regulatory and charging barriers.
- Buildings: installation of heat pumps in new homes is on track to achieve targets, with 25% of new homes built with a heat pump in 2025. However, growth in retrofit installations has slowed significantly this year, driven by a reduction in installations under schemes targeting low-income households. This urgently needs to accelerate.
- Industry: there has been limited progress in industrial electrification. Achieving targets requires higher rates of industrial heat electrification, but electricity prices remain too high compared to gas.
- Agriculture, land use, and aviation: many indicators across the agriculture, land use, and aviation sectors are on track to achieve targets. Woodland and peatland creation, and uptake of sustainable aviation fuel are in line with the Government’s ambition, while livestock numbers and meat consumption have continued to fall. However, strengthened policy, including longer-term policy certainty, may be needed to build on this momentum.
- Monitoring and evaluation: the Government’s Carbon Budget Growth and Delivery Plan (CBGDP) includes limited indicator pathways, making tracking progress challenging. In future carbon budget delivery plans, the Government should enable better monitoring and evaluation by including annual deployment pathways for each indicator.
3.1 Principles of progress monitoring
Effective mechanisms to monitor progress are essential to identify and address barriers and risks to achieving the UK’s emissions targets. In this chapter, we do this by tracking progress on a range of key delivery indicators. Tracking these indicators allows us to identify at an early stage whether progress is on or off track for the pace of change required, providing a signal for areas at risk. Further details on our approach to progress monitoring can be found in our CCC Mitigation Monitoring Framework.
In Section 3.2, we assess progress on indicators covering: surface transport, buildings, industry and waste, agriculture and land use, electricity supply, and aviation. This subset of indicators allows us to focus our assessment on the actions and changes leading to the most significant emissions reductions, subject to data availability.
- To achieve the Fourth, Fifth, and Sixth Carbon Budgets, action is mainly needed in the delivery of electric technologies in transport, buildings, and industry, and the continued deployment of renewable electricity generation.
- To deliver emissions reductions to achieve the Seventh Carbon Budget (2038 to 2042) and the 2050 Net Zero target, action needs to start now in agriculture and land use, aviation, and engineered removals. For example, due to the lag in sequestration, tree planting must increase in the 2020s for its abatement impact to be felt from 2040 and beyond.
Where possible, we assess progress against the Government’s CBGDP (see Chapter 2). However, a lack of detailed monitoring and evaluation plans in the CBGDP means our assessment often relies on other government targets, and/or the Balanced Pathway from our advice on the UK’s Seventh Carbon Budget (2025), as a proxy for government ambition.
- The CBGDP includes a small selection of deployment pathways for key technologies. However, these only provide five-year snapshots, and are generally not comprehensive enough or cannot be broken down in a way which is useful to assess progress against.
- A good monitoring and evaluation framework helps identify risks of delivery falling behind the required pace of change, allowing action to be taken to mitigate the risks and get back on track. To enable this, the CBGDP should include annual deployment pathways for each key indicator. These pathways should be aligned with the pace of change required to deliver each sector’s contribution to the emissions pathway, so that outturn data can be judged against them.
- Where the CBGDP lacks detail on monitoring and progress, we track progress against other sector-specific targets, which do not always directly align with carbon budgets. These include the Clean Power 2030 Action Plan, the Warm Homes Plan, and woodland creation targets from the UK Government and devolved administrations. We do not track progress against historic targets which the current government has not endorsed, or forthcoming strategies.
- The pathway and plans set out in the CBGDP represent progress needed to achieve carbon budgets, but not the additional progress needed to achieve the 2030 Nationally Determined Contribution (NDC). Progress will need to exceed the ambition of the CBGDP to achieve this target (see Section 2.2 and Section 4.5).
In Section 3.3, we discuss trends in a range of cross-cutting impacts and enablers, including green jobs, air quality, and knowledge and awareness of climate change and the Net Zero target. While we do not have benchmarks against which to judge progress on these, they provide useful insight into the wider impacts of the Net Zero transition.
3.2 Assessment of progress on key indicators
3.2.1 Overall assessment of progress
We assess progress on 31 key indicators. Of the 24 that have a relevant benchmark or target to compare against, and for which it is not too early to make a judgement, we assess 15 as being on track (Table 3.1).
- Indicators are mostly on track within the electricity supply, agriculture and land use, and aviation sectors, as well as for the rollout and price of electric cars.
- Three indicators – offshore wind capacity, new woodland creation, and aviation fuel efficiency – are assessed as being almost on track.
- Three indicators – retrofit heat pump installations, industrial electricity use, and household recycling rates – are assessed as being off track.
- Three indicators – battery electric van sales and price, and the domestic ratio of gas to electricity prices – are assessed as being significantly off track.
| Table 3.1 Progress scores for indicators across sectors |
|||
|---|---|---|---|
| Sector | Description | Score | |
| Surface transport | Battery-electric car share of new sales (%) | On track | |
| Battery-electric car price premium (%) | On track | ||
| Battery-electric van share of new sales (%) | Significantly off track | ||
| Battery-electric van price premium (%) | Significantly off track | ||
| Public electric vehicle (EV) charge points for cars and vans | On track | ||
| Domestic uptake of EV time-of-use tariffs | No benchmark or target | ||
| Buildings | Annual domestic heat pump installations (new build) | On track | |
| Annual domestic heat pump installations (retrofit) | Off track | ||
| Cumulative domestic rooftop solar photovoltaic (PV) installations (retrofit and new build) | Too early to say | ||
| Annual domestic battery installations | No benchmark or target | ||
| Proportion of homes with insulated cavity walls (%) | On track | ||
| Proportion of domestic electricity connections which have a smart meter (%) | On track | ||
| Ratio of domestic electricity to gas prices | Significantly off track | ||
| Uptake of domestic time-of-use tariffs | No benchmark or target | ||
| Agriculture and land use | Number of livestock (cattle) | On track | |
| Number of livestock (sheep) | On track | ||
| Consumption of beef and lamb (tonnes) | On track | ||
| New woodland creation (kha/year) | Almost on track | ||
| Peatland restored (kha/year) | On track | ||
| Industry and waste | Electricity used in industry (% of total industry energy use) | Off track | |
| Ratio of industrial electricity to gas prices | No benchmark or target | ||
| Recycling rate of waste from households (%) | Off track | ||
| Aviation | Sustainable aviation fuel (SAF) share (%) | On track | |
| Distance travelled by plane (passenger-km) | On track | ||
| Fuel consumption (kWh per passenger-km) | Almost on track | ||
| Electricity supply | Offshore wind operational capacity (GW) | Almost on track | |
| Onshore wind operational capacity (GW) | On track | ||
| Solar operational capacity (GW) | On track | ||
| Battery storage output capacity (GW) | On track | ||
| Unabated fossil fuels as a share of generation (%) | Too early to say | ||
| Weighted average solar and wind strike price of live projects (£/MWh) | No benchmark or target | ||
Progress on low-carbon electricity and electrification
While there has been strong progress on the transition to a low-carbon electricity system, progress to electrify technologies across surface transport, buildings, and industry is more mixed (Figure 3.1).
- Low-carbon electricity deployment is generally making good progress, with onshore wind, solar, and battery storage capacity on track to achieve targets, and capacity for offshore wind almost on track.
- Progress in electrification in other sectors is mixed, with only around half of key indicators scored as on track to achieve targets. Indicators that are on track include uptake and price of electric cars, deployment of charging points, and installation of heat pumps in new homes. However, retrofit installations of heat pumps, the domestic ratio of electricity to gas prices, electricity use in industry, and uptake and price of electric vans are lagging behind, with scores of either off track or significantly off track.
The Government’s CBGDP identifies electrification as the dominant means of decarbonisation over the next few years. To achieve future carbon budgets and protect households and businesses from volatile fossil fuel prices, policy will be needed to enable faster uptake of electric technologies (see Chapter 4).
| Figure 3.1 Progress scores for key electricity supply and electrification indicators |
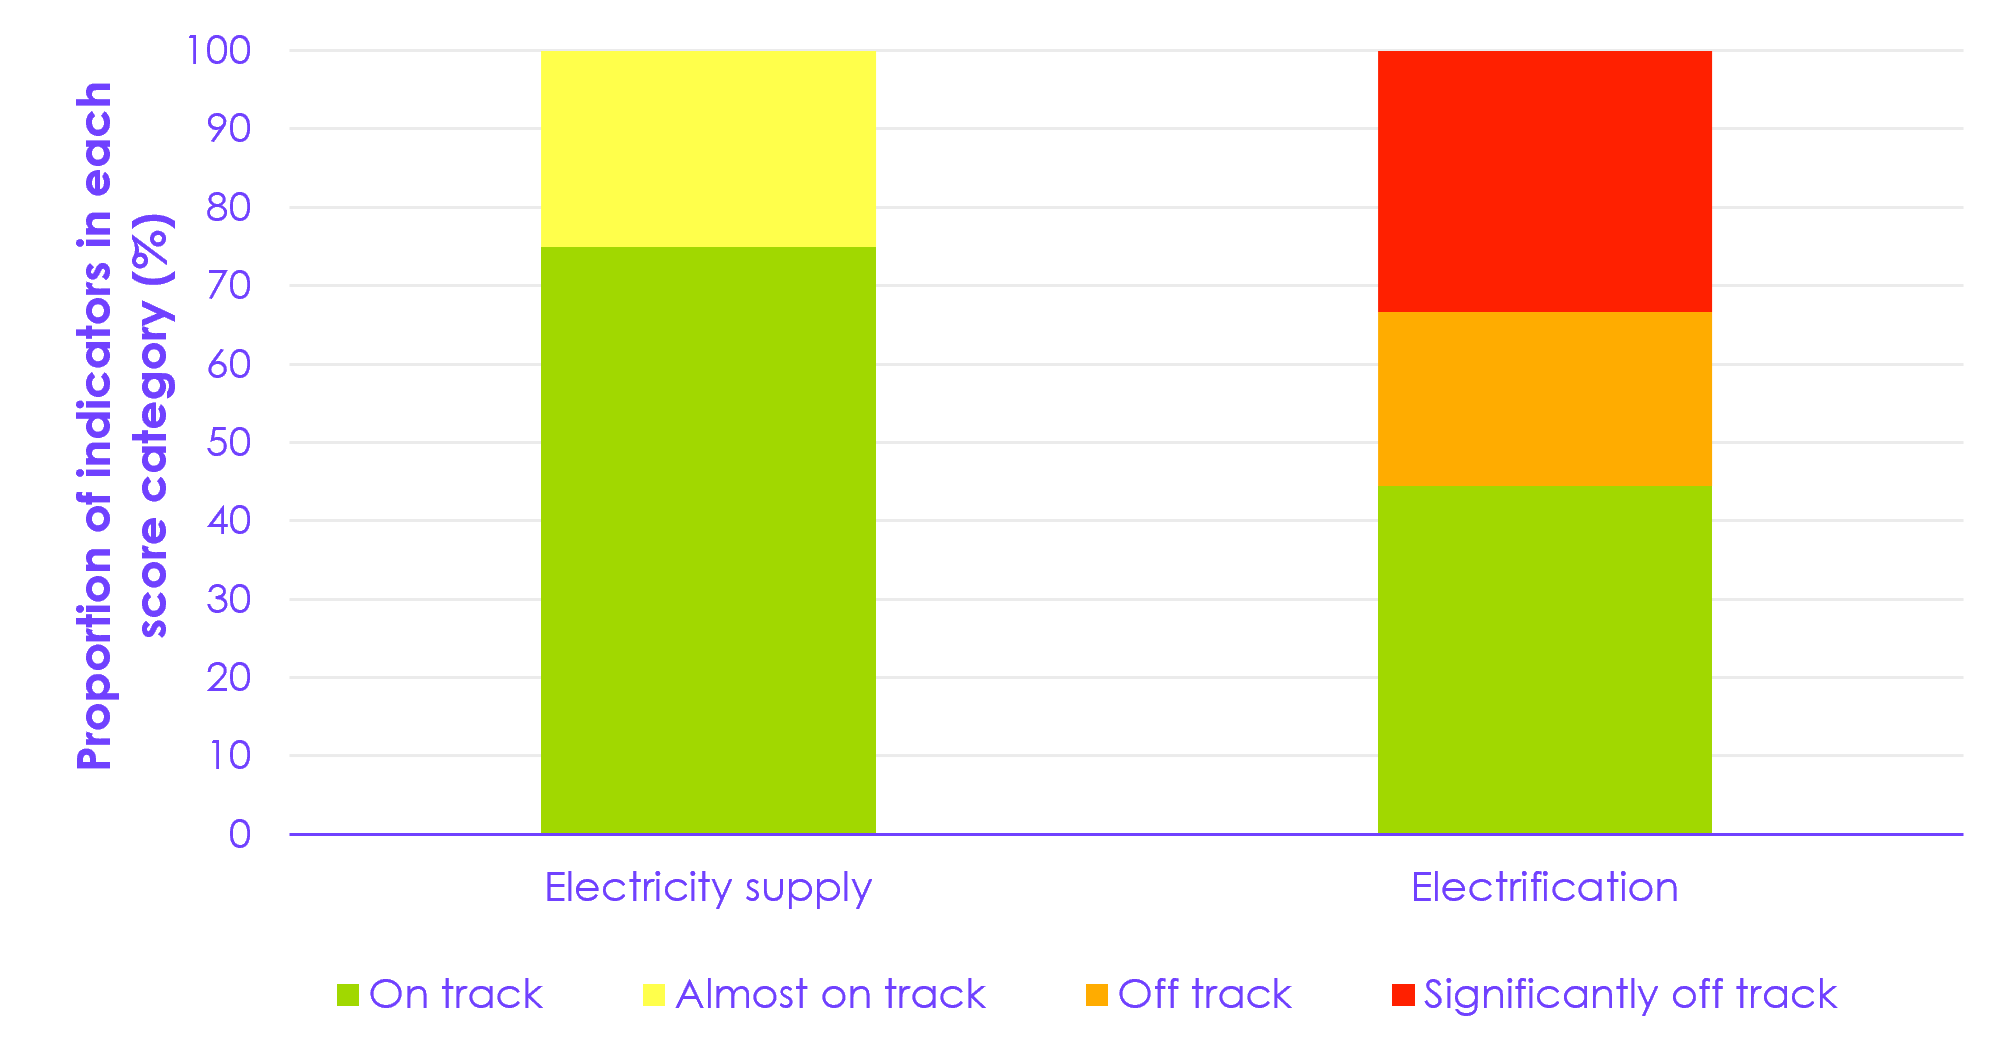 Description: Decarbonising electricity supply is broadly on track to achieve targets. However, electrification of technologies in key sectors, including buildings, surface transport, and industry, is lagging behind. Source: Climate Change Committee (CCC) analysis. Notes: Indicators which have no benchmark or target, or where it is too early to make a judgement, are excluded from this chart. Four key indicators are included for electricity supply: capacity for renewables (offshore wind, onshore wind, and solar) and battery storage. Nine key indicators are included for electrification: new sales and price premiums of electric vehicle (EV) cars and vans, provision of EV charge points, installation of new build and retrofit heat pumps, the domestic ratio of electricity to gas prices, and electricity use in industry. |
3.2.2 Surface transport
Adoption of electric cars continues to grow at pace, as increasing numbers of households seize the opportunity to lower their motoring costs. Propelled by the ZEV mandate, the market has driven fast growth in the availability of cheaper models and investment in charging infrastructure. The price of new electric cars continues to fall towards price parity on a like-for-like basis. Electric van uptake is off track but can catch up as better, cheaper models come to market and operational barriers are addressed.
- Electric cars: EVs made up nearly one in four (23.4%) new car sales in 2025, which has increased from 19.6% in 2024 (Figure 3.2a). This is in line with the Government’s CBGDP assumptions, which are based on expected ZEV mandate compliance. All manufacturers complied with the ZEV mandate in 2024 when accounting for in-built flexibilities, and we expect this to also be the case for 2025.
- The number of EVs on UK roads increased by approximately 41% in the year to April 2026, reaching over two million. As we approach a key tipping point in the transition, whereby EVs become cheaper to buy than petrol equivalents (see below), we expect demand to exceed the headline targets of the ZEV mandate. The CBGDP assumes lower EV uptake that does not exceed the mandate.
- Experience in other leading EV markets (particularly Denmark) indicates that the pace of adoption assumed by our Balanced Pathway can be achieved as the market, supported by policy, confirms EVs as the clear choice for consumers (Figure 3.3). While some countries that went earlier in the transition chose to use generous subsidies to encourage EV adoption, the UK’s transition is delivered by increasingly competitive markets. This is enabled by the ZEV mandate‘s supply side incentives and a supportive broader policy environment (see Section 4.3.2).
- The average purchase price premium of a new EV relative to a petrol equivalent has continued to fall from 24% in 2024 to 16% in 2025 (Figure 3.2b). This is on track to deliver price parity on a like-for-like basis across all segments in the next two years, in line with our Balanced Pathway.[92] Price parity has been met in some, typically more expensive, car segments.[93];[94] In the used market, EV sales grew by 45.7% year-on-year, with used EVs three years or older often the same price or cheaper than a petrol equivalent.[95];[96]
- Increasing availability of affordable EVs is enabling more households to save hundreds of pounds a year on refuelling costs (see Box 3.1 and Section 5.2.3). This is particularly the case for households making use of EV time-of-use tariffs, uptake of which has steadily grown in the last few years (Figure 3.2c). Recent oil price increases and growing uncertainty over future energy prices are reported to have sparked a marked increase in enquiries and sales for EVs and charge points.[97];[98]
- Despite offering significantly lower fuel and emissions savings than EVs, plug-in hybrids (PHEVs) are gaining momentum in the market (see Box 3.1).
- Electric vans: sales of EVs made up 9.5% of the new market in 2025 which has increased from 6.3% in 2024 (Figure 3.2d). This represents a 36% increase in the number of new EVs sold.[99];[100] While this is behind the Government’s CBGDP assumptions, EVs were the biggest source of growth in an otherwise contracting van market.[101] As better, cheaper models come to market and barriers are addressed, the transition can catch up.[102]
- The price premium for an electric van compared to a typical diesel model was 33% in 2025 and has not fallen as quickly as for cars (Figure 3.2e). It appears unlikely that price parity will be reached in 2026 as assumed in our Balanced Pathway. However, the total cost of ownership (TCO) for EVs is likely a more important consideration for commercial van owners, who make up the majority of the van market.[103] We lack suitable data to track TCO parity, but a survey of over 300 fleet managers across the UK and US found that 43% of fleet operators now anticipate reduced TCO from their transition to EVs.[104]
- Innovation in fast charging and new models coming to market will also help address some key barriers to widespread EV adoption, including downtime, range, and payload capabilities.[105] Government support, including to improve access to fast charging and resolve regulatory hurdles, is also key (see Section 4.3.2).
- Public EV charge points: there has been continued growth in the number of public EV charging devices across the UK, increasing by 19% from 74,000 in 2024 to 88,000 in 2025 (Figure 3.2f). The biggest increase has been in ultra-rapid devices and charge points located along the strategic road network.[106]
- While roll-out is on track to reach 300,000 public charge points by 2030, growth has slowed compared to the 37% year-on-year growth seen in 2024, particularly in the deployment of more affordable on-street chargers.[107];[108] The distribution of charging devices is uneven but strong delivery has brought per-capita numbers in Wales in line with the UK average.[109] London and Scotland continue to have a high number of charging devices compared to the rest of the UK, while Northern Ireland remains significantly behind.
- The cost of faster public charge points is still significantly more expensive than home charging, and this remains a key barrier to more widespread EV adoption. Increased availability of discounted tariffs alongside measures to enable on-street and cross-pavement charging will help improve affordability.[110] The recent increases in fuel prices following the start of the Iran war have reinforced the increasing cost effectiveness of EVs (see Section 5.2.3).[111]
- Deployment of ultra-rapid chargers and increasing battery range are helping to bridge the ‘range’ gap with petrol cars. Ultra-rapid chargers, which enable 20–30 minute en route top ups, grew by 40% year-on-year in 2025.[112] Following significant manufacturer investment, the choice of electric cars has increased from 130 to over 160 models in 2025, with an average range of approximately 300 miles and some models capable of 500 miles.[113];[114];[115];[116]
| Figure 3.2 Progress scores for indicators in surface transport |
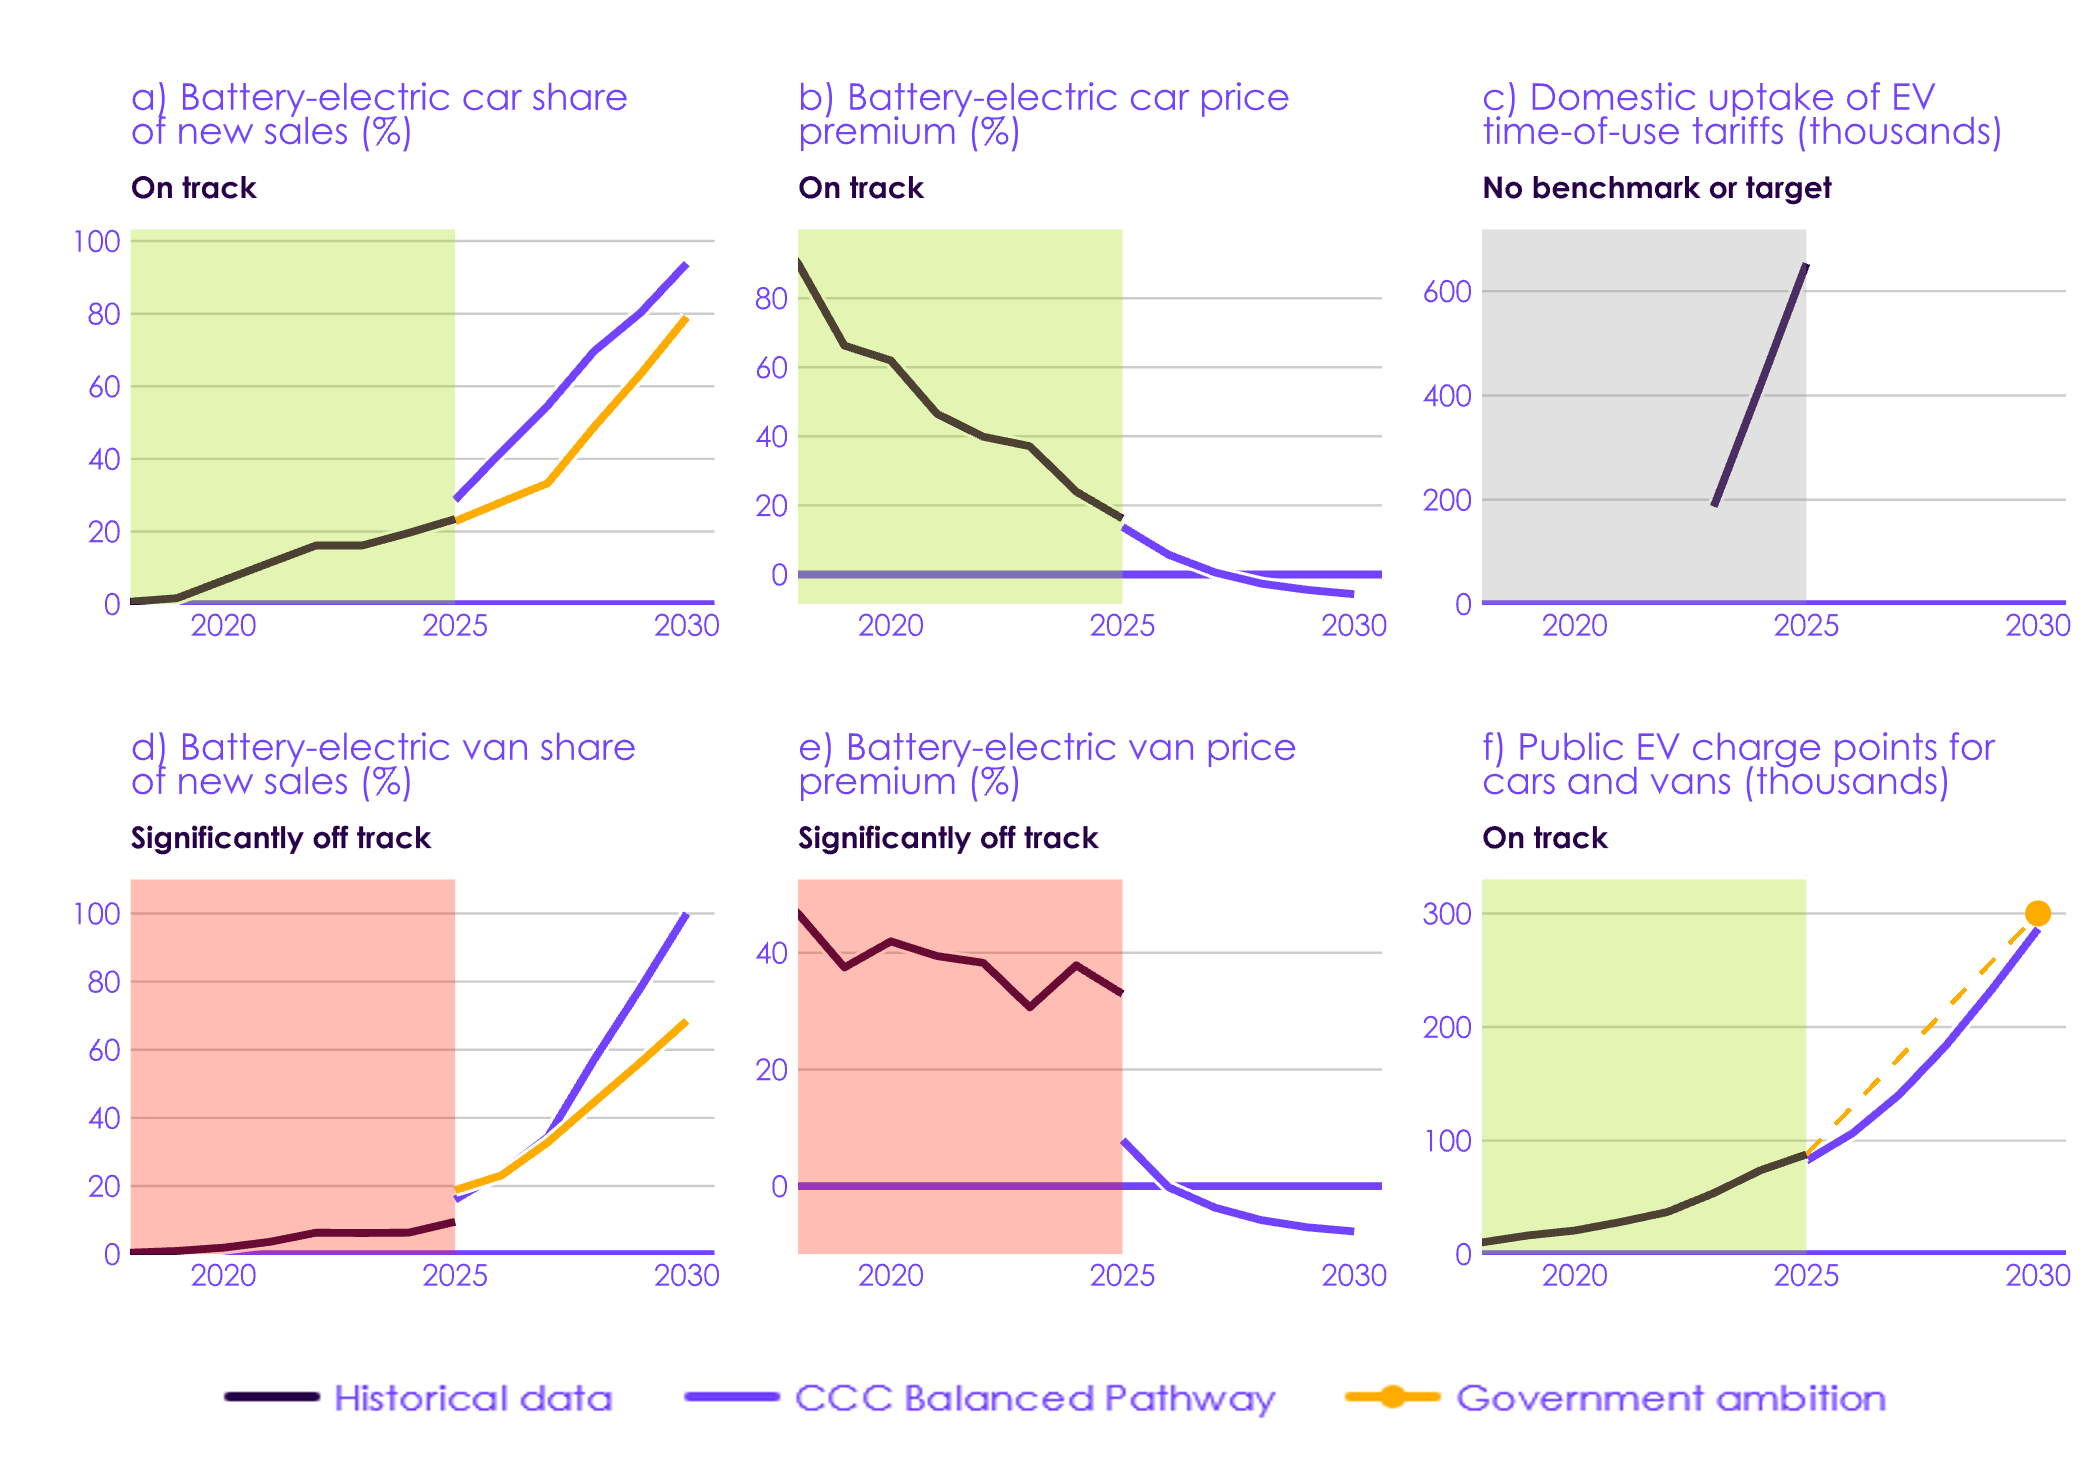 Description: Electric car indicators are on track, both in terms of increasing uptake in the new market and the falling price premium of new electric models compared to internal combustion engine (ICE) equivalents. Electric van indicators are significantly off track. Public electric vehicle charge point deployment is on track. Source: The Society of Motor Manufacturers and Traders (SMMT) (2026) UK new car market breaches two million as almost one in four buyers go electric; SMMT (2026)Van market shrinks in 2025 despite EV growth; Autotrader (2026) data shared in correspondence with the CCC; ZapMap (2026) EV charging statistics; Ofgem (2026) State of the Market Report; CCC analysis. Notes: (1) Dashed lines represent the linear path from the latest historical value to the Government’s ambition. (2) Government ambition in chart (a) and chart (d) is in line with uptake assumptions in the Government’s Carbon Budget Growth and Delivery Plan. (3) Price premium in charts (b) and (e) shows like-for-like comparisons of electric and internal combustion engine models available in the UK market. (4) In chart (c) time-of-use tariffs include only basic domestic smart tariffs, and exclude any add-ons (for example, time-of-use add-ons to standard tariffs). Heat pump specific time-of-use tariffs, which might still be used to charge an EV, are not included. (5) The Department for Transport has changed its reporting methodology for counting the number of public electric vehicle charge points. It now counts the number of individual chargers which can each charge an individual vehicle, whereas previously it counted the number of charging devices. A single device can have multiple chargers. Chart (f) counts charging devices in line with the previous counting methodology. We are using the old methodology as government ambition is measured on these terms. |
| Figure 3.3 Comparison of electric car uptake trajectories |
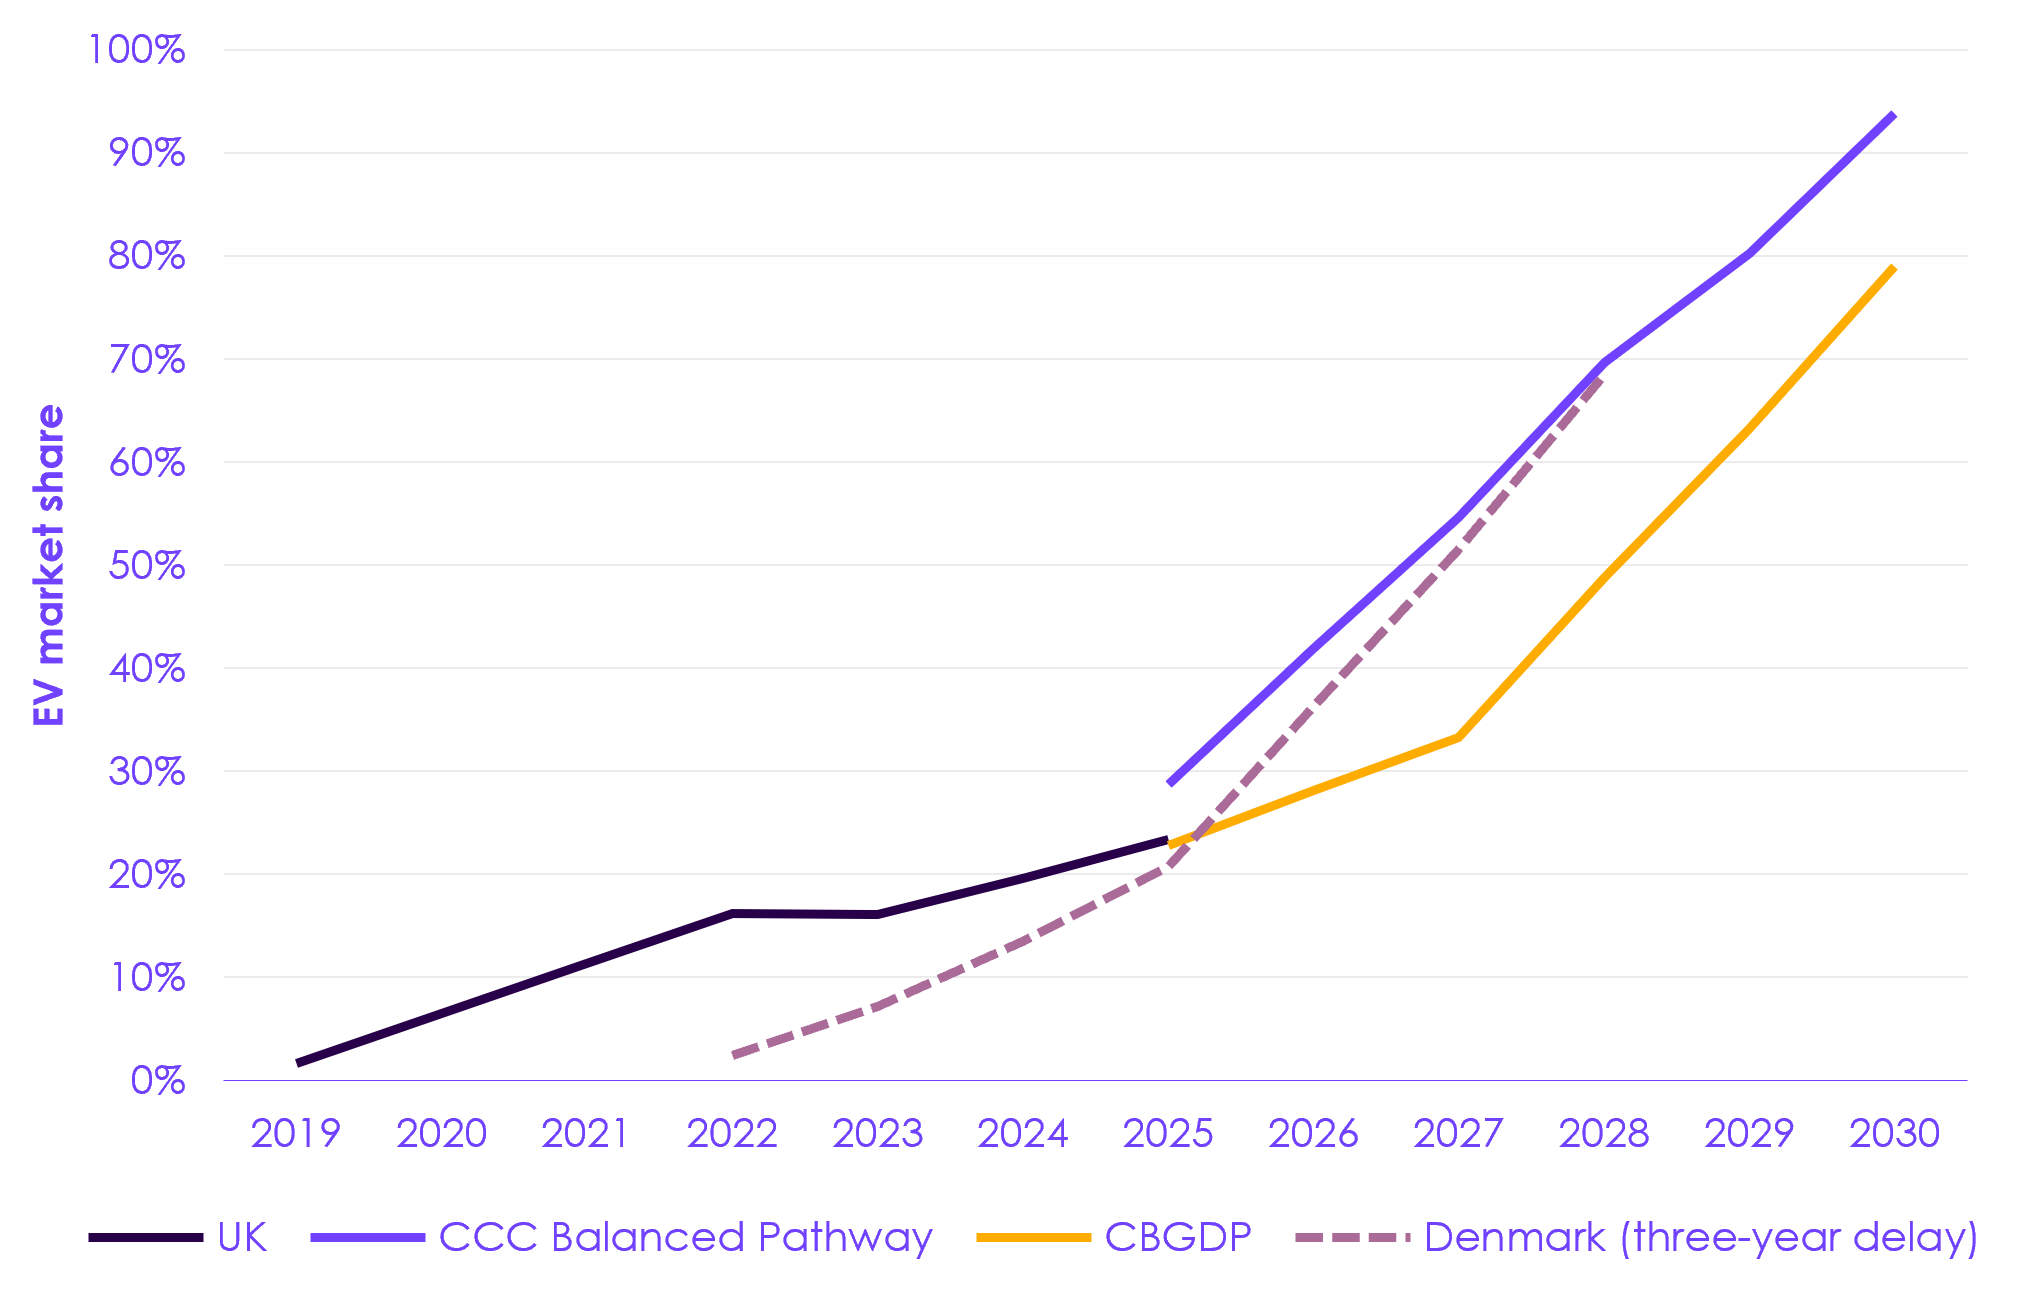 Description: Experience in Denmark shows that it is possible for the electric vehicle (EV) market to achieve the growth in uptake rates assumed by our Balanced Pathway, which increases to around 70% by 2028. Unlike Denmark, which relied on generous subsidies to encourage adoption, the UK transition is delivered by an increasingly competitive market, supported by the zero-emission vehicle mandate. Source: The Society of Motor Manufacturers and Traders (SMMT) (2026) Two millionth electric car registered as market rebounds strongly from tax changes; Transport and Environment (2026) European car market dashboard; CCC analysis. |
Box 3.1
Plug-in hybrids are increasingly popular but offer neither the fuel savings nor the emissions savings of EVs
Plug-in hybrid vehicles (PHEVs) are gaining momentum in both the new car and van markets, which could slow the pace of the switch to electric vehicles (EVs).
- 35% more PHEVs were sold in 2025 than 2024, reaching 11% of new car sales. Electric car sales grew by 24% in the same period. This continued into 2026, with the number of PHEVs sold increasing by 47% in the year to April (versus the same period in the previous year), reaching a market share of 13%.[117] The van market is also seeing rapid growth in PHEVs, although from a lower base. In 2025, PHEVs made up around 3% of the new van market but this has risen to 5% in the year to April 2026.[118];[119]
- The Government’s assessment of the 2025 changes to the ZEV mandate assumed use of non-ZEV CO2 flexibilities (which provide credits for PHEV sales) consistent with 2024 compliance, when PHEV sales made up less than 9% of the new car market and less than 1% of the new van market.[120] These assumptions also underpin the CBGDP. Our Balanced Pathway assumes PHEVs peak at 10% of the new car market in 2025, while we assumed no meaningful role for PHEV vans. With EV sales currently below the level assumed in our pathway, the higher market share for PHEVs is effectively replacing sales we assumed to be EVs.
- In recent years, self-reported purchase intentions among the UK public have consistently been higher for hybrids than for EVs.[121] In several leading European electric vehicle markets, PHEVs have gained market shares in the region of 20%, including Sweden, Finland, and the Netherlands.[122];[123];[124]
If PHEVs take market share from EVs, this will reduce consumer fuel savings and pose a risk to UK emissions targets. These impacts are higher than implied by previous test standards and some recent policy decisions.
- Data from onboard fuel recorders for thousands of new PHEVs sold in Europe in 2021 indicate that real-world fuel consumption is nearly three and a half times higher than previously assessed by international vehicle performance testing.[125] This is due to the test standard previously underestimating the share of driving on ‘charge depleting mode’ as well as times where the engine provides automatic additional power to the battery even when in this mode (for example, to accelerate).
- The international testing standard is being updated to better reflect real-world performance of PHEVs. An initial update applies to new vehicles sold in the UK from 2026, with a further update planned for 2027.[126] However, the Government decided to allow manufacturers to opt out of retrospectively applying the updated emissions ratings in the ZEV mandate.[127] The Government also decided to delay application of the updated emissions ratings to benefit-in-kind tax calculations until 2028, meaning PHEVs benefit from a lower taxation rate than their real-world emissions would imply.
- Continued growth of the PHEV market share significantly above the levels assumed by the CBGDP and at the expense of EVs would result in higher emissions and reduce the savings households can make from switching to an EV.
- Based on recorded real-world performance in the EU in 2021, PHEVs only save a quarter of the fuel used by petrol cars.[128] When applied to our analysis, the annual driving cost (fuel and electricity costs including taxes, based on prices before the start of the Iran war) for a new PHEV is only around £70 less than a comparable new petrol car, but around £370 more than a comparable new EV.[129];[130]
- Better battery capacity and increasing familiarity could in theory see real-world performance of PHEVs improve over time. However, more recent studies find no improvement in real-world performance between 2021 and 2023, and larger battery capacity correlated with a wider gap between real-world and test performance.[131]
- To avoid PHEVs replacing potential EV sales, the Government should rule out further concessions to the ZEV mandate, ensure company car and vehicle taxes reflect the real emissions impact of PHEVs, and support consumers to understand the full benefits and readiness of EVs relative to PHEVs.
3.2.3 Buildings
There has been positive progress in residential new builds, with heat pump installation rates increasing. However, progress in residential retrofit heat pump installations has slowed. There has been steady progress in deployment of other low-carbon technologies, including domestic solar photovoltaics (PV) and batteries.
- New build heat pumps: there has been good progress on installing low-carbon heating in new properties, with 25% of all new homes being built with a heat pump in 2025 (Figure 3.4a). England and Wales are implementing revised building regulations that require low-carbon heating in new buildings, while Scotland has already put these rules into force. The regulations in England and Wales come into force from March 2027 with a transition period, meaning all new homes should be built with low-carbon heating by the end of the decade.
- Retrofit heat pumps: annual growth in retrofit heat pump installations fell to 7% in 2025 (Figure 3.4b). While installations under the Boiler Upgrade Scheme (BUS) continue to grow, there has been a decline in heat pumps installed in low-income and fuel poor homes through government schemes (Figure 3.5). The UK remains significantly behind most other European countries in heat pump installations, with a high electricity-to-gas price ratio playing a key role (Figure 3.6).
- The number of heat pumps installed in 2025 under the BUS grew by 38% compared to 2024, reaching 31,200.
- The number of heat pumps installed using UK funding for low-income homes fell by 21%, from 21,400 in 2024 to 16,900 in 2025.[132] 80% of these were installed through the Energy Company Obligation (ECO) scheme, a policy which has now been cancelled. Over the last three years, installations under ECO accounted for around a third of the overall retrofit market. Without a replacement policy in place, heat pump installations could fall significantly in 2026.
- Our indicators show heat pump deployment assumptions from the Warm Homes Plan. However, these rates are not sufficient to deliver the emissions reductions in the CBGDP, which requires more heat pump deployment than set out in the Warm Homes Plan.[133]
- In recent years, around one-third of UK homeowners indicated that they might consider installing a heat pump, a high rate considering the small proportion of homes (less than 2%) already using heat pumps.[134];[135] Recent oil price increases and growing uncertainty over future energy prices have sparked an increase in enquiries and sales for rooftop solar and heat pumps.[136];[137];[138]
- Rooftop solar PV and batteries: the initial data for these technologies look positive, and the Warm Homes Plan has the potential to push deployment further (Figure 3.4c and 3.4d). Research suggests that uptake of rooftop solar and batteries may contribute to higher heat pump uptake. However, this remains uncertain.[139];[140];[141] For many households, at prices following the start of the Iran war, use of solar panels with a time-of-use electricity tariff can make switching to a heat pump cost saving over its lifetime (see Section 5.2.4).
- Insulation: the proportion of homes with cavity wall insulation has steadily increased over time and continues to be on track (Figure 3.4e). There is limited government support for insulation installations following the closure of the ECO. As a result, installations could fall significantly in 2026 unless adequate replacement policy is put in place. There are many efficiency measures, such as draught-proofing and hot water tank insulation, that can be easily installed for a low cost. However, data on deployment of these measures is limited.
- Flexible energy demand: consumer research indicates most households are open to time-of-use tariffs (which can reduce the running costs of heat pumps and reduce household bills), provided they bring savings (see Section 5.2.4).[142];[143] There has been a steady long term increase in the proportion of homes with a smart meter (Figure 3.4f). There has also been growth in the last few years in the number of domestic customers on a non-EV time-of-use tariff, although the limited data available indicates many households with heat pumps are not yet accessing a time-of-use tariff (Figure 3.4g).[144];[145]
- Domestic electricity-to-gas price ratio: the removal of some policy costs from electricity is welcome. However, a typical household on a standard fixed tariff would still face additional lifetime costs if they switched to a heat pump today, and policy costs on electricity remain higher than those on gas. The UK has among the highest electricity-to-gas price ratio and the lowest heat pump market share in Europe (Figure 3.6). This is scored as significantly off track (Figure 3.4h).
- The Government reduced electricity unit prices in 2025 (see Section 4.3.7). This, alongside rising network costs for gas, contributed to the reduction of the electricity-to-gas price ratio from 4.7:1 in Q1 (1 January to 31 March) 2026 to 4.3:1 in Q2 (1 April to 31 June) 2026. For households on a time-of-use tariff, the effective price of electricity is lower (Figure 3.7).
- However, the ratio still rose between Q2 2025 and Q2 2026, up from 3.9:1 in Q2 2025, largely due to falls in the wholesale cost of gas between Q2 2025 and Q2 2026.[146] At current Ofgem rates, the ratio remains too high for homes on standard fixed tariffs to save money by switching to a heat pump. Policy costs, such as the remaining Renewables Obligation and Feed-in Tariffs, and levies that remain on electricity bills, should be removed (see Section 4.1.1, Section 4.3.7 and Section 5.2.5).
- The current increase in fossil fuel prices since the start of the Iran war has increased gas, and to a lesser extent electricity, prices in the price cap for Q3 (1 June to 31 August) 2026, lowering the ratio to 3.6:1. This is still insufficiently low for a household on a fixed tariff to have sufficient incentive to switch to a heat pump (see Section 5.2.5).
| Figure 3.4 Progress scores for indicators in buildings |
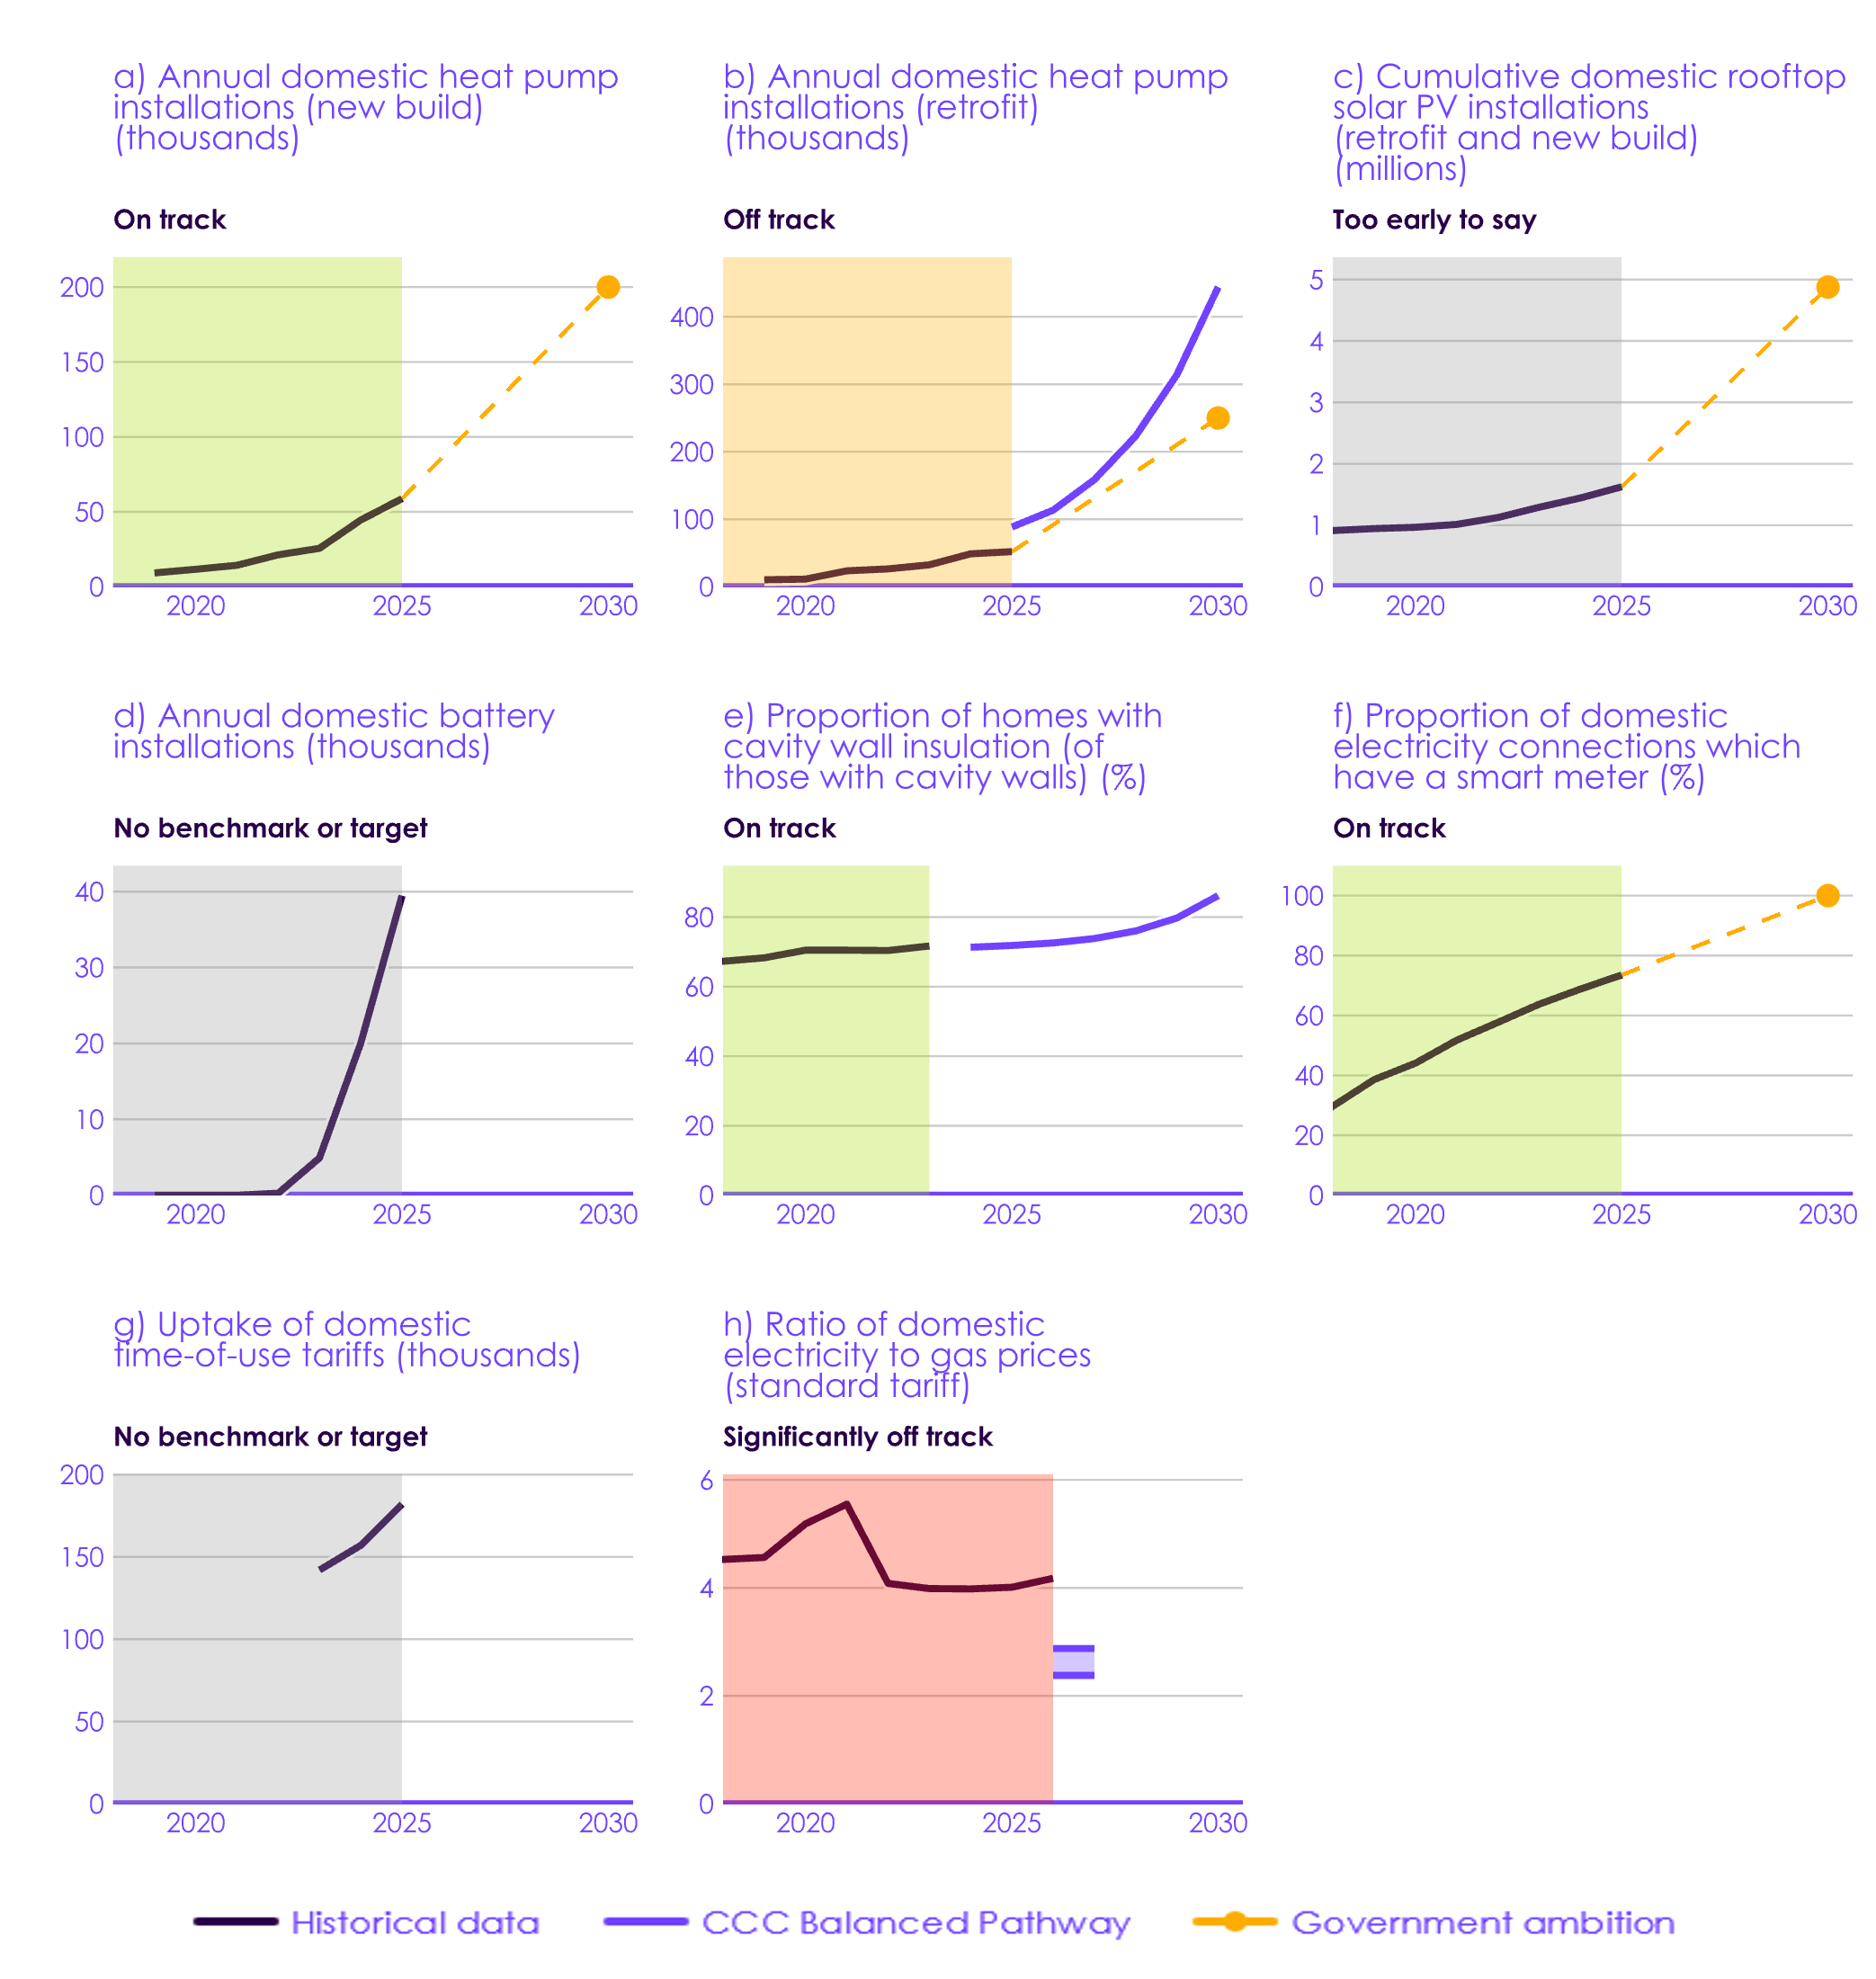 Description: New build heat pump installations, rates of cavity wall insulation, and smart meter installations are all on track. Growth in retrofit heat pump installations fell this year. The electricity-to-gas price ratio is significantly higher than the Balanced Pathway range. Description: New build heat pump installations, rates of cavity wall insulation, and smart meter installations are all on track. Growth in retrofit heat pump installations fell this year. The electricity-to-gas price ratio is significantly higher than the Balanced Pathway range. Source: Ministry of Housing, Communities and Local Government (MHCLG) (2026) Energy Performance of Buildings Data – England and Wales; Scottish Government (2026) Domestic Energy Performance Certificates – Dataset to Q1 2026; DESNZ (2026) Household Energy Efficiency Statistics, detailed report 2025; DESNZ (2026) Boiler Upgrade Scheme statistics: February 2026; DESNZ (2025) Heat pump deployment statistics: September 2025; Scottish Government Energy and Climate Change Directorate (2025) Heat in Buildings: progress report 2025; DESNZ (2026) Solar photovoltaics deployment; Microgeneration Certification Scheme (MCS) (2026) The MCS Data Dashboard; MHCLG (2025) English Housing Survey data on energy performance, heating and insulation; Ofgem (2026) Energy price cap (default tariff) levels; DESNZ (2025) Smart Meter Statistics; Ofgem (2026) State of the Market Report; CCC analysis. Notes: (1) Dashed lines represent the linear path from the latest historical value to the Government’s ambition. (2) Charts (a) and (b) show heat pump deployment assumptions from the Warm Homes Plan. (3) 2030 government ambition in chart (c) is three times the 2025 historic level of homes with solar PV, as expressed in the Warm Homes Plan. (4) Data in chart (g) shows basic domestic smart tariffs, including heat pump specific tariffs and time-of-use tariffs for households without heat pumps. This excludes any add-ons (for example, time-of-use add-ons to standard tariffs), Economy 7 and Economy 10, and electric vehicle specific tariffs (Figure 3.2). (5) Historic data in chart (h) shows annual averages. The Balanced Pathway price ratio range in 2027 is 2.4–2.9. The upper range estimates the ratio needed for a typical household on a standard tariff and receiving a £7,500 grant to face no additional lifetime costs by switching to a heat pump (accounting for heat pump installation costs). The lower range estimates the ratio needed for the same household to make a £2,000 saving from switching to a heat pump. The range is shown only for 2027, as the required range will change depending on other policy support available, which it is hard to predict. |
| Figure 3.5 Heat pump installations: new builds and retrofits by funding scheme |
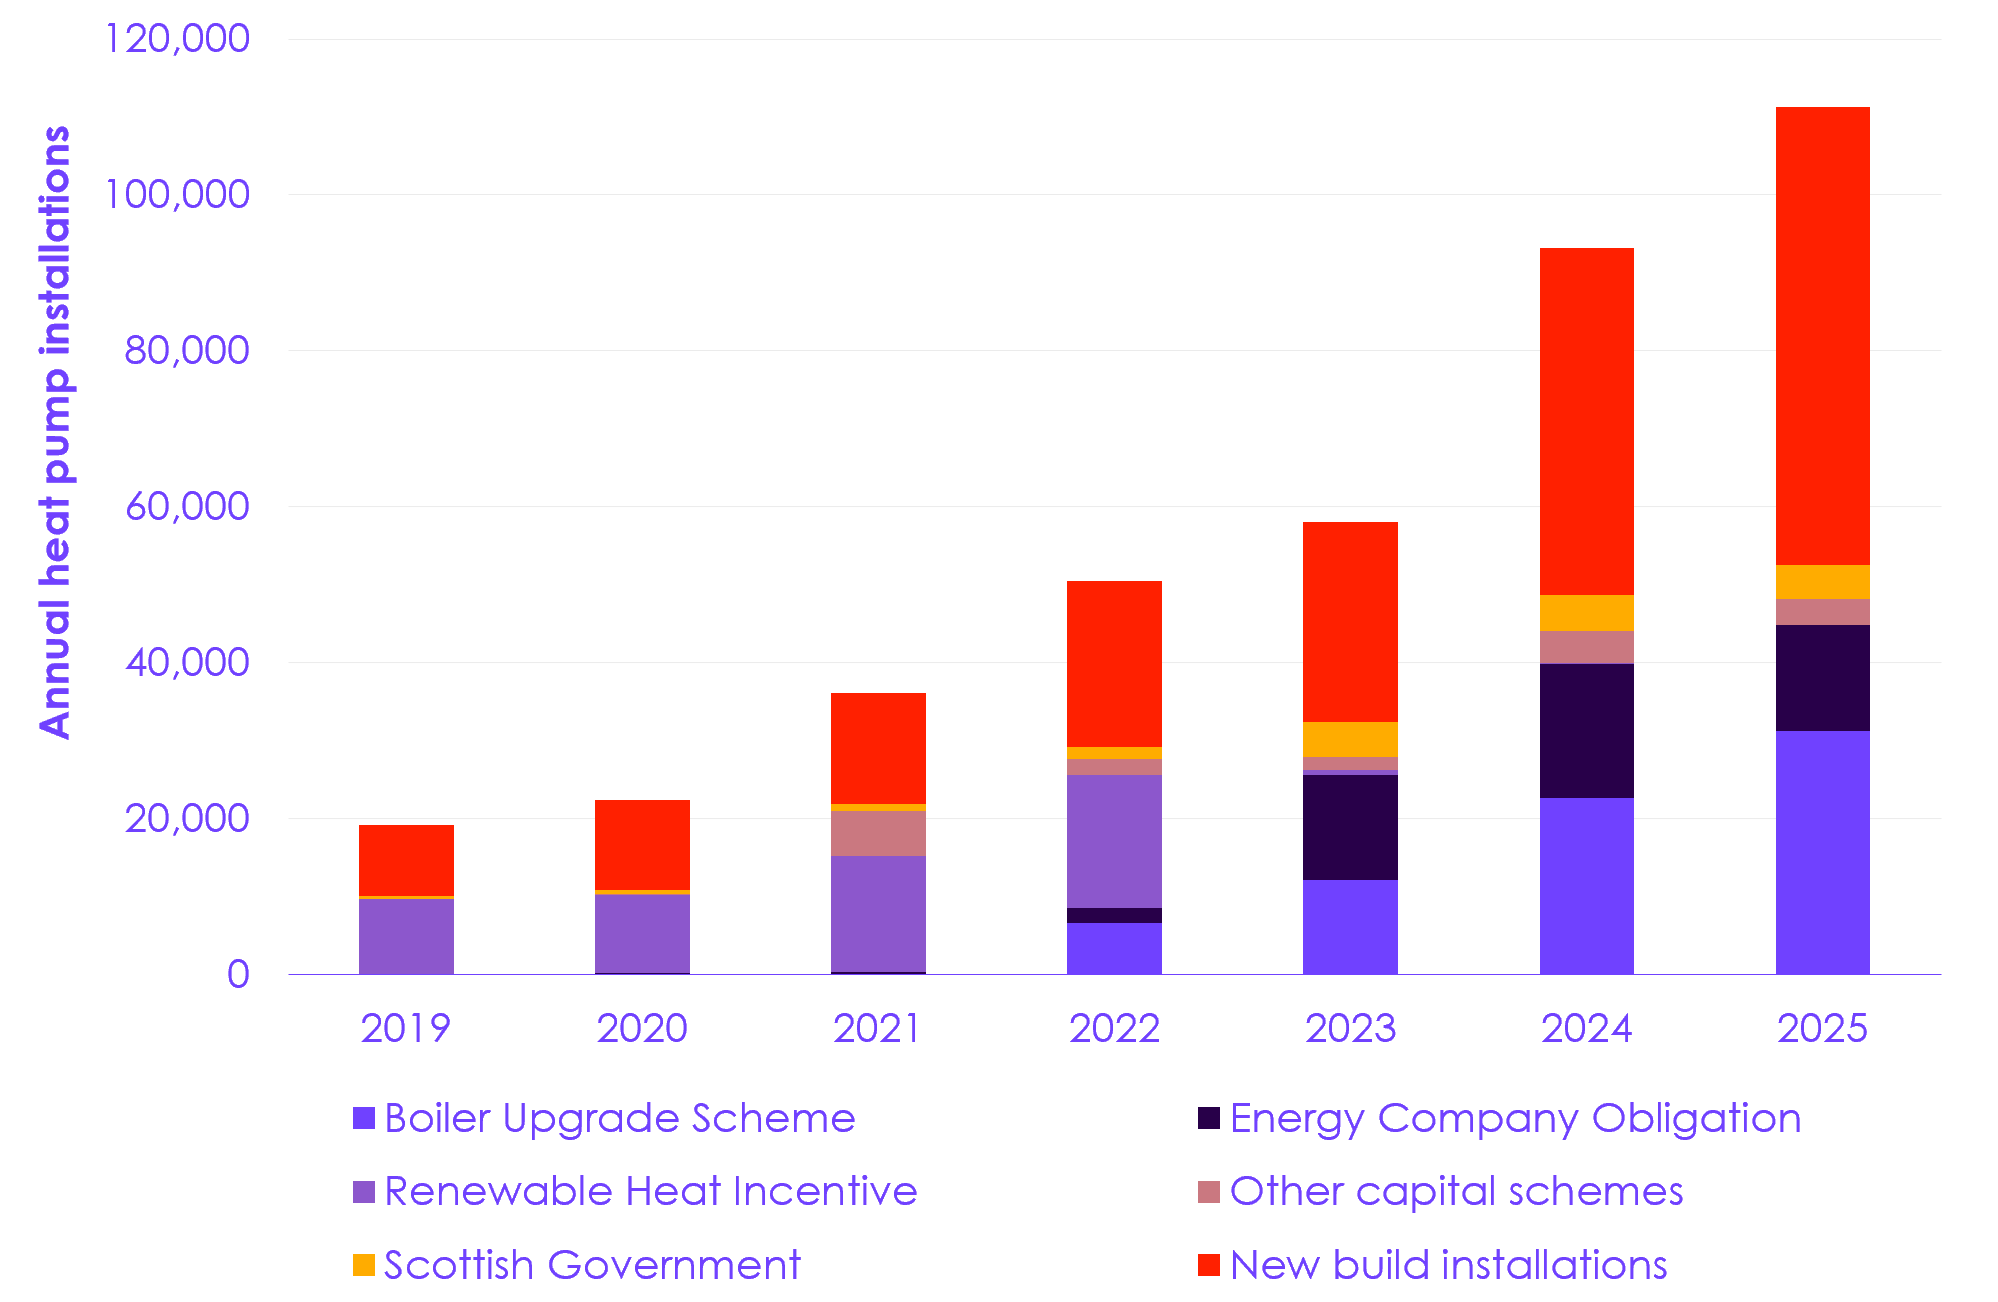 Description: Annual heat pump installation rates have increased over time in both the new build and retrofit markets, but the overall rate of growth has declined this year, driven by a reduction in installations under the Energy Company Obligation Scheme. The Boiler Upgrade Scheme continues to be the main driver of retrofit installations, and growth in new build installations has increased as the implementation of the Future Homes Standard gets closer. Source: Department for Energy Security and Net Zero (DESNZ) (2026) Household Energy Efficiency Statistics, detailed report 2025; DESNZ (2026) Boiler Upgrade Scheme statistics: February 2026; DESNZ (2025) Heat pump deployment statistics: September 2025; Scottish Government Energy and Climate Change Directorate (2025) Heat in Buildings: progress report 2025. Notes: New data from the Ministry of Housing, Communities and Local Government has allowed us to identify low-carbon communal heating in new builds, which has increased the number of new builds with low-carbon heat compared to our 2025 UK Progress Report. We have excluded hot water only heat pumps from our analysis this year, which reduces the number of retrofit heat pumps installed compared to our 2025 UK Progress Report. |
| Figure 3.6 Heat pump market share versus electricity-to-gas price ratio for countries in Europe in 2024 |
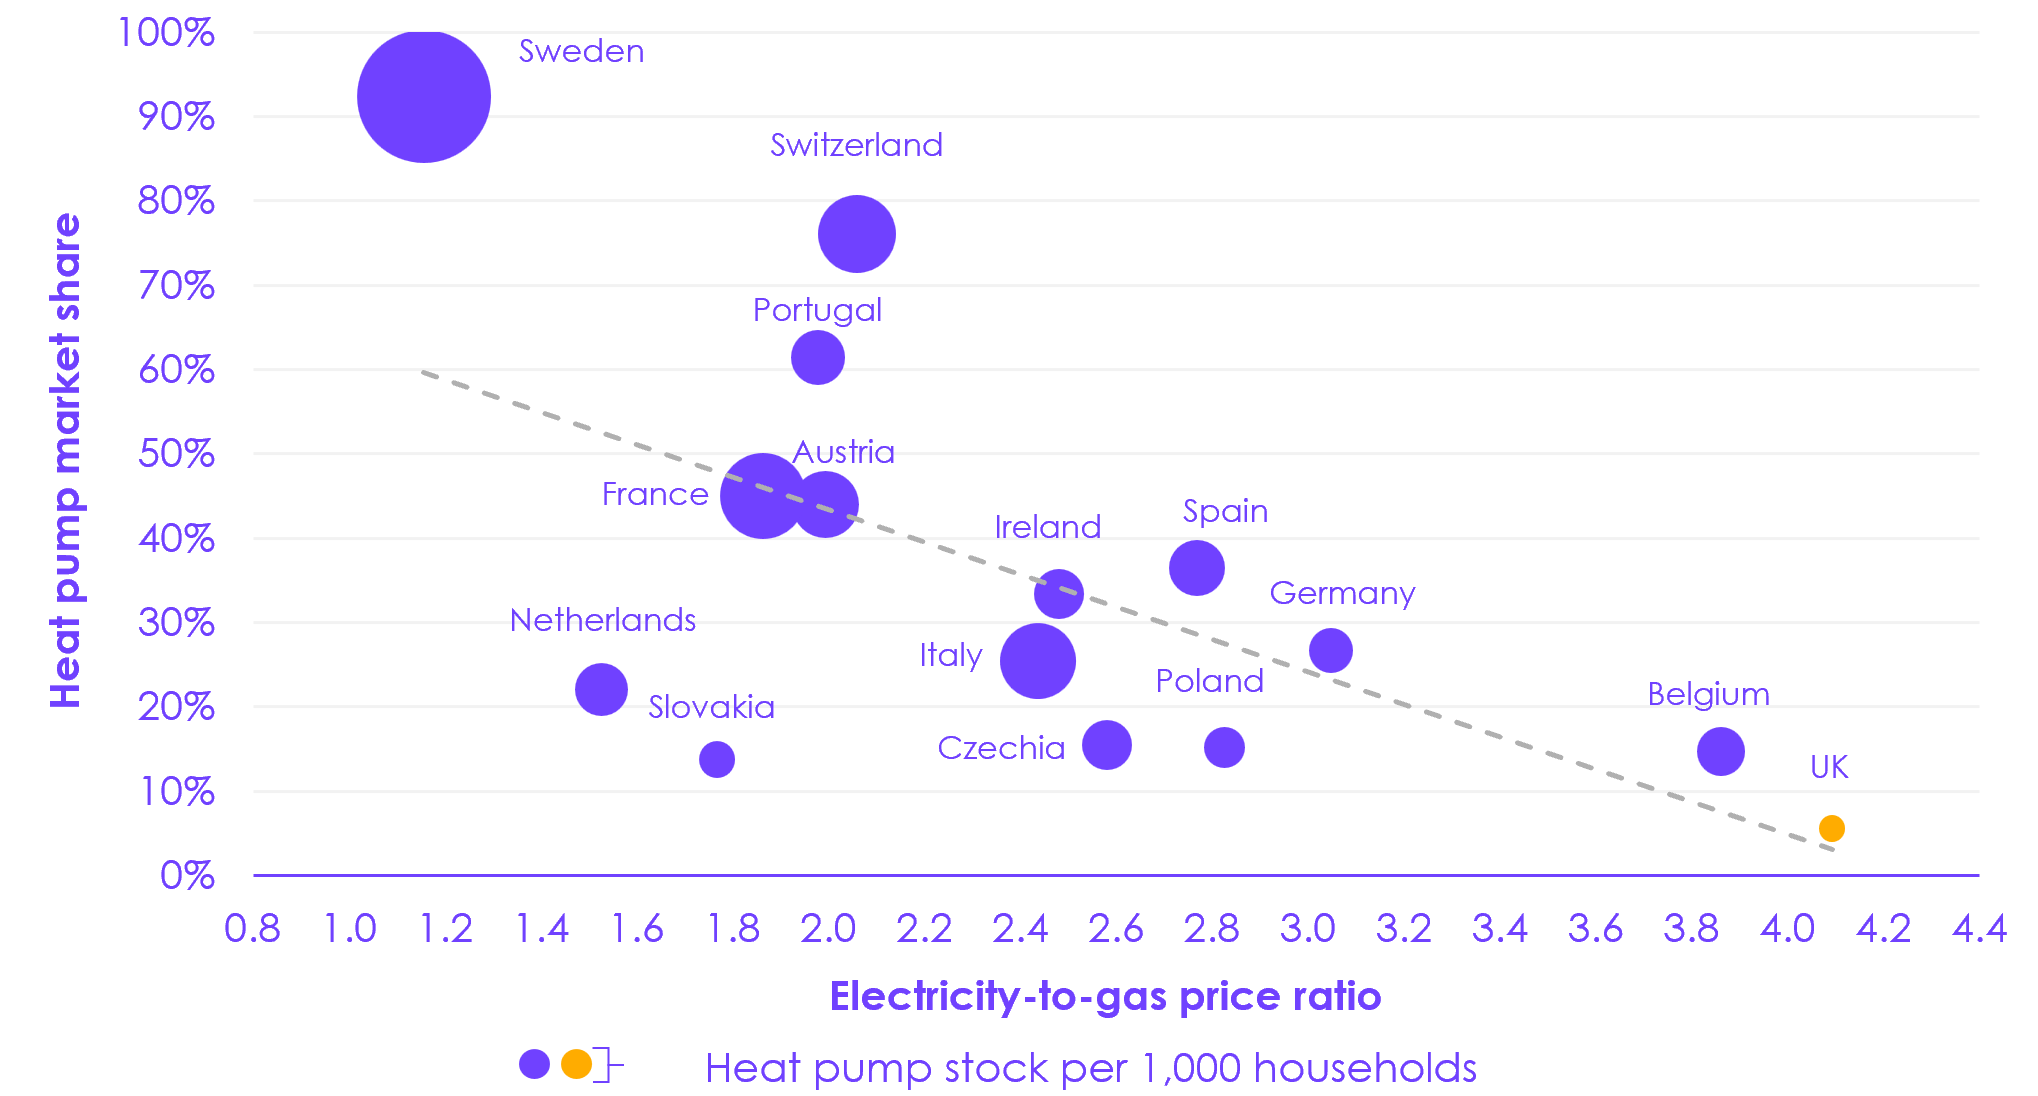 Description: The UK has among the highest electricity-to-gas price ratio and the lowest heat pump market share in Europe. Source: DESNZ (2025) Energy Prices International Comparisons: Domestic electricity and gas prices in the IEA 2024; EHPA (2025) European heat pump market and statistics report 2025; CCC analysis. Notes: (1) Size of markers indicates the number of heat pumps installed per 1,000 households in each country, in total. This includes both historic installations, and new installations in 2024. In the UK, this is 19 heat pumps per 1,000 households; in Sweden, this is 496 heat pumps per 1,000 households. (2) The dashed line shows the linear regression best-fit line through the data shown. |
| Figure 3.7 Ratio of domestic electricity to gas prices |
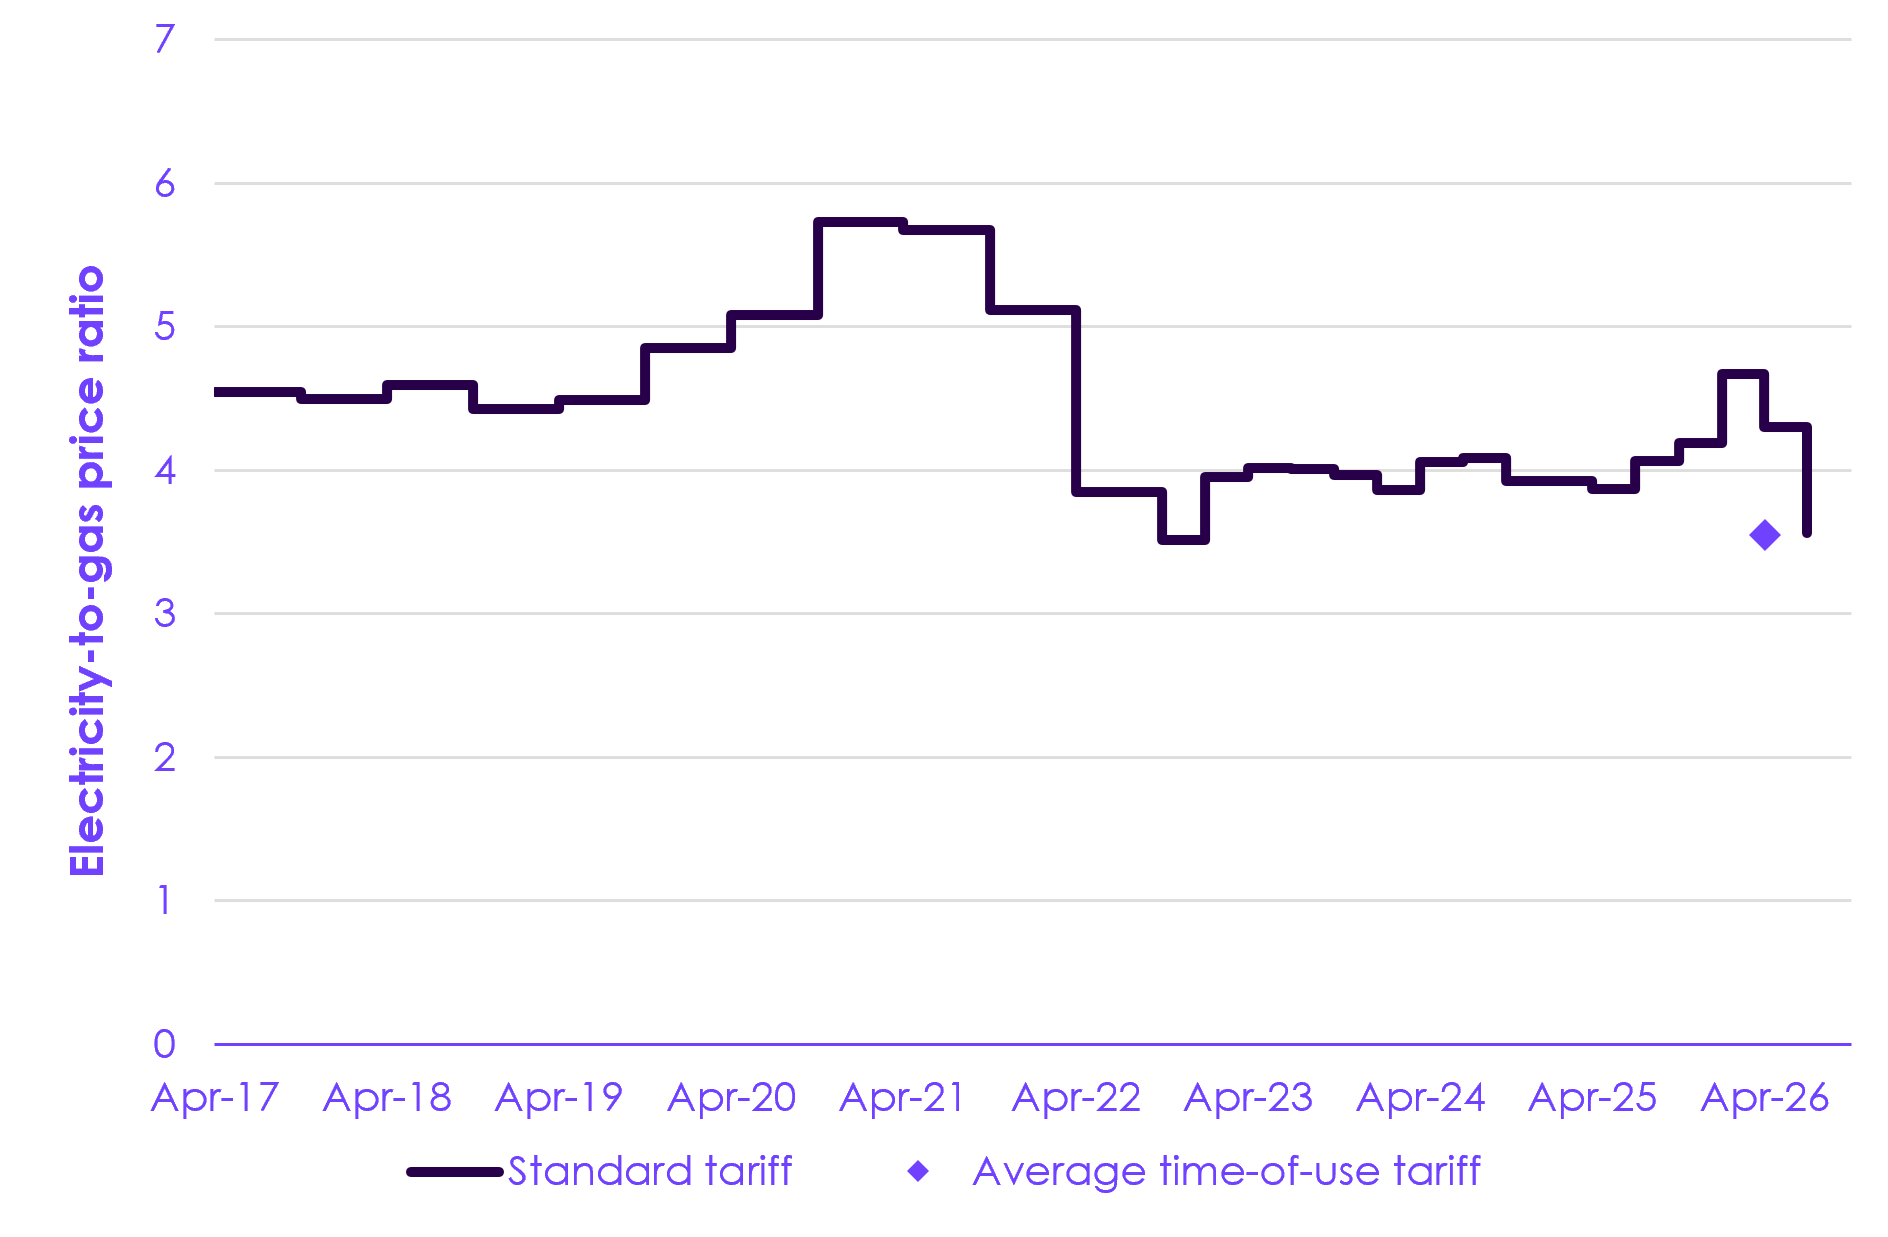 Description: For households on a standard tariff, the electricity-to-gas price ratio has risen from 3.9:1 in Q2 2025 to 4.3:1 in Q2 2026, before falling to 3.6:1 in Q3 2026. For households on a time-of-use tariff, the effective price of electricity is lower. Source: Ofgem (2026) Energy price cap (default tariff) levels; Sunsave (2026) The six best heat pump tariffs; CCC analysis. Notes: The average time-of-use tariff electricity-to-gas price ratio data point is constructed assuming electricity demand splits across tariff windows, based on published data, and using unweighted averages of the peak, standard, and off-peak electricity rates offered by three major suppliers of heat pump time-of-use tariffs (Octopus Cosy, British Gas Heat Power, and EDF heat pump tracker). This ratio is not comparable to the Balanced Pathway range shown in Figure 3.4h, which applies to a standard tariff. |
3.2.4 Agriculture and land use
Livestock numbers of both cattle and sheep have continued to fall over the period 2024 to 2025. Household purchases of beef and lamb in Great Britain have also continued to fall in 2025. While action on land use is mixed, peatland restoration is on the trajectory to achieve the combined ambition of the UK Government, the Northern Ireland Executive, the Scottish Government, and the Welsh Government.
- Livestock numbers: cattle and sheep numbers have reached their lowest levels since 1990, falling by around 1% and 2% respectively across the UK in 2025 compared to the previous year. Combined, livestock numbers have fallen by 7% between 2022 and 2025, driven by reductions in sheep numbers (Figures 3.8a and 3.8b). These are ahead of our Balanced Pathway. The UK Government has not set its own pathway or target for cattle and sheep numbers, and these reductions are not a result of direct policy intervention to reduce livestock numbers.[147];[148]
- Likely contributory factors to reductions across the UK include weaker consumer demand, indirect policies (such as the post-Brexit international trade landscape including Free Trade Agreements), and broader sector developments.[149] For example, lack of producer confidence in the beef industry, increasing production costs, poor weather conditions impacting lambing rates, and the increased prevalence of bluetongue in sheep in response to climate change.[150];[151]
- Northern Ireland has seen the steepest reduction in livestock numbers, with cattle falling by 2% from 2024 to 2025 and sheep by almost 8%. This is followed by England, where cattle numbers fell by 1% and sheep by around 4%. Scotland and Wales have also seen reductions in cattle but to a lesser extent, falling by around 1% or less during 2024 to 2025. Sheep numbers have slightly increased in these nations, by around 1%.
- Meat consumption: household purchases of beef and lamb in Great Britain fell by 5% between 2024 and 2025, following a longer-term reduction of 9% since 2021 (Figure 3.8c). Current beef and lamb consumption is already lower than projected under our Balanced Pathway. It is likely that high beef and lamb prices and cost-of-living pressures have contributed to this reduction. Average total meat consumption (including white meat) in the UK has been falling steadily over the long term, with a 21% reduction between 2002 and 2023.[152] The Government has not set a pathway for reducing meat consumption.
- In line with lower consumption, imports of beef and lamb fell by 9% between 2020 and 2023. There is no evidence that lower domestic production of beef and lamb is being replaced by imports.
- Imports, exports, and domestic production of beef and lamb have fallen across the UK. This reflects reductions in cattle and sheep numbers. The largest export market for Scotland, Wales, and Northern Ireland is the rest of the UK, so lower production has translated directly to lower exports.
- Peatland restoration: the UK reached its highest annual reported rate of restoration to date (21,400 hectares in 2025), an increase of 26% from the previous year and surpassing the combined ambition of all the UK nations for 2026 (Figure 3.8d). Rates of restoration have more than tripled since 2020.
- Scotland dominates in restoration activity in the UK, delivering 70% of the annual total. Consistent increases in rates since 2022 suggest this subsector has gained significant momentum. This is due to a long-established peat restoration programme, grant funding, and a focus on skills and capacity.
- Reported rates in England, Wales, and Northern Ireland continue to be maintained, but these are likely to be an underestimate on what is currently being delivered. For example, annual rates for England are based solely on the Nature for Climate Peatland Grant Scheme and currently do not include wider restoration achieved under agri-environment schemes and other funding sources.
- Tree planting: UK annual tree planting rates were 15,600 hectares in 2024/25, a decrease of 25% from the previous year (Figure 3.8e).[153] Significant effort will be required across the UK if the Government is to achieve the combined UK ambition, which requires reaching rates last seen in the late 1980s by 2030 (Figure 3.9).
- The reduction was largely caused by funding cuts in Scotland, where planting rates fell by 44% compared to the previous year. However, rates in 2023/24 were the highest achieved since 1990, due in part to an extended planting season in anticipation of the following year’s cuts. The latest year’s data (2024/25) show that rates fell back to slightly above 2022/23 levels.
- Scotland still delivered 54% of UK woodland creation in 2024/25. The Scottish Government’s recent Climate Change Plan has set a funding trajectory to recover planting rates, which, if achieved, will reach the new target of planting 18,000 hectares per year of new woodland by 2030 for Scotland.
- Elsewhere in the UK, planting rates have increased. In England, rates have increased for the fourth consecutive year to 5,770 hectares in 2024/25. This was largely due to simplifying the application process and uplifting payment rates (for example, as seen in the England Woodland Creation offer). This represents a 27% increase on the previous year, and the highest rate achieved since 2003. Rates in Wales and Northern Ireland remain relatively lower at 840 and 500 hectares respectively, however this represents a 31% and 16% increase on the previous year for each nation respectively.
| Figure 3.8 Progress scores for indicators in agriculture and land use |
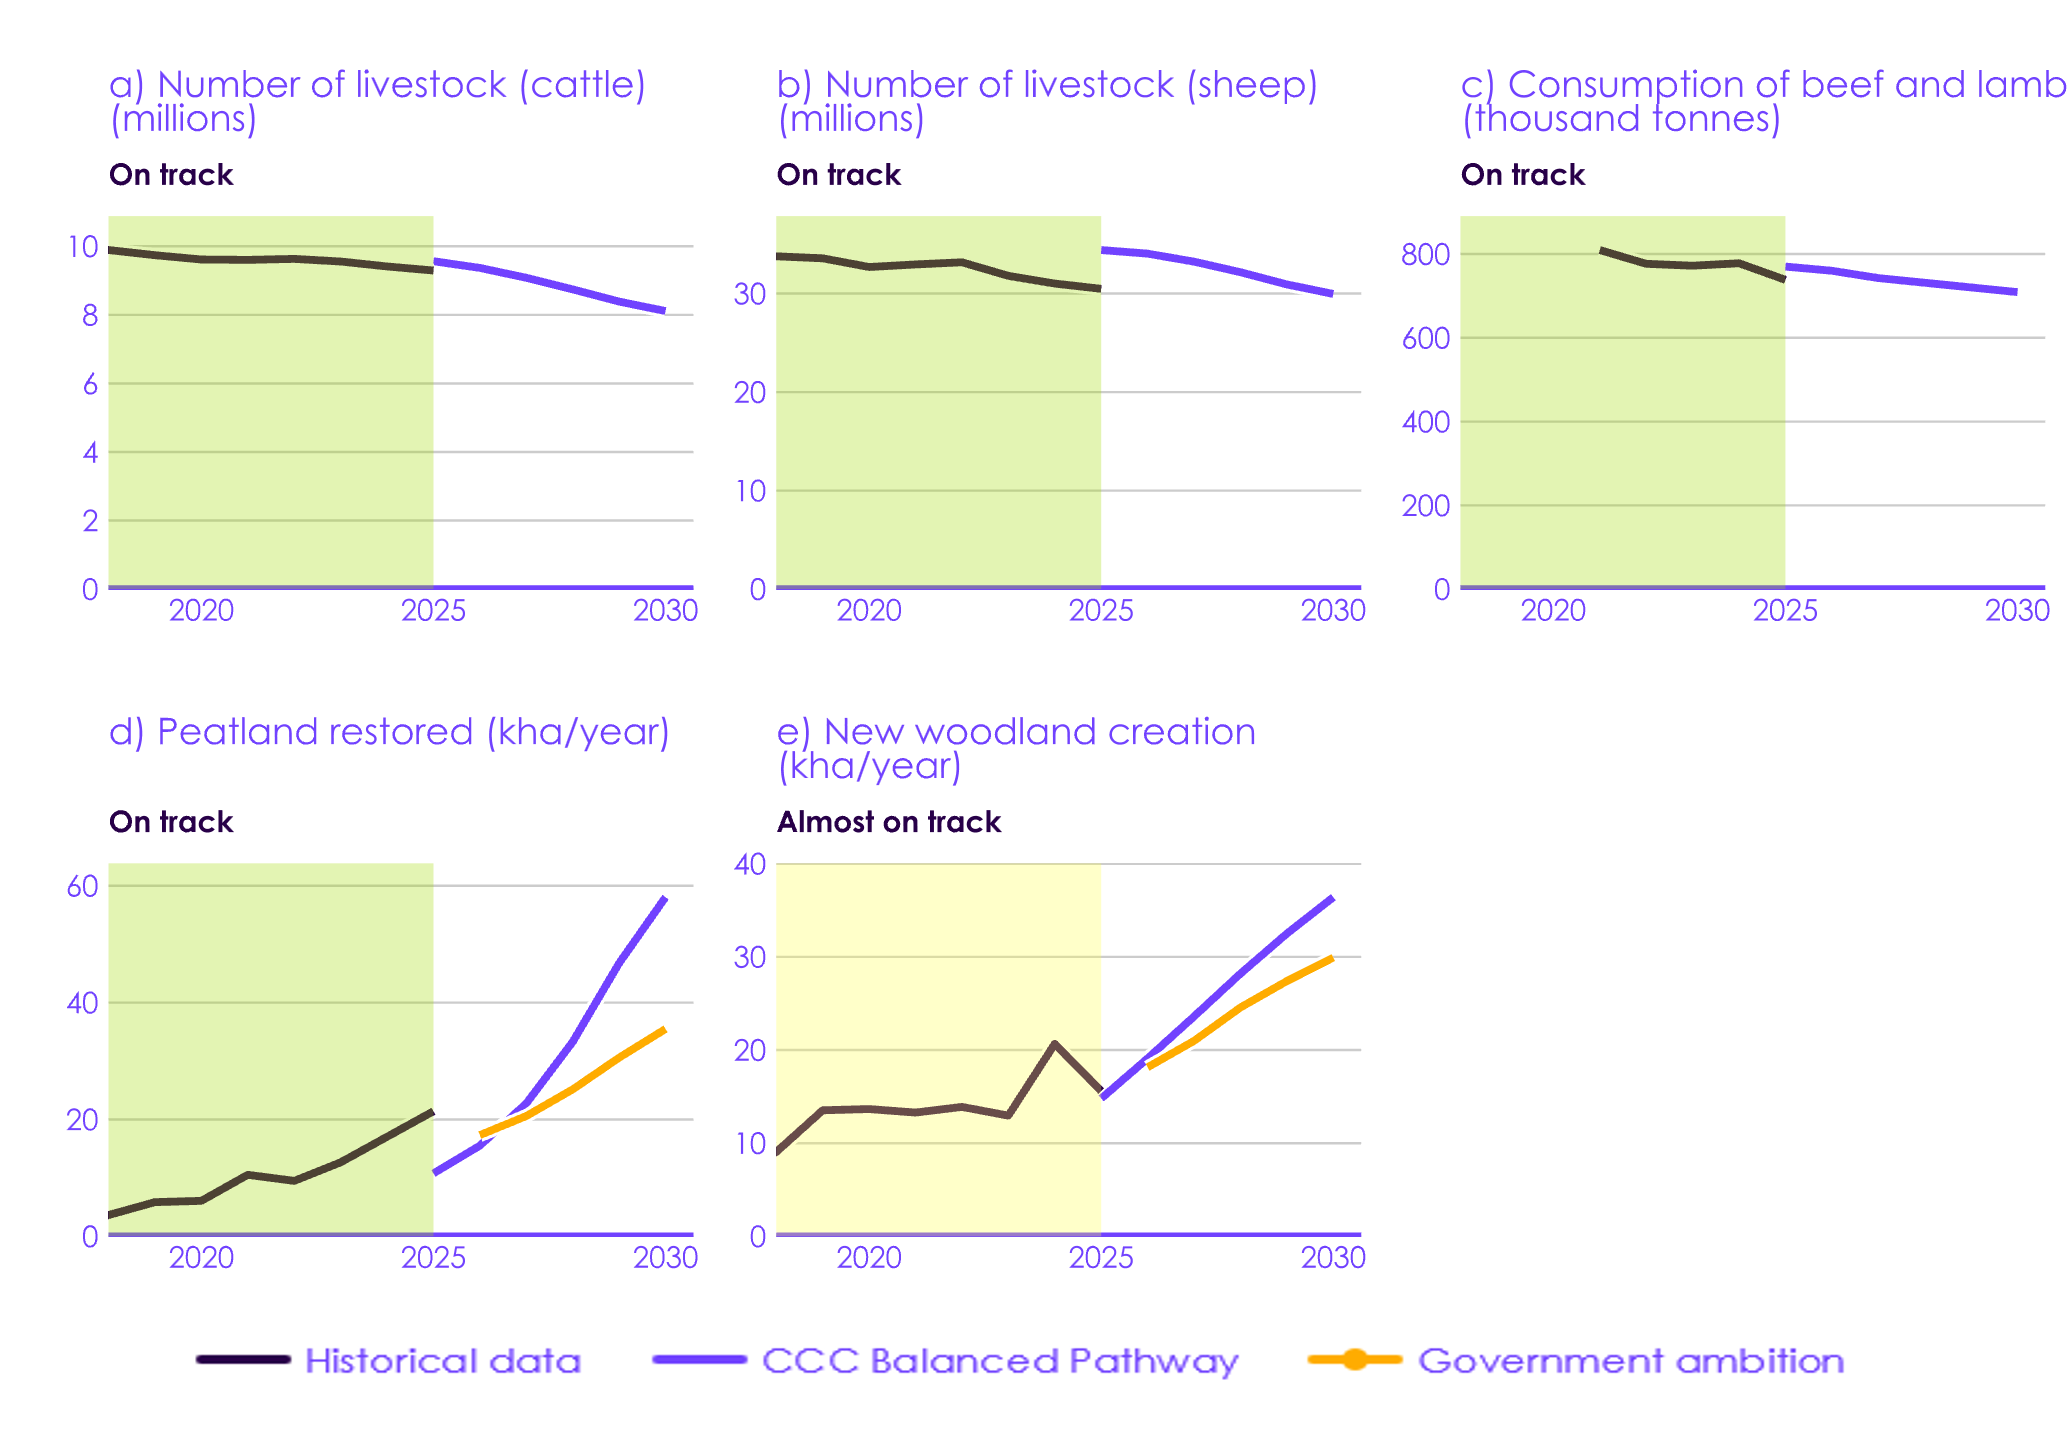 Description: Cattle numbers have steadily declined. Sheep numbers have been more variable but have seen a steeper decline since 2022. Household purchases of beef and lamb in Great Britain have continued to fall in recent years. Between 2024 and 2025, woodland creation rates showed a decline, while peatland restoration increased for the third year in a row. Source: Department for Environment, Food and Rural Affairs (Defra) Livestock populations in the UK (2026); Worldpanel by Numerator (2021-2025) Take Home data and AHDB estimates based on Worldpanel by Numerator Out of Home data, 52 w/e 24 April 2022, 01 January 2023, 31 December 2023, 29 December 2024, 28 December 2025; Forestry Statistics (2025) Forest Research; CCC analysis. Notes: (1) In charts (a) and (b), livestock numbers at the start of our Balanced Pathway are higher than the most recent historical year due to the increase in sheep numbers and lower than projected fall in cattle numbers assumed in our baseline from 2023. Our baseline is aligned to the activity data underpinning the 2022–2040 Energy and Emissions Projections (EEP). (2) In chart (c) data includes total household purchases of beef and lamb from retail and food services. Most data points represent total consumption of one calendar year, but data for 2021 is consumption between April 2021 and April 2022 as earlier data was not available. Our Balanced Pathway includes a 40% reduction in beef and lamb consumption (as part of a 35% reduction in all meat consumption) from 2019–2050. Due to data only being available from 2021, here our Balanced Pathway shows what consumption would look like if there was a 40% reduction by 2050 on 2021 levels. (3) For charts (d) and (e) ambition data are compiled from UK and devolved administration government pledges with each working to different timeframes and milestones. Where annual delivery targets have not been provided, we have annualised these based on the ambition and timeframes provided at delivery rates proportional to our advice in the Seventh Carbon Budget for each nation. (4) For chart (e), historical data has been derived from published annual reports (Scotland and Wales), or personal communication (England and Northern Ireland). Peatland restoration activity is currently not formally reported across the UK, and this value should not be considered definitive. Historical data are derived from Forest Research for all regions of the UK and includes establishment of new woodlands by both planting and natural colonisation. It does not include trees outside of woodlands. |
| Figure 3.9 Historical and projected woodland creation rates across the UK |
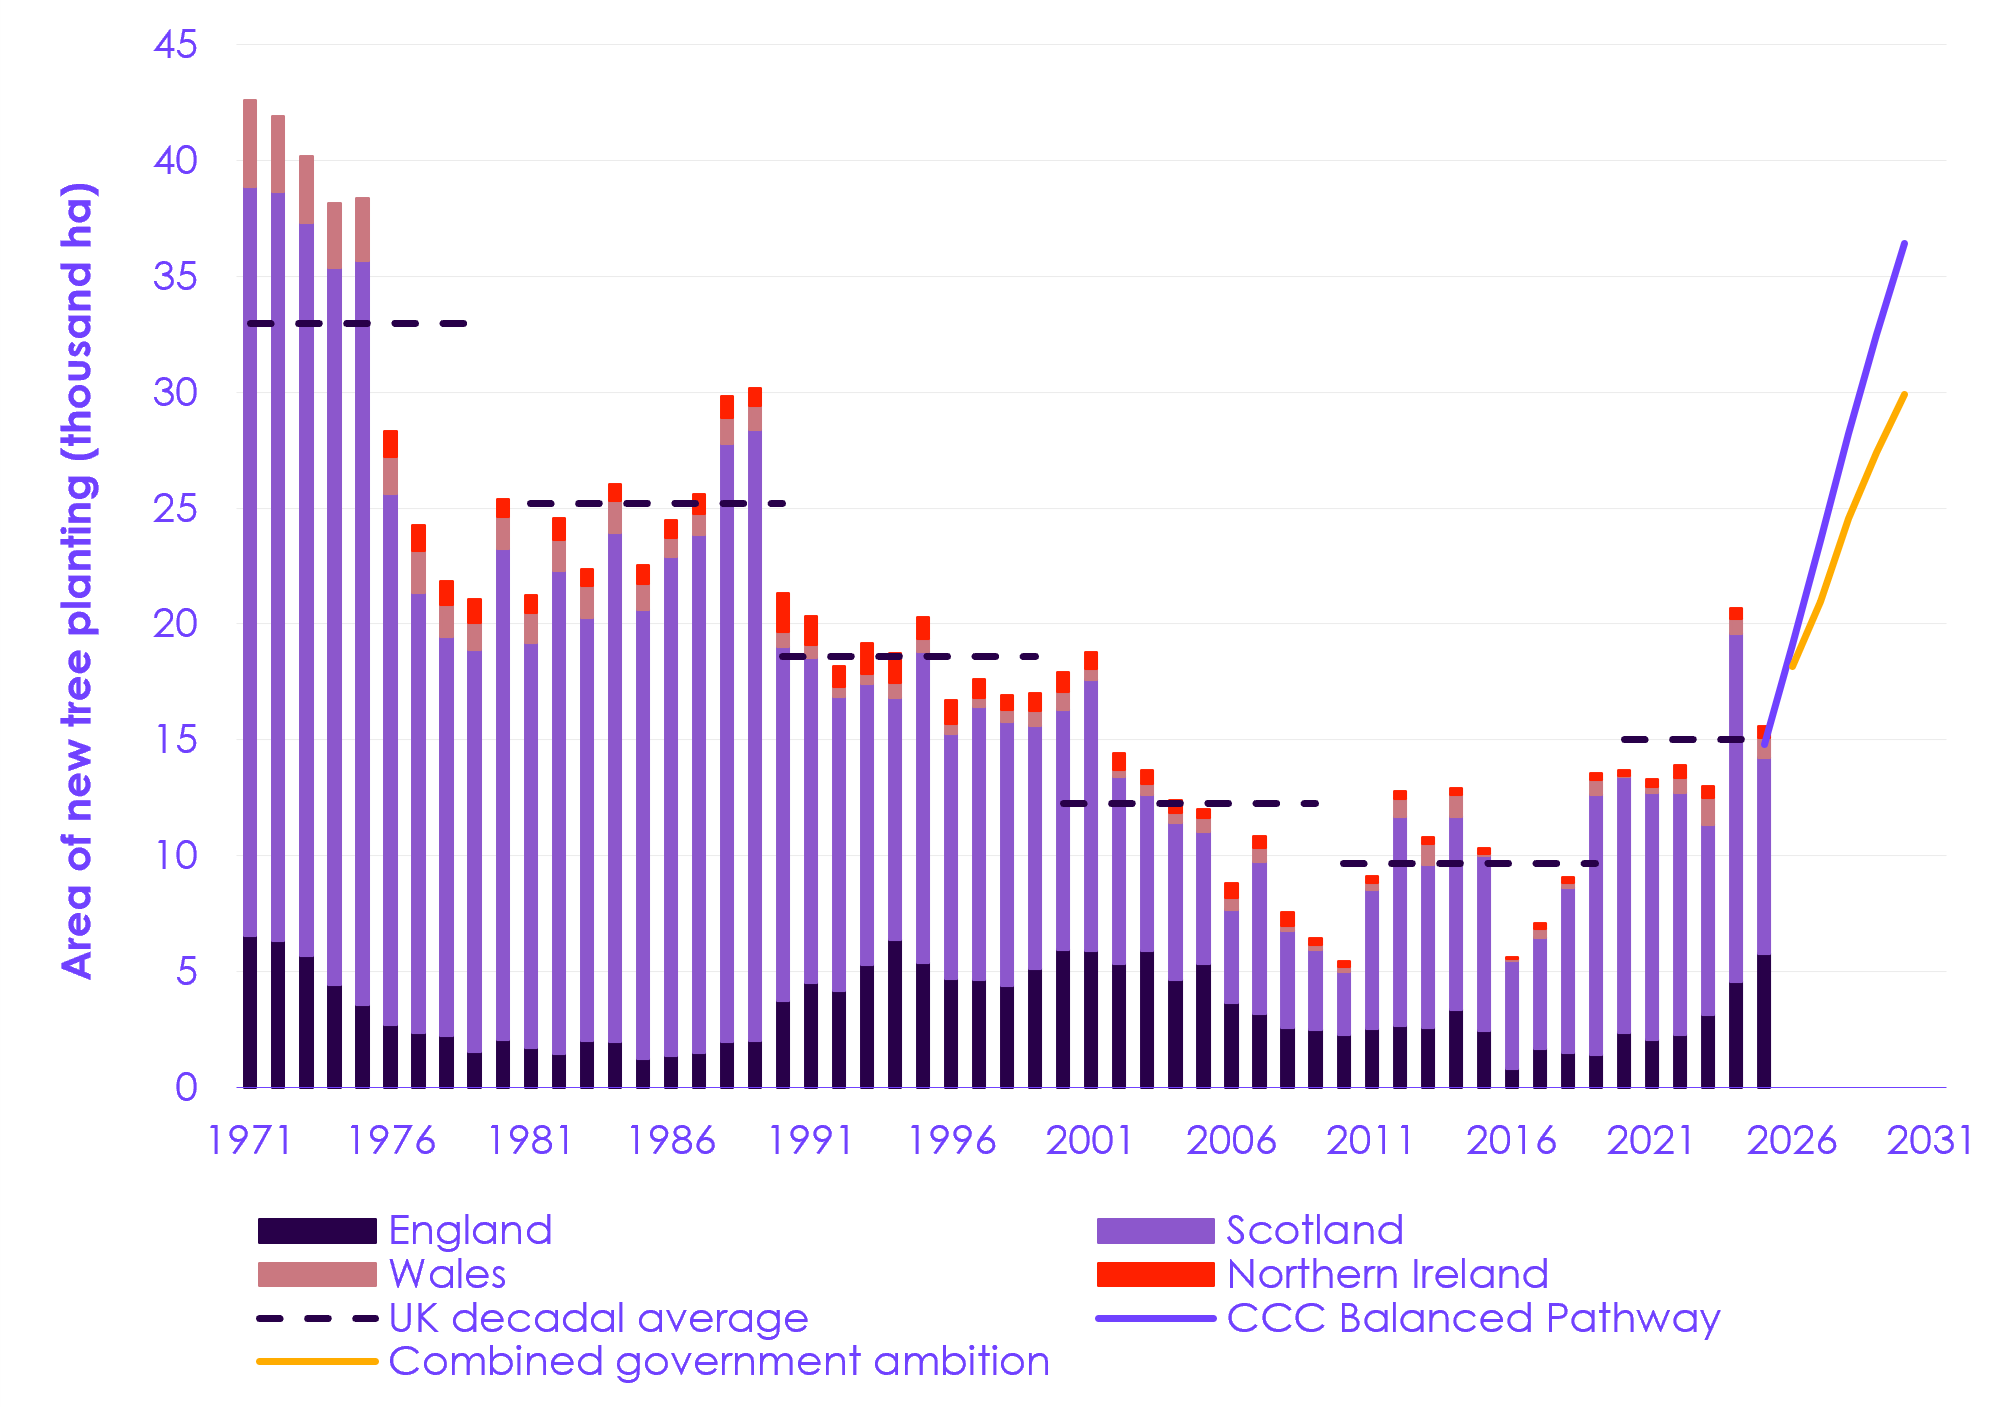 Description: Despite a fall in 2024/25, woodland creation is overall increasing in the UK, largely led by action in Scotland. The largest UK area since 1990 was planted in 2023/2024 before falling in the most recent year. Significant effort will be required across the UK if the combined articulated UK ambition is to be achieved. Source: Forest Research (2025) Forestry Statistics; CCC analysis. Notes: No data for Northern Ireland 1971–1975. |
3.2.5 Industry and waste
Industry
There has been limited progress in industrial electrification – the key measure for reducing industrial emissions in the CBGDP. Electricity prices are still too high relative to gas and while this will be improved by new measures, this is not likely to be enough to significantly encourage electrification.
- Industrial electricity use: the share of electricity in industrial energy use decreased slightly from 28% in 2023 to 27% in 2024 (Figure 3.10a). While the CBGDP does not specify a target, industrial electrification is the key source of decarbonisation in the plan, so the share of electricity demand will need to increase significantly.
- In our Balanced Pathway, industrial electricity demand increases as many heat processes electrify, reaching 36% of industrial energy demand by 2030. A similar level of electrification is expected in the CBGDP.
- Progress underway to electrify the Port Talbot steelworks is not yet reflected in the data as the electric arc furnace (EAF) will not be completed until late 2027. Once opened, the site will be equivalent to around 1.4% of industrial electricity demand. Government schemes have supported some other much smaller industrial electrification projects since 2024, which are also not yet reflected in the data (see Box 4.3).
- Industrial electricity-to-gas price ratio: based on surveys of large industrial businesses, electricity prices are approximately four times that of gas (Figure 3.10b).[154] Reducing this ratio is key to making a commercial case for industrial electrification. In the short term, exemptions will ease this to an extent but are unlikely to be sufficient on their own. In the longer term, shifting to an energy system based on low-cost variable renewables will result in lower annualised system costs per unit of electricity and less exposure to fossil fuel price shocks (see Section 7.5 and Section 10.2 of our advice on the UK’s Seventh Carbon Budget).
- Electric industrial technologies, particularly heat pumps, are more efficient than fossil fuel alternatives. A ratio of just under 3:1 is needed to make industrial heat pumps cheaper to run than fossil fuel alternatives. For technologies where the efficiency gains from electrification are smaller, such as electric boilers or induction furnaces, a lower electricity-to-gas price ratio would be needed to deliver energy cost parity.
- The Government has introduced discounts on electricity prices to support the international competitiveness of energy-intensive industry. These schemes have not been designed to encourage electrification, but they do reduce the electricity-to-gas price ratio.
- The British Industry Supercharger discounts some policy and network costs from the electricity bills of around 500 of the most-energy intensive businesses.[155] Based on government estimates of the impact of the discount, this reduces the average electricity-to-gas price ratio to just over 2:1.[156];[157] It is too soon to say if the latest uplift to the discount, applied from April 2026, will be sufficient to encourage electrification. However, there is no evidence that electricity price discounts to date have led to increased electrification.
- From 2027, the British Industrial Competitiveness Scheme (BICS) will exempt a larger number of manufacturers from some energy policy costs. For the roughly 10,000 businesses that will be eligible, this is estimated to bring electricity costs down by
£35–£40/MWh, leading to a ratio of just over 3.5:1.[158] This is unlikely to reduce the ratio enough to significantly influence electrification.[159]
Waste
There has been little improvement in the UK’s household recycling rate, a key measure for delivering the CBGDP for waste. The volume of biodegradable municipal waste sent to landfill is falling; however, this has been offset by an increase in waste sent to energy from waste (EfW).
- Household recycling rate: the UK’s household recycling rate has been between 44–46% for over a decade, with a small improvement of 0.5% between 2022 and 2023 (Figure 3.10c). The CBGDP does not include a target for improving recycling rates. However, to deliver the plan, they will need to significantly increase. In our Balanced Pathway, the household recycling rate increases to 57% by 2035.
- In recent years, the volume of waste sent to landfill in the UK has fallen largely due to waste being diverted into EfW, rather than by a reduction in waste arisings or improvements in recycling.[160]
- This means emissions reductions from landfill have been partially offset by increasing EfW emissions. Improving the recycling rate and reducing waste arisings are key to delivering meaningful emissions reductions in waste in the future.
| Figure 3.10 Progress scores for indicators in industry and waste |
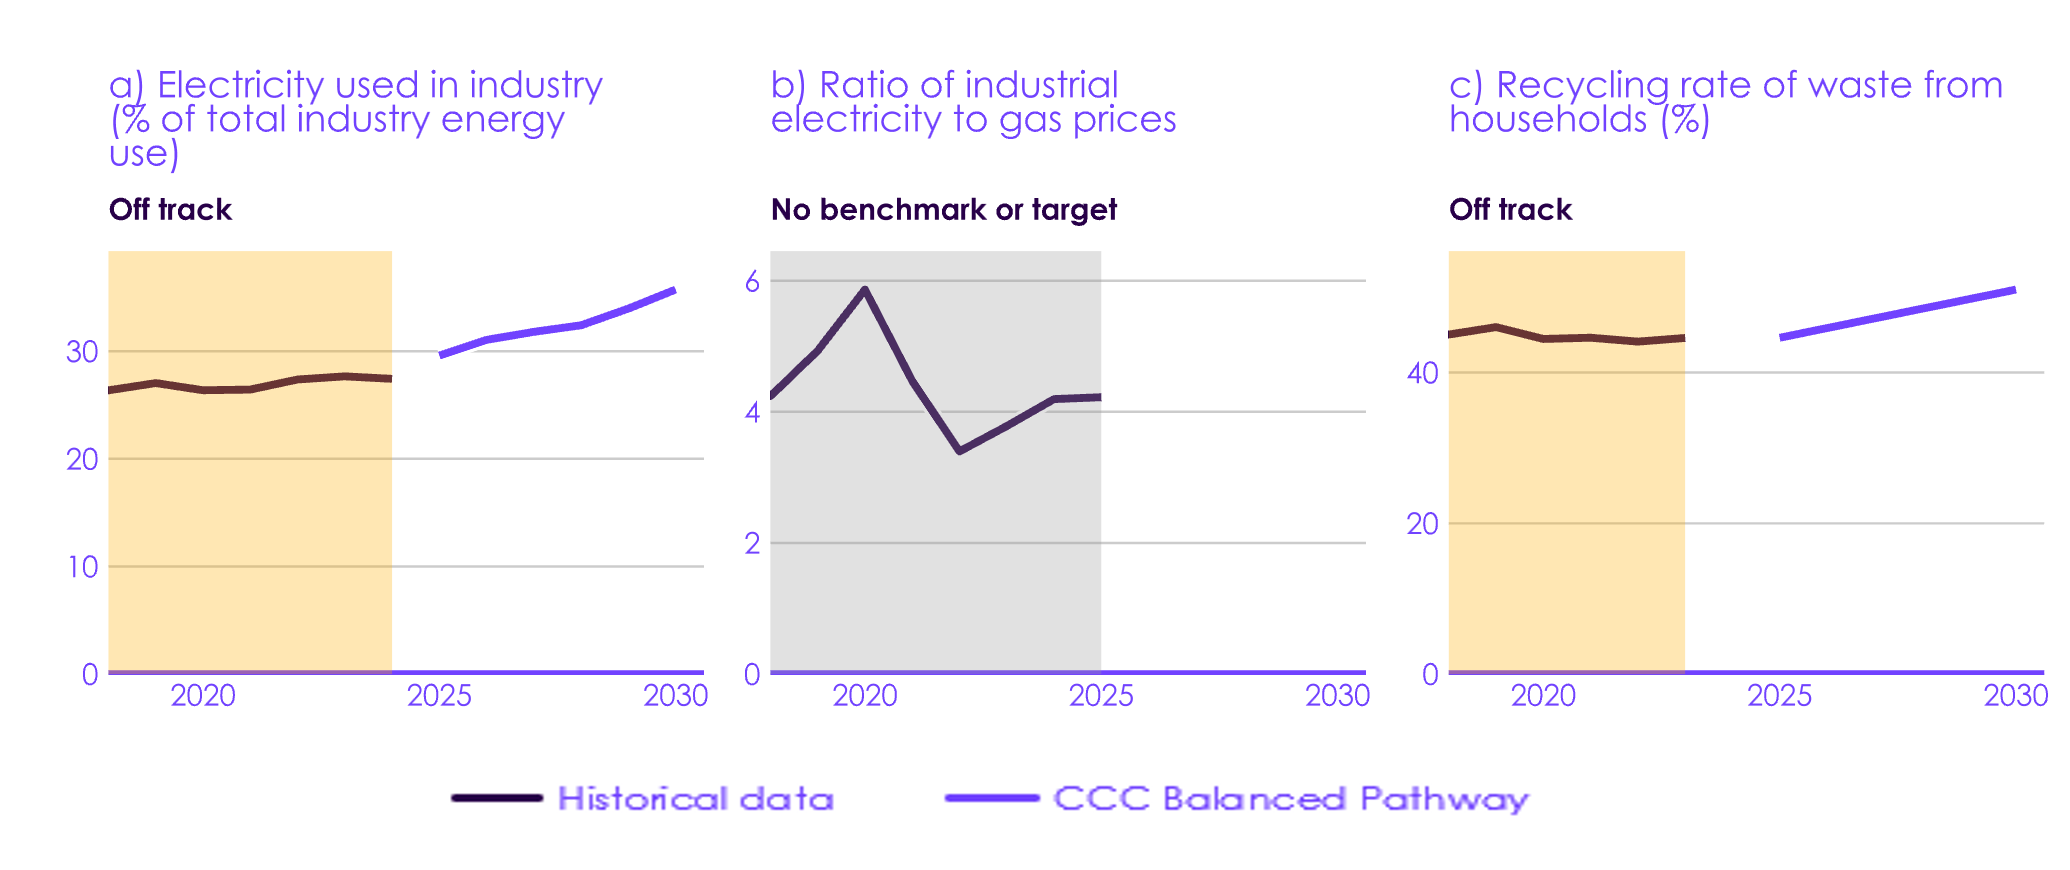 Description: The proportion of electricity used in industry has not grown and needs to increase. The ratio of industrial electricity-to-gas prices remains over four. The household recycling rate has also not grown and needs to increase. Source: Digest of UK Energy Statistics (DUKES) (2025) Electricity: commodity balances; National Atmospheric Emissions Inventory (NAEI) (2026) UK Greenhouse Gas Inventory; DESNZ (2026) Prices of fuels purchased by manufacturing industry; Defra (2025) UK Statistics on Waste; CCC analysis. Notes: (1) Chart (a) uses industrial electricity data from DUKES, and data for other fuels from the NAEI. (2) Chart (b) is based on surveys of energy prices paid by industrial users. We show the ratio for ‘large’ users, defined as manufacturers which use over 8,000 MWh of electricity or gas. Some discounts from the Supercharger will show in this data, but not all of them (for example, discounts on network costs are paid as a rebate). The data also excludes the Climate Change Levy, from which most large industrial users are exempt. It does not include the UK Emissions Trading Scheme (ETS) costs that manufacturers pay for using gas, although a large portion of these costs are covered by free allowances. |
3.2.6 Aviation
The use of sustainable aviation fuel (SAF) has increased in line with government ambitions; however, supplies will need to be diversified in coming years to remain on track. Growth in demand for flying has slowed, and fuel efficiency has reached a historic high.
- Sustainable aviation fuel: the share of jet fuel provided by SAF slightly increased from 2.2% in 2024 to 2.5% in 2025 (Figure 3.11a). This is above the level set by the UK Government’s SAF mandate. However, in 2026, SAF uptake will need to increase to 3.6% of jet fuel supply to comply with the mandate and remain on track to reaching 10% of fuel share by 2030. All SAF supplied in 2025 was ‘first generation’ hydrotreated esters and fatty acids (HEFA). SAF will need to begin to diversify away from HEFA by 2027 as the HEFA cap comes into force, and power-to-liquid SAF will need to become available by 2028 to enable compliance with the mandate. The SAF mandate has a main obligation and a power-to-liquid obligation:
- The main obligation sets SAF uptake as a share of total fossil jet fuel supply. It started at 2% in 2025, increases to 10% in 2030, and 22% in 2040. Within the main obligation, there is a cap on HEFA to ensure that ‘second generation’ biowaste SAF develops. The HEFA cap comes into force in 2027 and decreases permissible HEFA to 71% of total SAF supplied in 2030 and 35% in 2040.
- The SAF mandate also sets a power-to-liquid obligation that starts in 2028 at 0.2% of total jet fuel and reaches 3.5% by 2040. ‘Third generation’ power-to-liquid SAF uses hydrogen and captured carbon to produce a synthetic fuel that is not dependent on biowaste resource and has high emissions savings potential, depending on the feedstock and production pathway.
- Distance travelled by plane: passenger-km increased by 3% in 2025 but remain below the trajectory from our Balanced Pathway (Figure 3.11b). The Government has not published the passenger-km trajectory modelled for the CBGDP. The past year’s increase was caused by international flight passenger-km, which increased 3% in 2025 compared to 2024, whereas domestic passenger-km decreased by 1%.
- Fuel efficiency: fuel efficiency reached its historical highest in 2025 at 0.41 kWh/passenger-km. This is slightly underperforming against our Balanced Pathway, which estimates a 0.39 kWh/passenger fuel efficiency rate in 2025 (Figure 3.11c). The Government has not published an expected fuel efficiency improvement rate. Before the COVID-19 pandemic, fuel efficiency improved from 0.58 kWh/passenger-km in 2010 to 0.43 kWh/passenger-km in 2019.
| Figure 3.11 Progress scores for indicators in aviation |
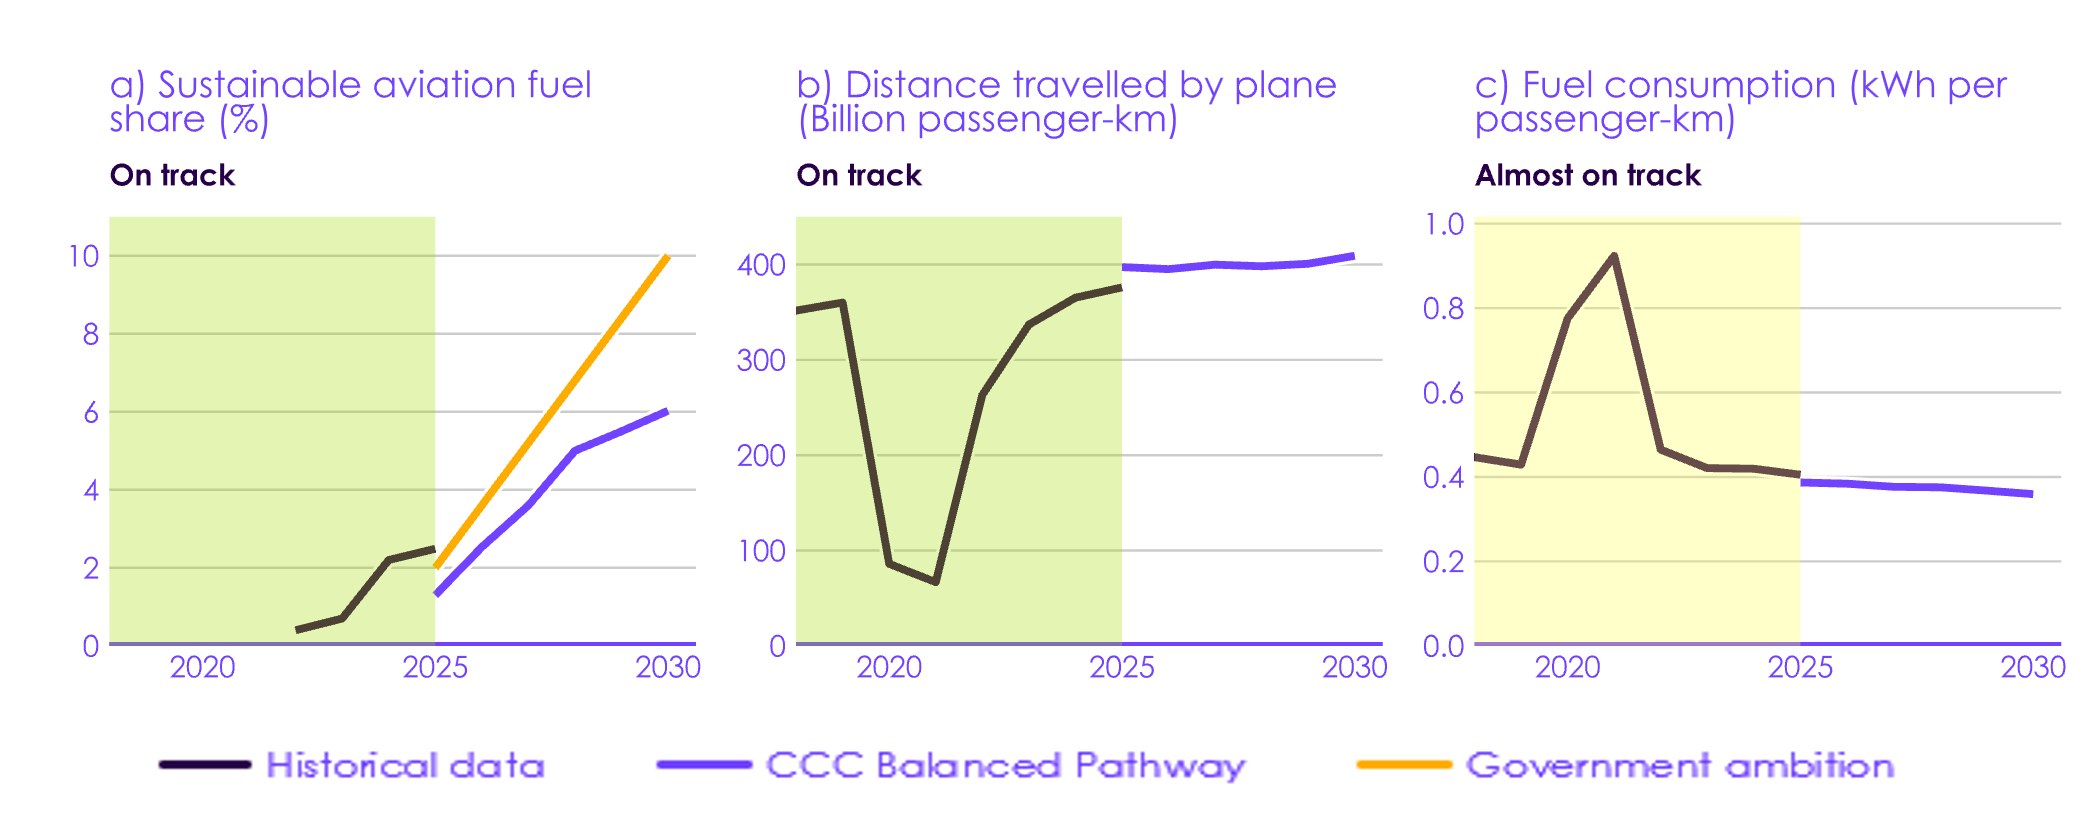 Description: The share of jet fuel provided by sustainable aviation fuel (SAF) is on track to achieve the SAF mandate, and passenger demand growth is declining in line with assumptions in the Balanced Pathway. Fuel consumption per passenger-km is falling due to improved efficiency but is slightly underperforming compared to the benchmark. Description: The share of jet fuel provided by sustainable aviation fuel (SAF) is on track to achieve the SAF mandate, and passenger demand growth is declining in line with assumptions in the Balanced Pathway. Fuel consumption per passenger-km is falling due to improved efficiency but is slightly underperforming compared to the benchmark. Source: Department for Transport (2026) Sustainable Aviation Fuel (SAF) Mandate statistics; Civil Aviation Authority (unpublished); DESNZ (2026) Energy Trends: UK oil and oil products; CCC analysis. Notes: (1) The SAF share in chart (a) is calculated as the percentage of total aviation fuel supplied. |
3.2.7 Electricity supply
There has been a record amount of new renewable capacity added through Allocation Round Seven (AR7) of the Contracts for Difference (CfD) scheme. However, achieving government ambitions for offshore wind by 2030 will require securing a significant amount of new capacity in Allocation Round Eight (AR8) alongside continued, concerted action with industry to shorten delivery times. This builds on steps the Government is already taking such as the accelerated auction timeline. There remains scope to partially offset under-delivery of one generation technology with additional deployment of others. There has also been strong progress on deployment of grid-connected battery storage. Unabated fossil fuel powered generation rose slightly in 2025 but the longer-term trend is downward.
- Offshore wind: offshore wind capacity has continued to increase (Figure 3.12a). The Government is nearly on track for its 2030 ambitions of 43–50 GW of offshore wind, but delayed delivery is likely without further action.
- In 2025, 0.7 GW of new offshore wind capacity was added, bringing total UK capacity to 16.6 GW. Capacity will need to increase between 2.6 and 3 times by 2030 to achieve government ambitions of 43–50 GW, with average annual deployment of 5.3–6.7 GW needed. This is significantly higher than recent deployment levels. The future pipeline was strengthened by AR7, which contracted a record 8.2 GW of fixed offshore wind and 0.2 GW of floating offshore wind, with scope for further additions in later allocation rounds.
- Assuming projects are completed on schedule, the current pipeline is expected to deliver around 32 GW by 2030, rising to 36 GW by 2031 and 37 GW by 2032, broadly consistent with industry projections.[161];[162] Future allocation rounds could add further capacity to the pipeline. However, the long delivery times currently experienced of around four to eight years between CfD award and operation may pose challenges. Achieving the Government’s ambitions for 2030 will require strong procurement and shortened delivery times. Timely transmission network reinforcement remains critical to facilitate and make effective use of new offshore wind capacity.
- Onshore wind: onshore wind operational capacity has been increasing gradually and there is a strong near-term project pipeline (Figure 3.12b). However, achieving future targets relies on a sustained acceleration in deployment and continued pipeline expansion.
- 0.3 GW of new onshore wind capacity was added in 2025, bringing total UK capacity to 16.4 GW. 4.7 GW of new capacity is contracted through the CfD scheme to be delivered by 2030.
- Achieving government ambitions of 27–29 GW in Great Britain by 2030 will require average annual deployment of 2.1–2.5 GW up to the end of the decade. This is significantly higher than recent levels and exceeds the historical peak of 1.8 GW in 2017.
- Onshore wind typically has delivery times of around two to four years, which is notably shorter than offshore wind. There is potential for upcoming allocation rounds to expand the pipeline for 2030, but significantly more onshore wind capacity will be needed to achieve future targets.
- Solar PV: deployment has accelerated strongly in recent years, supported by growth across both large and small-scale installations (Figure 3.12c).
- 2.8 GW of solar PV capacity was added in 2025, bringing total UK capacity to 21.7 GW. This was the highest annual deployment since 2015, with 2025 being the third consecutive year of strong growth. Achieving government ambitions of 45–47 GW will require capacity to more than double, implying average annual deployment of around 5 GW up to the end of the decade. This is above recent levels.
- There is a strong pipeline of large-scale (over 5 MW) solar through the CfD scheme, with 11 GW of new CfD capacity contracted to be delivered by 2030, including 4.9 GW through AR7. Given relatively short delivery times (around two to five years), further capacity can be added through future allocation rounds in time for 2030. Large-scale solar is also being installed outside of the CfD scheme through merchant deployment and Power Purchase Agreements.
- In addition, an average of 1.1 GW of small-scale (less than 5 MW) solar capacity has been installed per year over the past three years, of which around 0.8 GW a year comes from domestic rooftop installations.
- The Government’s ambition to triple the number of homes with rooftop solar panels by 2030 could contribute around 50% of the total cumulative deployment needed to achieve its ambitions for overall solar PV capacity (see Section 3.2.3). The Government is also taking steps to increase deployment of rooftop solar on non-residential buildings (see Section 4.3.3).
- Battery storage: grid-connected battery capacity reached 6.8 GW in 2024 (Figure 3.12d). Official data for 2025 are not yet available, but other sources indicate significant increases in battery capacity, with Modo estimating a record 2 GW installed in Great Britain in 2025.[163] Average annual deployment of 2.7–3.4 GW will be needed in the coming years to achieve the Government’s ambition of 23–27 GW of short-duration capacity by 2030. This will likely be met by the large pipeline of battery storage in the connections queue.[164]
- Unabated fossil fuel generation: the share of electricity generation in Great Britain from unabated fossil fuels was 26.4% in 2025, slightly up from 26.0% in 2024 (Figure 3.12e). This follows a longer term downwards trend, with the share falling from 37.2% in 2021. This can be volatile year-on-year due to variations in weather patterns, and wider supply availability.
- The increase from 2024 to 2025 was likely due to lower nuclear generation, higher exports of electricity via interconnectors, and transmission network constraints (see Section 1.1.2). It is currently too early to tell whether the indicator is on track to achieve the Government’s milestone of less than 5% by 2030.
- CfD strike prices: the weighted average CfD strike price of wind and solar projects with live contracts is set to fall significantly in the coming years, from around £152/MWh (2026 prices) in 2025 to £95/MWh by 2030 (Figure 3.12f). The average price is heavily influenced upward by the relatively high strike prices for early projects. When excluding those projects, the weighted average is £91/MWh in 2025, falling to £76/MWh in 2030.
- As newer, lower-cost projects come online and become a larger proportion of the CfD-backed fleet, the average weighted strike price will fall further (see Annex 3 from the Progress in reducing emissions – 2025 report to Parliament for further detail).
- The extent to which this contributes to lower consumer bills will depend on future wholesale prices (which determine the difference payments paid to and from generators and consumers) and the trajectory of other bill components such as network costs.
| Figure 3.12 Progress scores for indicators in electricity supply |
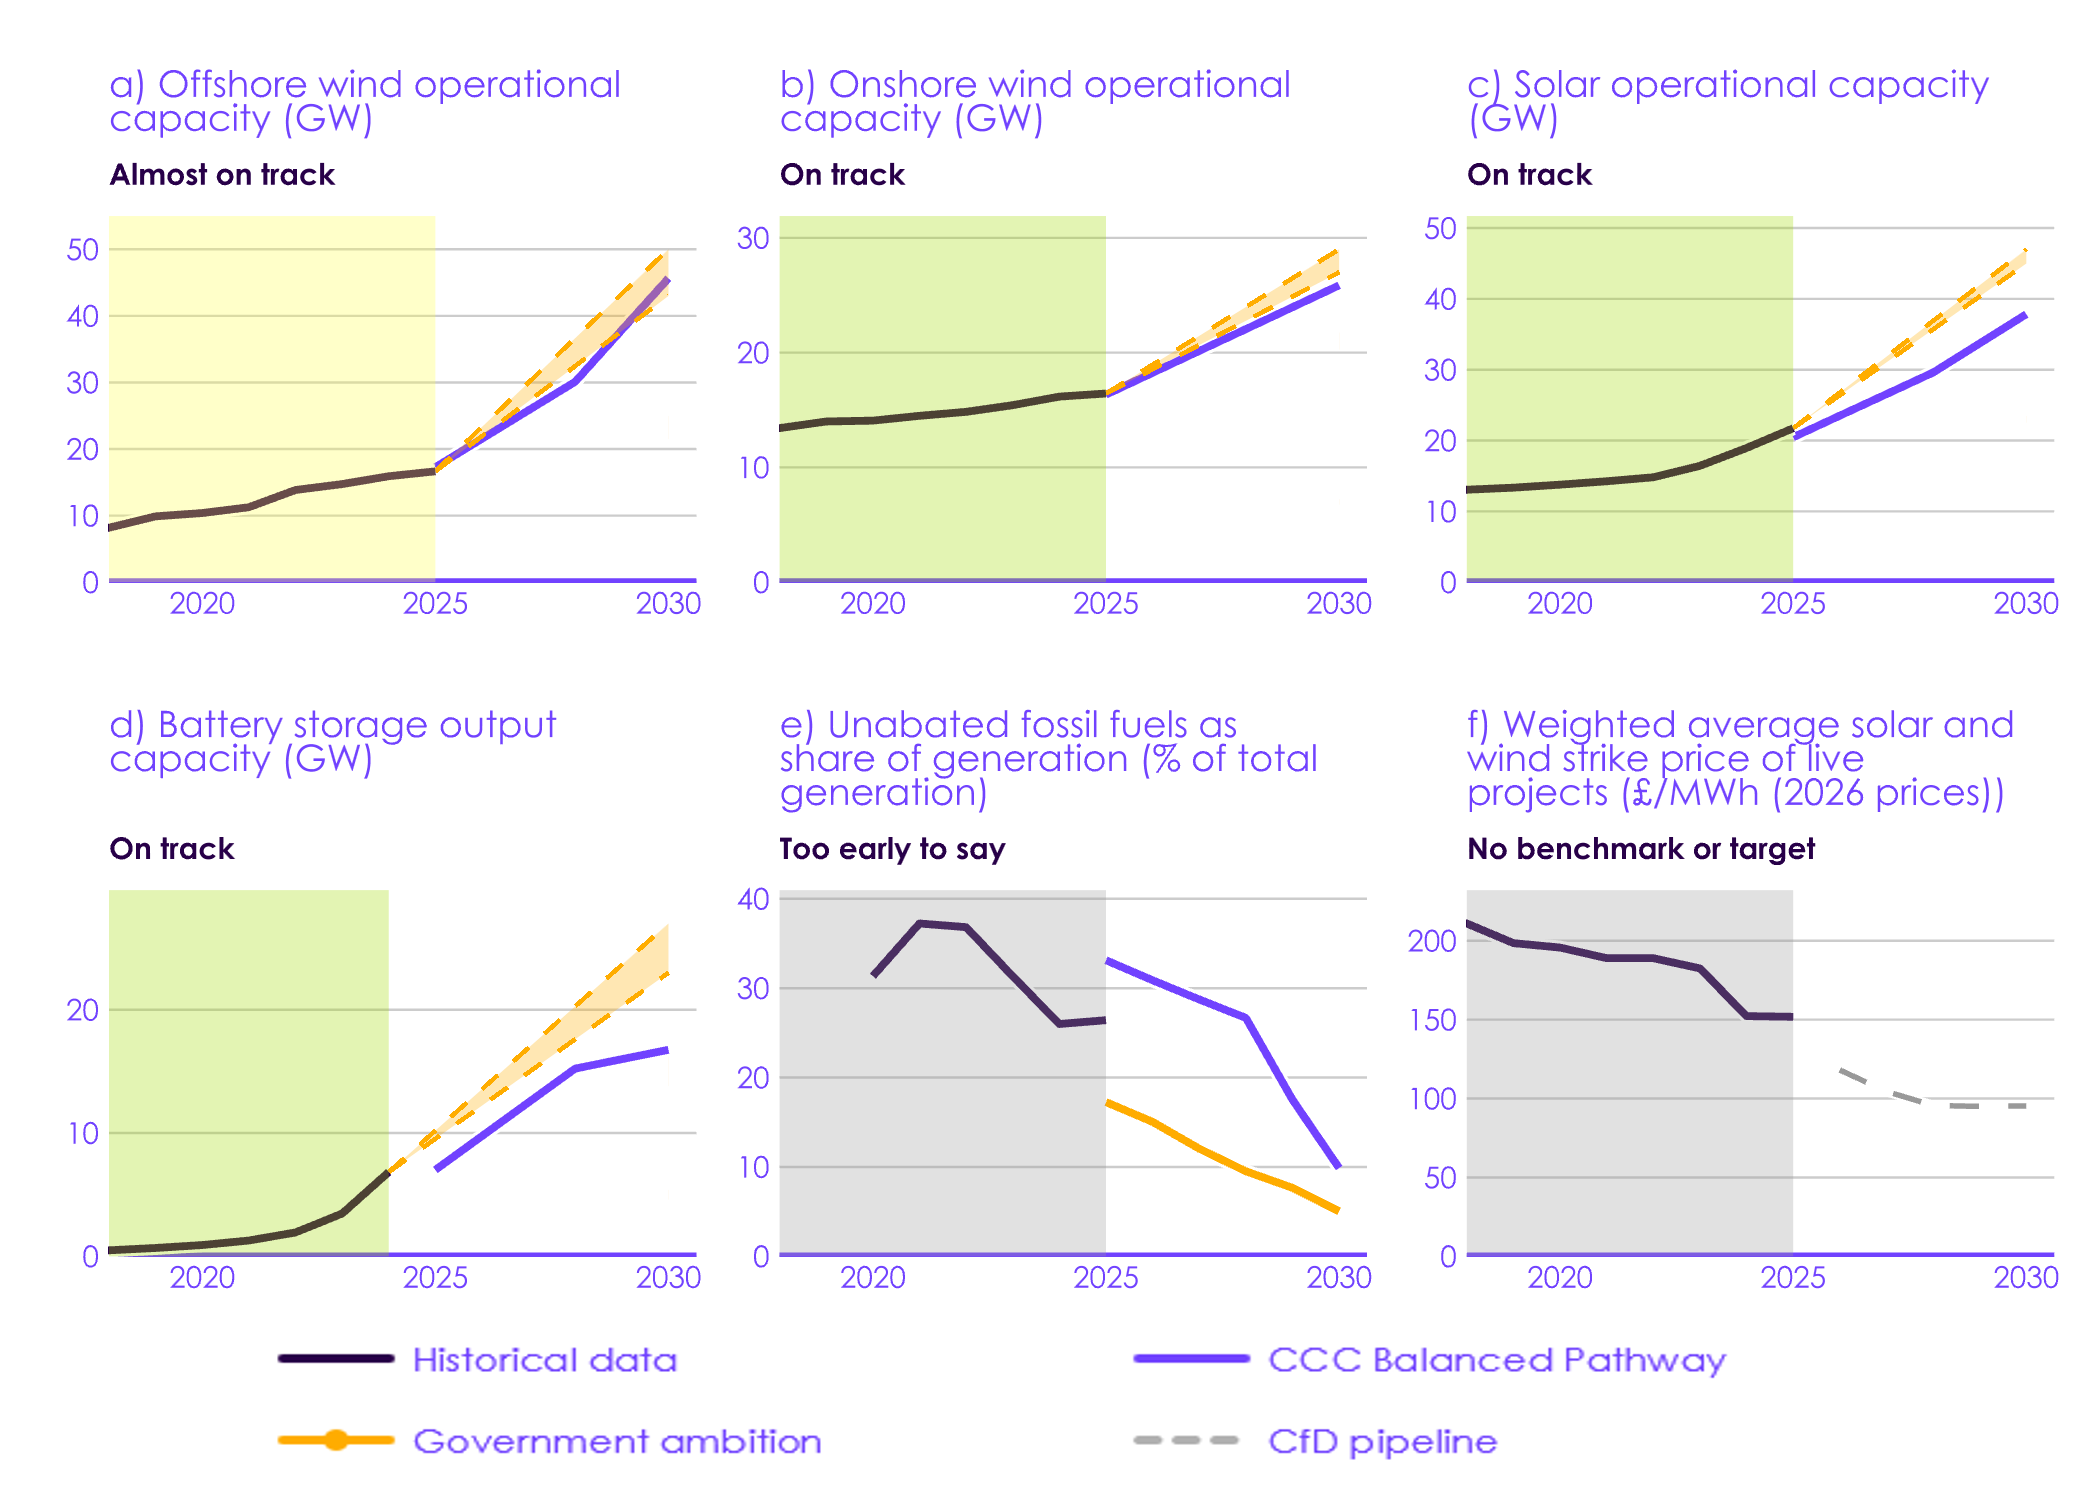 Description: Solar, onshore wind, and grid connected battery capacity increased last year and are on track. Offshore wind operational capacity also increased and is nearly on track; the speed of offshore wind deployment from Contract for Difference (CfD) award to project commissioning will need to accelerate to achieve government targets. The unabated fossil fuel share of generation increased slightly in 2025, but the longer-term trend is downward. The weighted average strike price from wind and solar projects has fallen over recent years and is expected to fall further based on the current pipeline of contracted projects. Source: DESNZ (2026) Energy Trends; DESNZ (2026) Clean Power Metrics (2026), DESNZ (2025) Digest of UK Energy Statistics; Low Carbon Contracts Company (LCCC) (2026) CfD Register; CCC analysis. Notes: (1) Clean Power Capacity ranges from the Clean Power 2030 Action Plan are used as government ambition in charts (a), (b), (c), and (d) (Great Britain only). (2) For chart (e), government ambition reflects data from the Government’s Carbon Budget Growth and Delivery Plan shared by DESNZ. To align with the Government’s definition, this excludes energy from waste and combined heat and power and is for Great Britain only. (3) Chart (f) reflects the generation-weighted average CfD strike price for wind and solar projects (current and future) based on the LCCC register as published in May 2026. Due to methodological differences and updated data, results differ from Figure A4 of the 2025 UK Progress Report. Prices are adjusted to 2026 levels and may also differ from LCCC’s quoted “current strike price” due to indexation differences. |
3.3 Cross cutting impacts and enablers
Air quality is improving. Public concern about climate change and overall knowledge of the Net Zero target remain high. The green economy is growing, despite a slight dip this year in green jobs.
- Net Zero economy: the number of green jobs reached over 650,000 in 2024, as defined in experimental statistics by the Office for National Statistics (ONS). The number has increased by 23% in the past five years (Figure 3.13a), indicating a long-term trend of workers moving towards growing low-carbon sectors. Green jobs saw a slight dip in the last year, reasons for which are unclear.
- There has been significant growth since 2015 in jobs in nuclear, renewable energy, and low-carbon transport, with growth continuing between 2023 and 2024.
- It is estimated that the UK’s low-carbon and renewable energy economy (LCREE) generated about £77 billion in 2024 in current prices, an increase of £8.1 billion (about 12%) since 2023.[165]
- Business commitment to Net Zero is strong, with 81% of surveyed firms reporting taking concrete action on their climate targets in the last year, compared to 49% the year before.[166];[167]
- Air quality: a range of factors (moving away from coal towards cleaner fuels, reduced emissions from industry, and improved emissions standards for vehicles), some of which are linked to decarbonisation efforts, have led to a reduction in the concentration of NO2 and PM10. In the last ten years the concentration of NO2 and PM10 has reduced by 47% and 22% respectively (Figures 3.13b and 3.13c). As EVs and heat pumps replace fossil fuel cars and boilers, there will be further improvements in air quality, with knock-on benefits for health.
- The National Emission Ceilings Regulations (NECR) legislated a target in England of a 73% reduction in nitrogen oxides (NOx) by 2030 compared to 2005 levels, assessed against the National Atmospheric Emissions Inventory (NAEI).[168];[169] Levels of NO2 from roadside urban emissions are falling in line with this target. There are no legislated targets for PM10.
- Public perceptions: UK citizens continue to have a high level of concern about climate change, with around four-fifths reporting they are fairly or very concerned about climate change. Knowledge of Net Zero also remains high, with around four-fifths of people reporting they know a lot, a fair amount, or a little about Net Zero. Knowledge of EVs remains high. Knowledge of heat pumps is lower and has only increased slightly in the last few years, although it is relatively high considering the small proportion (less than 2%) of homes that currently have a heat pump (Figure 3.14).[170];[171]
| Figure 3.13 Progress scores for cross-cutting indicators | ||
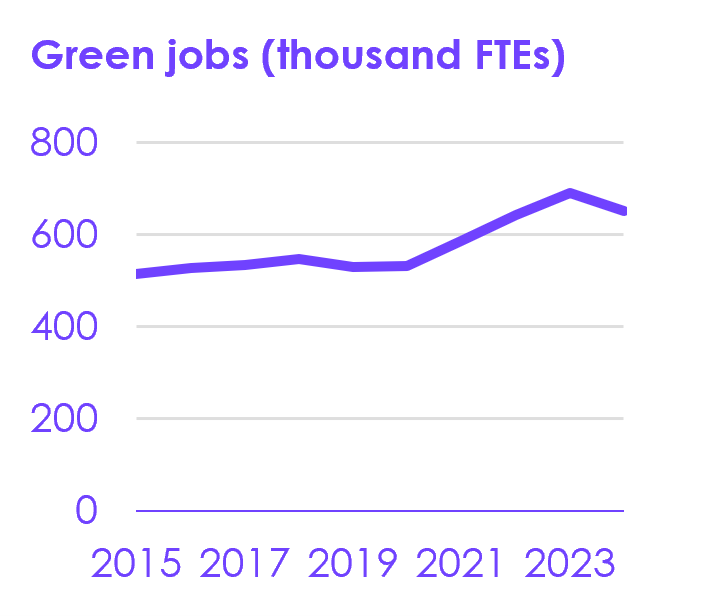 |
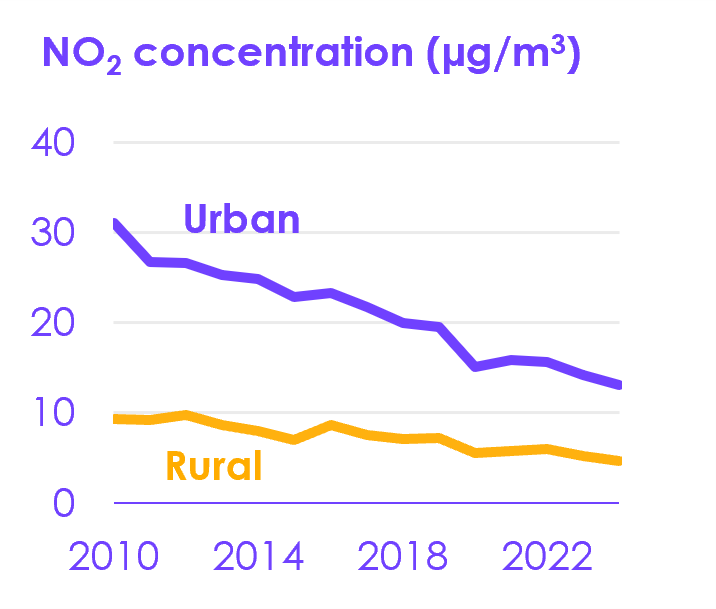 |
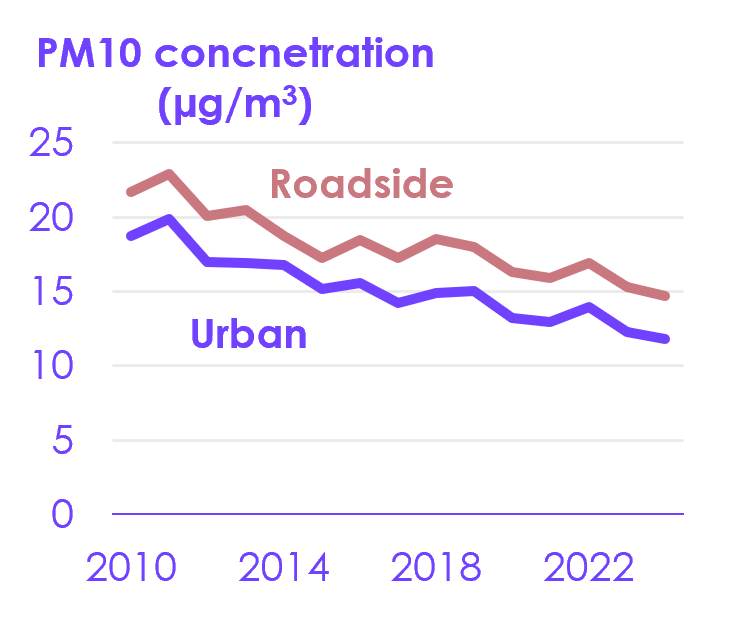 |
| Description: Air quality is improving, and the green economy is growing, despite a slight dip in green jobs in the last recorded year. Source: ONS (2026) Experimental estimates of green jobs; Defra (2025) Annual mean concentrations of NO2 in the UK, 1990 to 2024; Defra (2025) Air quality statistics in the UK, 1987 to 2024 – Particulate matter (PM10/PM2.5); Defra (2025) Accredited official statistics – Particulate matter (PM10/PM2.5). Notes: The air quality standards regulations (2010) set a legally binding mandate for PM10 annual average concentrations not exceeding 40 µg/m3 and a 24-hour limit of 50 µg/m3 not to be exceeded more than 35 times per calendar year. There are no targets for future years. |
||
| Figure 3.14 Public knowledge of Net Zero, low-carbon technologies, and concern about climate change |
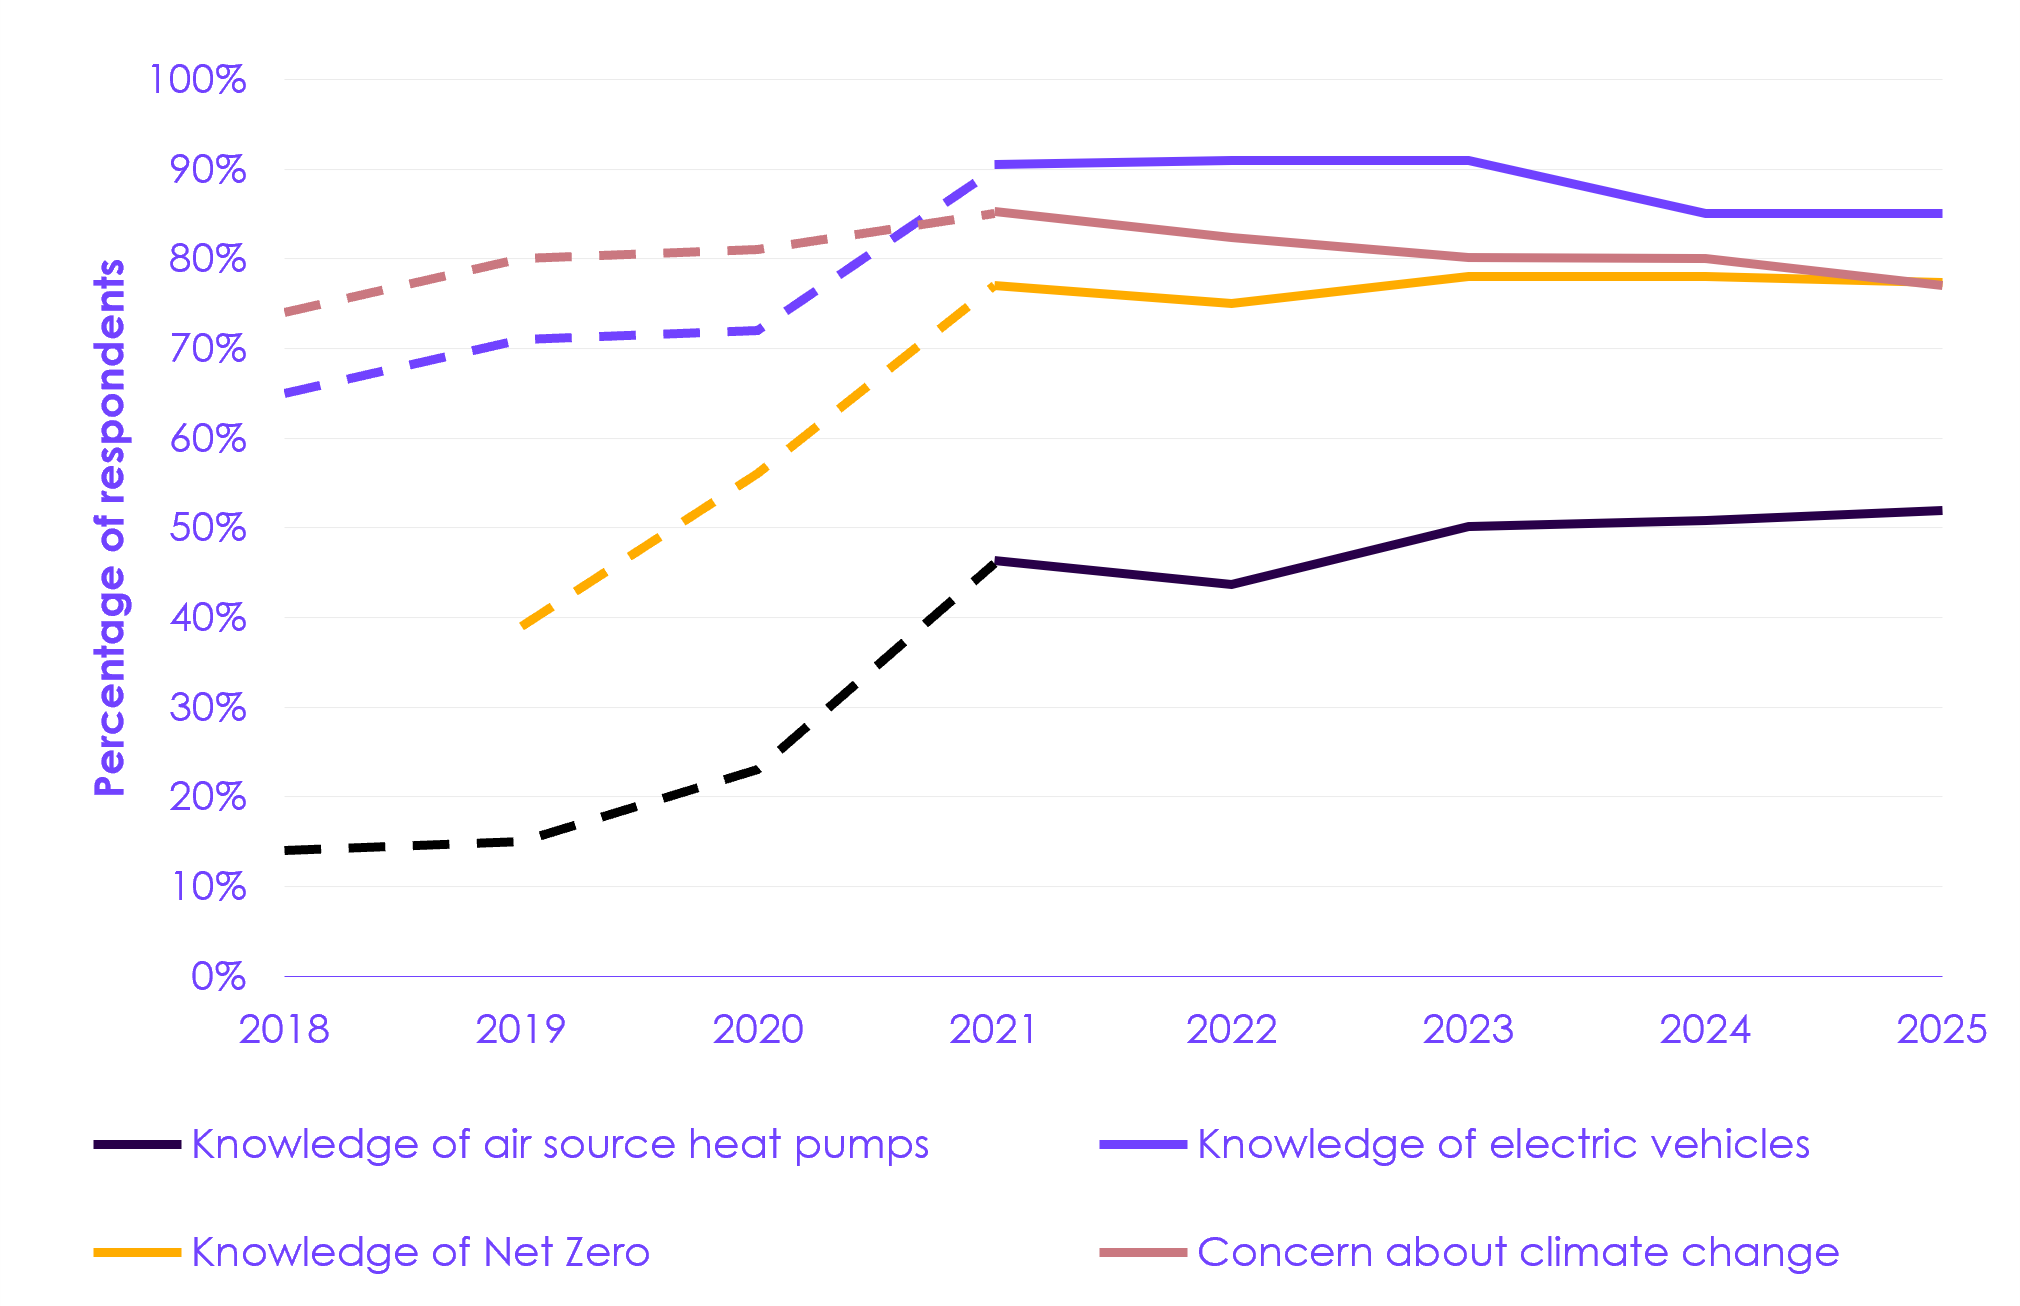 Description: Knowledge of EVs and Net Zero and concern about climate change remain high. Knowledge of heat pumps is lower but has slightly increased in the last few years. Source: DESNZ (2026) Public Attitudes Tracker; Department for Transport (2026) Transport and Technology Public Attitudes Tracker. Notes: (1) ‘Knowledge’ is defined as people indicating that they know either a lot, a fair amount, or a little about a concept or technology. It does not include responses that indicate people have heard of it (but know hardly anything about it). ‘Knowledge’ does not indicate a positive or negative attitude. (2) The Transport and Technology Tracker (which relates to knowledge of EVs) only covers England until 2023, after which it covers the whole UK. (3) Both surveys changed to being online in 2020–2021 and the difference in methodology is reflected through use of dashed lines prior to 2021. For public knowledge of heat pumps, the response options provided to survey participants changed at this point to include ‘a fair amount’ rather than only ‘a lot’ or ‘a little’. (4) ‘Concern about climate change’ is defined as people indicating that they are very concerned or fairly concerned about climate change. (5) Polling data comes with limitations in what can be inferred about people’s attitudes and views. |
Chapter 4: Assessment of policy progress
In this chapter, we assess the credibility of the Government’s plans to deliver the emissions reduction required to meet the UK’s carbon budgets and discuss progress in developing and implementing policies over the past year. This assessment considers policy developments since May 2025 up until 27 May 2026, when this assessment was completed. It reflects the decisions and actions taken by the UK Government, the Northern Ireland Executive, the Scottish Government, and the Welsh Government during this period, as well as broader market developments.
Our key messages are:
- Fourth and Fifth Carbon Budgets plans: there are credible plans associated with all of the emissions reduction required to achieve the Fourth Carbon Budget (the target for 2023 to 2027) and Fifth Carbon Budget (the target for 2028 to 2032). These carbon budgets were set before the 2050 target was updated to Net Zero, so it is important that they are over-achieved.
- 2030 Nationally Determined Contribution (NDC) plans: there are credible plans or plans with some risks attached to deliver 93 MtCO2e of the 157 MtCO2e of emissions reduction required to achieve the 2030 NDC, the first target that is aligned to the Net Zero target.
- Much of this is in surface transport, driven by the approaching price parity between electric cars and internal combustion engine (ICE) cars and underpinned by the zero-emission vehicle (ZEV) mandate. Electricity supply also has relatively few risks, driven by upcoming deployment of low-carbon generation through the Contracts for Difference (CfD) and other schemes.
- Emissions reductions associated with policies with significant risks, insufficient plans, or associated with missing policies total 64 MtCO2e. The largest area with significant risks or insufficient plans is in industry, due particularly to the lack of incentives to electrify.
- The Government’s pathway does not meet the 2030 NDC, which is set on a pathway to the Sixth Carbon Budget. This raises risks for delivery of future carbon budgets and international leadership. The Government will need to bring forward additional policies and plans to make up this gap. There are viable options in the transport, buildings and waste sectors to do so.
- Sixth Carbon Budget plans: there are credible plans or some risks associated with a similar proportion of the emissions reduction required to achieve the Sixth Carbon Budget (the target for 2033 to 2037) as those required to meet the 2030 NDC.
- The largest share of this is again in the surface transport sector, with electricity supply also contributing strongly. The largest areas with significant risks or insufficient plans are more widely spread across sectors. They include: buildings, due to the lack of robust long-term plans to scale-up heat pump deployment in existing buildings; industry, due to the lack of incentives to electrify; and engineered removals, due to the lack of policy and funding clarity.
- Priority actions: it remains urgent to look beyond the good progress in clean power and focus attention on electrification across the economy. To do this, the Government must build on recent encouraging steps to make electricity cheaper, and urgently remove barriers facing households and businesses to transition to electric technologies.
4.1 Progress against priority recommendations
In our report, Progress in reducing emissions – 2025 report to Parliament, the Committee set out a range of priority recommendations for the UK Government, the Northern Ireland Executive, the Scottish Government, and the Welsh Government. Here, we assess the progress that has been made by the UK Government, the Northern Ireland Executive, and the Welsh Government. We assessed progress on our recommendations to the Scottish Government in our annual report Progress in reducing emissions in Scotland – 2025 report to Parliament, and will assess these again in our 2026 Scotland Progress Report.
4.1.1 Overall assessment of progress against recommendations
The Committee made 43 priority recommendations to the UK Government in our 2025 progress report, including both recommended cross-cutting actions to enable effective delivery and specific changes needed to deliver decarbonisation in particular sectors. The full scores and justifications can be found in the supporting data published alongside this report.
- Among these, we assess that there has been ‘good progress’ on eight and ‘moderate progress’ on a further 13.
- There has been ‘no progress’ on four of the recommendations and ‘some but insufficient progress’ on 17, leaving gaps or shortfalls in the policy landscape which will need to be addressed to ensure the UK can get on track for its targets.
- For one recommendation, it is too early to make an assessment.
It is up to the Government to implement its chosen policies and we welcome choices which differ from our recommendations where they produce a commensurate emissions reduction. However, in many areas there has been insufficient or no progress on our recommendations, with no alternative policy action proposed in their place. With the 2030 NDC now only four years away, this leaves considerable delivery gaps which must urgently be filled if the UK is to deliver on its targets.
Progress against our top ten key actions
Based on our 43 priority recommendations in 2025, we highlighted 10 key actions for the following year. There has been important progress in some of these areas, including funding for heat pumps in existing homes, decarbonisation of new homes, low-carbon electricity, tree-planting and peatland restoration incentives, and low-carbon jobs. However, several areas have seen insufficient or no progress, including making electricity cheaper, decarbonising public sector buildings, electrifying industry, enhancing policies for aviation decarbonisation, and long-term mechanisms to deploy engineered removals. Without these being delivered urgently, we remain concerned that time could run out to achieve the emissions reduction required for the 2030 NDC.
- Make electricity cheaper. In the 2025 Budget, the Government made several changes to the policy costs added to electricity prices (see Section 3.2.3, Section 4.3.7, and Section 5.2.5). While these helped reduce the electricity-to-gas price ratio, other factors meant that overall the ratio rose between Q2 (1 April to 30 June) 2025 and Q2 2026. The UK’s electricity-to-gas price ratio remains too high for many homes to break even over the lifetime of a heat pump. Government should look to remove other policy costs and levies that artificially increase the price of electricity. (R2025-046: some but insufficient progress).
- Provide confidence and certainty to scale heat pump deployment in existing buildings. The Government’s Warm Homes Plan commits funding for heat pump installations through to 2029/30 through the Boiler Upgrade Scheme, the Warm Homes Social Housing Fund, and the Warms Homes Local Grant. Longer term it remains unclear how demand for heat pumps will be supported and installations incentivised, especially in low-income homes following the closure of the Energy Company Obligation (ECO) scheme. (R2025-059: no progress, R2025-061: no progress, R2025-062: moderate progress).
- Implement regulations to ensure that new homes are not connected to the gas grid from 2026. Revised building regulations, requiring low-carbon heating in new buildings, are being implemented in England and Wales, and are already in force in Scotland. The regulations in England and Wales come into force from March 2027, with a 12-month transition period, while Scottish building regulations approvals are valid for three years. This means that homes with fossil fuel boilers will continue to be constructed across Great Britain for several years. (R2025-060: moderate progress).
- Introduce a comprehensive programme to decarbonise public sector buildings. There is still no long-term plan to deliver decarbonisation across the entire public sector estate. The Public Sector Decarbonisation Scheme (PSDS) is ending. Although HM Treasury (HMT) will assess business cases from departments for public-private partnerships, these are expected to deliver energy efficiency or solar but not heat decarbonisation. These public-private partnerships are expected to deliver fewer emissions reductions than the PSDS. (R2025-064: no progress).
- Accelerate the electrification of industrial heat. Beyond Port Talbot, there has been limited progress on the electrification of industrial heat. The Government has announced some additional exemptions on industrial electricity costs via the British Industry Supercharger and British Industrial Competitiveness Scheme (BICS). However, while these discounts will reduce electricity costs facing industrial users, they are not likely to be enough on their own to significantly drive electrification. The Government also confirmed the end of its capital expenditure support programme, the Industrial Energy Transformation Fund (IETF). No business model or other source of targeted support for electrification has been brought forward in its place. (R2025-065: some but insufficient progress).
- Effectively deliver rapid expansion of the low-carbon electricity system. The CfD Seventh Allocation Round (AR7) delivered large volumes of offshore wind, onshore wind, and solar photovoltaic (PV) capacity. However, there remains a risk of under-delivery of offshore wind capacity in the Fifth Carbon Budget period relative to that assumed in the Carbon Budget and Growth Delivery Plan (CBGDP), unless delivery timelines can be accelerated. A broad package of recent reforms to planning regulations and the grid connections process should enable a more rapid expansion of electricity infrastructure across the UK. (R2025-071: good progress, R2025-072: good progress).
- Put policies and incentives in place to ramp up tree planting and peatland restoration. New frameworks and funding have strengthened the policy landscape, notably the publication of England’s Land Use Framework and provision of dedicated funding to 2030. Peatland restoration activity has increased, driven by actions in Scotland, reaching its highest UK reported levels to date through established grant schemes and actions to address contractor capacity. Woodland creation rates overall have fallen at the UK-level, but activity in England, Northern Ireland and Wales has increased compared to the previous year. Planting rates need to increase at pace to meet future stated ambition. Sustained, stable incentives – alongside advice, skills and access to private finance – are now needed to maintain this momentum. (R2025-068: good progress, R2025-069: moderate progress).
- Develop policy to ensure that the aviation industry takes responsibility for its emissions reaching Net Zero by 2050. The Government has re-confirmed plans to integrate engineered removals into the UK Emissions Trading Scheme (ETS), offering an avenue for the parts of the aviation sector to access these removals. It has also passed legislation to enact the sustainable aviation fuel (SAF) revenue certainty mechanism, building confidence in the SAF market. However, the decision to rely on credits from the Carbon Offsetting and Reduction Scheme for International Aviation (CORSIA) and international carbon pricing to address international aviation emissions puts the sector emissions reductions at risk. More policy is needed to ensure a strong carbon price and industry access to engineered removals for international emissions (R2025-075: some but insufficient progress).
- Finalise business models for engineered removals. The Greenhouse Gas Removals (GGR) Business Model was finalised in August 2025. This is an important milestone which allows eligible projects to enter negotiations with the Government through the carbon capture and storage (CCS) clusters programme. However, there have been no public developments on the Power Bioenergy with Carbon Capture and Storage (BECCS) Business Model since December 2023, which could account for a large proportion of engineered removals in the 2030s. (R2025-084: some but insufficient progress).
- Publish a strategy to support skills. The Clean Energy Jobs Plan is an important step for skills and jobs in the buildings and energy sectors. However, the plan does not cover other key transition sectors such as transport, agriculture and land use, and industry. There is also a need to see stronger mapping, delivery and investment on training and skills, as well as more detail on how the plan will ensure there is sufficient training capacity to provide workers with the skills required. We now need to see delivery on training and skills, with workers able to access resources and opportunities. (R2025-05: moderate progress, R2025-052: some but insufficient progress).
There are several other recommendation areas in which there has been strong progress:
- The Government has set out its proposed level for the Seventh Carbon Budget, of 535 MtCO2e, in line with our advice.[172]
- The Government has laid a statutory instrument to formally include the UK’s share of international aviation and international shipping emissions in the Sixth Carbon Budget, all subsequent carbon budgets, and the Net Zero target.[173]
- A £16 billion allocation for local transport schemes was announced in the Spending Review.[174]
- The Government published the Energising Britain public participation plan and the Local Power Plan.[175];[176]
4.1.2 Progress against priority recommendations for Northern Ireland, Scotland, and Wales
As well as our recommendations to the UK Government, we provide recommendations to the Northern Ireland Executive, the Scottish Government, and the Welsh Government.
The Committee reported on progress in reducing emissions in Scotland in our Progress in reducing emissions in Scotland – 2025 report to Parliament (published earlier in 2026) and we will be updating our assessment in our 2026 Scotland Progress Report. Therefore, we have not updated our assessment of progress against our recommendations to the Scottish Government in this report but include a summary of our previous assessment here for completeness.
- As of January 2026, the Scottish Government had made ‘good’ or ‘moderate’ progress on 10 recommendations, with three recommendations being scored as ‘some but insufficient progress’ or ‘no progress’. For the remaining five recommendations, it was too early to make an assessment.
- The Welsh Government achieved ‘good progress’ or ‘moderate progress’ on 12 recommendations, with three being scored as ‘some but insufficient progress’ or ‘no progress’, and one being ‘too early to tell’.
- The Northern Ireland Executive made ‘good’ or ‘moderate’ progress on four recommendations, with 14 recommendations being scored as ‘some but insufficient progress’ or ‘no progress’.
The scores and justifications for the recommendations can be found in the supporting data published alongside this report.
4.2 Assessment of policies and plans
4.2.1 Our approach to assessing the effectiveness of policies and plans
Factors we consider in assessing government policies and plans
In this section, we analyse progress towards and the risks to the UK achieving its emissions reduction targets. We do this by assessing the credibility of the Government’s policies and plans to deliver the emissions reductions set out in the CBGDP. See Annex 2 for more detail on our scoring criteria.
- The CBGDP lists all the policies and plans expected to contribute to meeting the UK’s Fourth (2023 to 2027), Fifth (2028 to 2032), and Sixth (2033 to 2037) Carbon Budgets, quantifying the total amount of emissions reduction that each is projected to deliver.
- These quantified policies and plans meet the Fourth, Fifth, and Sixth Carbon Budgets (see Section 2.2.1).
- The CBGDP does not include all the policies and plans required to meet the 2030 NDC, which requires a 68% reduction on 1990 levels. The CBGDP pathway reduces emissions by 65% compared to 1990 levels by 2030. The pathway almost meets the 2035 NDC (see Section 2.2.1).[177]
We focus our assessment on short and medium-term targets within the period covered by the CBGDP: the 2030 NDC and the Sixth Carbon Budget. These targets were both set in line with reaching Net Zero by 2050. Achieving them would put the UK on track to achieving its Net Zero target.
- Our scores for each quantified area are based on our assessment of the credibility of the specified amount of emissions reduction being delivered. In making judgements on this, we consider the quantified policies and proposals, other early-stage policies, wider factors, and cascade effects, all of which are included in the CBGDP pathway (see Section 2.4.2). We also consider delivery that can be expected to occur without further policy (that is, whether it is credible that a particular solution could develop without further intervention from government).
- The private sector has a proven record of innovating and delivering rapid transitions in technologies and consumer choices, provided the right conditions and incentives are in place to enable this. Many low-carbon markets are already growing quickly, both in the UK and overseas.
- In most cases, effective delivery is likely to require both government and market action. Where technology trends are not clear and robust, policy is needed to provide confidence to investors and consumers; manage risks in new markets; remove barriers to delivery; and, in some cases, provide financial incentives.
- To assess our confidence in the delivery of the emissions reductions required in these areas, we assess both the policy developments set out in Section 4.3 as well as current and projected levels of delivery (including the indicators presented in Chapter 3).
For our assessment, we have made some technical adjustments to the Government’s published baseline and pathway. We make these adjustments to ensure that we are able to robustly assess the credibility of the full range of outcomes that will need to be achieved to deliver the emissions reductions in the Government’s plan.
- The CBGDP pathway is defined as the emissions reduction expected due to the Government’s policies and proposals, other early-stage policies, wider factors, and cascade effects included in the CBGDP. This is relative to a baseline scenario, set out in the reference scenario in the Energy and Emissions Projections (EEP) 2023–2050.[178]
- The EEP reference scenario includes emissions reductions associated with policies that are already firm and funded, such as the ZEV and SAF mandates. To allow us to assess the credibility of achieving these emissions reductions, we have added the additional emissions beyond 2023 levels that these policies are expected to save to the EEP reference scenario to form the baseline for our assessment. This increases the emissions savings that are assessed for the surface transport, buildings, agriculture and land use, aviation, and F-gases sectors. There are no additional emission reductions in the EEP reference scenario beyond 2023 levels for fuel supply, waste, and engineered removals.
- In addition, we have made the following technical adjustments to include emissions reductions that are embedded in the baseline:
- Electricity supply: the EEP does not explicitly quantify the sources of emissions savings that are included in the baseline for this sector. Therefore, to allow us to include emissions reductions associated with policies in the electricity supply sector that are already firm and funded (for example, future renewables deployment with an agreed CfD), we have used the baseline defined in the Balanced Pathway developed for our advice on the UK’s Seventh Carbon Budget (2025) for this sector.
- Industry: the emissions reduction associated with the closure of the blast furnaces at Port Talbot is embedded in the EEP reference scenario. However, as the replacement with an electric arc furnace is ongoing, and represents a key development in the electrification of UK industry, we have added these emissions back into the baseline to allow them to be included in our assessment.
- Shipping: shipping emissions in the EEP reference scenario fall due to the impact of existing international policies such as the International Maritime Organisation’s (IMO) carbon intensity indicator and the EU’s FuelEU standard. To ensure that these can be included in our assessment, we adjust the shipping baseline to ensure it does not fall below 2023 levels.
- Waste: the EEP does not set out a distinct trajectory for energy from waste (EfW), which is included within its projections for the power sector. Therefore, to assess policies to reduce emissions from EfW, we have used the EfW baseline from our Seventh Carbon Budget advice.
- We have also made an adjustment to the aviation baseline and pathway to include the impact of the Department for Transport’s correction to aviation emissions in the CBGDP pathway.[179]
- In some cases, the CBGDP presents in a single policy line a level of abatement that we judge to carry different levels of risk within it. In these cases, we have split CBGDP policy lines into multiple parts, determined through sector-specific analysis and judgement.
Risk tolerance
Some degree of risk may be justifiable where policies are expected to be delivered, provided they are supported by contingency measures (see Section 2.4). However, the level of risk that is appropriate will fall as target dates approach. The Fourth Carbon Budget period ends next year and the 2030 NDC is only four years away. The appropriate balance between ‘credible plans’ and those with ‘some’ or ‘significant’ risks depends on the Government’s tolerance for, and ability to mitigate, risk.
- Where higher levels of risk are deemed acceptable by government, it becomes especially important to have deliverable contingency plans to address potential shortfalls in delivery, and sufficient monitoring processes in place to learn from experience and improve policies as quickly as possible over time. This includes more detailed indicator pathways by which to assess progress (see Chapter 3).
- As technologies mature and government and industry views coalesce around an agreed vision of how the transition will be delivered, the level of risk will typically fall. Identifying the right time to provide clarity and certainty to support market development is crucial to this, for example with clear strategic decisions like phasing out the sale of new ICE cars and vans.
Our priority recommendations set out the key actions required to address areas in which shortfalls or risks are identified (see Section 4.6 and Annex 1).
4.2.2 Upcoming policy developments
This assessment considers policy developments since completing the assessment for our 2025 progress report on 23 May 2025, up until 27 May 2026 when this assessment was completed. The Government has committed to a number of strategies and other relevant publications in the coming months. At the time of writing, these are not yet published, so cannot directly influence our assessment of progress. They include:
- Review of the Vehicle Emissions Trading Scheme (VETS) Order, including the ZEV mandate: (to be published in early 2027). The Government will evaluate elements of the design of the VETS Order to identify possible refinements to the scheme.
- Cost of public charging review: (to be published in Q3 2026). This will review the potential actions that could be taken to reduce the cost of public electric vehicle (EV) charging for consumers and businesses. It will look at the impact of energy prices including wider cost contributors.
- 25-year Farming Roadmap: (expected to be published later in 2026). This will set out the long-term direction for farming in England and be a formal response to the 2025 Farming Profitability Review.
- Trees Action Plan: (to be published in 2026). The Plan will set out how the interim 2030 tree canopy and woodland cover target for England, equivalent to a net increase of 43,000 hectares between 2022 and 2030, is to be delivered.[180]
- Consultation to extend regulations on environmental permitting to dairy and intensive beef farms: this has not yet been confirmed but is expected later in 2026. This will gather stakeholder views on which measures should be included in extended regulations.
- Industrial Decarbonisation Strategy: (to be published in 2026). The Government has committed to publishing a refreshed industrial decarbonisation strategy.[181]
- Circular Economy Strategy: (Initially expected in October 2025, this has now been delayed to 2026). The Government plans to publish a Circular Economy Strategy and series of sector-based roadmaps which will set out plans to move to a zero waste, circular economy.[182]
- Airports National Policy Statement (ANPS) review: (subject to consultation over summer 2026). The ANPS will be the framework that will guide the upcoming planning decision on expansion of Heathrow airport and will consider airport expansion in light of the UK’s climate obligations. Once the ANPS is finalised, it will be subject to parliamentary scrutiny.
- Energy Independence Bill: in the 2026 King’s Speech, the Government confirmed the Bill will cover multiple areas of energy policy, including further reform of market, planning and regulatory frameworks for generation and network infrastructure, as well as new powers to support consumer protection and energy affordability.[183]
- Updated Hydrogen Strategy: the Government has committed to publishing an updated UK Hydrogen Strategy, covering the role of hydrogen in the decarbonisation of industry and how hydrogen production, transportation and usage support mechanisms will be coordinated. The Government has also committed in the Warm Homes Plan to consulting ‘in due course’ on whether hydrogen should have any role in home heating in the future.
4.2.3 Overall cross-economy assessment
There are credible plans in place to overachieve the Fourth Carbon Budget and to deliver the Fifth Carbon Budget. However, there are greater risks associated with shares of the emissions reduction needed to deliver the 2030 NDC and Sixth Carbon Budget (Figure 4.1). Meeting these targets is essential to be on track to meet the UK’s 2050 Net Zero target.
The Fourth Carbon Budget (2023 to 2027)
Credible plans are in place to overachieve the Fourth Carbon Budget, which requires a 51% emissions reduction compared to 1990 levels (averaged over the five years of the Carbon Budget), excluding emissions from international aviation and shipping (IAS).[184] This target was set before the UK’s Net Zero target was legislated and so emissions reduction will need to go further than implied by the budget level in order to remain on track for Net Zero by 2050. It is now highly likely that the Fourth Carbon Budget will be met, with emissions in 2025 54% lower than 1990 levels, excluding IAS emissions (see Section 1.1.1).
- The CBGDP pathway outperforms the Fourth Carbon Budget, so that emissions reduction is on track to reach Net Zero by 2050. Three of the five years of the budget period have now passed, and emissions have been an average of 7 MtCO2e higher per year than the CBGDP pathway (see Section 2.2.1). This is largely due to changes in the emissions inventory which have increased estimates of emissions in these years.
- Of the emissions savings compared to the baseline required to achieve the CBGDP pathway over this period, we assess that 71% are covered by credible plans, with 88% having either credible plans or some risks attached.
The Fifth Carbon Budget (2027 to 2032)
The Fifth Carbon Budget requires a 57% emissions reduction compared to 1990 levels (averaged over the five years of the Carbon Budget), excluding IAS emissions. Our assessment of the credibility of the Government’s policies and plans for achieving it has improved compared to last year: credible plans now cover 100% of the required emissions reductions. This reflects policies that we previously assessed to have some risks which now have credible plans to deliver them, primarily in the electricity supply, industry, and surface transport sectors.
As with the Fourth Carbon Budget, the Fifth Carbon Budget will need to be overperformed to remain on track for Net Zero. So, we focus our assessment for this time period on the emissions reductions required to meet the 2030 NDC, which was set in line with a pathway to Net Zero.[185]
2030 NDC
The 2030 NDC requires a 68% reduction in emissions compared to 1990 levels, excluding IAS emissions. This requires emissions to fall to 291 MtCO2e by 2030, a reduction of 157 MtCO2e from the baseline – this goes beyond the emissions reductions set out in the CBGDP.
Credible plans or plans with some risks attached would be sufficient to reduce emissions by 93 MtCO2e to 356 MtCO2e by 2030 (equivalent to a 60% reduction on 1990 levels excluding IAS emissions). This is around an 11 MtCO2e improvement compared to our assessment last year.[186] Among these, the proportion covered by credible plans has also increased since last year’s assessment. This leaves a shortfall of 64 MtCO2e of further emissions reductions required to achieve the 2030 NDC, which we assess as being covered by plans with significant risks, insufficient plans, or which are not covered in the Government’s plan.
- Credible plans exist for 44% of the required emissions reduction for the 2030 NDC, reflecting policy areas in which funding, enablers, and clear timelines are all assessed as being in place, or areas in which observed delivery progress gives strong confidence in future outcomes.
- The majority of credible plans relate to emissions reduction from the continued roll-out of renewable electricity generation and EVs. There are also contributions from low-carbon heating in new builds and heat pump installations funded under the Boiler Upgrade Scheme, electrification of steel production at Port Talbot, and a proportion of SAF uptake covered by the SAF mandate.
- There are some risks attached to 15% of the required emissions reduction, reflecting areas in which policies are in place but may require some adjustment to mitigate delivery risk.
- Key policies and proposals with some risks include policies to decarbonise heavy goods vehicles, the delivery of additional renewable generation beyond that contracted, peatland restoration, and reducing waste in landfill. There are also some risks around the Government’s reliance on cascade effects, for example, where a household switching to an EV may be more likely to get a heat pump.
- There are significant risks attached to 19% of the required emissions reduction, where plans are either under development without a clear timeline for next steps or need further work to mitigate a significant delivery risk.
- This includes policies relating to low-carbon heating in homes beyond existing grant schemes, the decarbonisation of steel production at Scunthorpe steelworks, second- and third- generation SAF supply, and agriculture policies. It also includes the CBGDP’s reliance on wider factors relating to technological optimisation to bring down emissions.
- There are insufficient plans for 4% of the required emissions reduction. This represents areas where plans are either completely missing or assessed as currently being inadequate to give any confidence in the emissions reduction being deliverable.
- This includes low-carbon heating in public and commercial buildings, and in low-income homes following the closure of the ECO scheme. It also includes a significant proportion of the electrification of industry.
- A further 17% of the required emissions reduction is not covered by the CBGDP policies and plans. This reflects the fact that the CBGDP pathway does not achieve the 2030 NDC. The Government will need to bring forward additional policies and plans to make up this gap, for example increased ambition in the roll-out of EVs and heat pumps (see Section 4.5).
The Sixth Carbon Budget (2033 to 2037)
The Sixth Carbon Budget requires a 76% emissions reduction compared to 1990 levels (averaged over the five years of the Sixth Carbon Budget), including IAS emissions. This requires emissions to fall to an annual average of 193 MtCO2e across the five-year Sixth Carbon Budget period, a reduction of 264 MtCO2e from the baseline. Unlike for the 2030 NDC, the CBGDP pathway does achieve the Sixth Carbon Budget. But this is largely achieved through additional measures where we have assessed there to be significant risks or insufficient plans.
Our assessment of the credibility of the Government’s policies and plans for meeting the Sixth Carbon Budget has slightly improved compared to last year.[187] Credible plans and plans with only some risks would be sufficient to reduce emissions by 163 MtCO2e to 293 MtCO2e per year on average across the Sixth Carbon Budget period. This is around a 17 MtCO2e improvement compared to our assessment last year. There are significant risks or insufficient plans associated with the remaining 101 MtCO2e of required emissions reductions.
- Many of the key factors behind this assessment are similar to those detailed for the 2030 NDC above. In addition, it is to be expected that there will be greater risk in some areas, since this target period is further away. Certain key markets that will play a role are likely at an earlier stage of development.
- A key risk to achieving the Sixth Carbon Budget is the high reliance on engineered removals in the Government’s pathway. Contributions begin at low levels in the Fifth Carbon Budget and rapidly increase to reach an annual average of -17.4 MtCO2e of removals in the Sixth Carbon Budget. We assess that 94% of removals during the Sixth Carbon Budget have significant risks or insufficient plans.
- The level of risk also increases notably for the Sixth Carbon Budget period in the industry, buildings, and aviation sectors. We assess there to be insufficient plans or significant risks to deliver the majority of the emissions reductions associated with electrification in industry, the installation of low-carbon heating systems in homes, and with the use of CORSIA credits.
- An approach which accelerates electrification in sectors such as surface transport and buildings could carry less risk and reduce costs. This would speed up the deployment of established technologies and reduce reliance on sectors where solutions are yet to be proven at scale, such as engineered removals. It would result in enhanced energy security and allow households and businesses to benefit from more stable energy prices.
| Figure 4.1 Assessment of policies and plans |
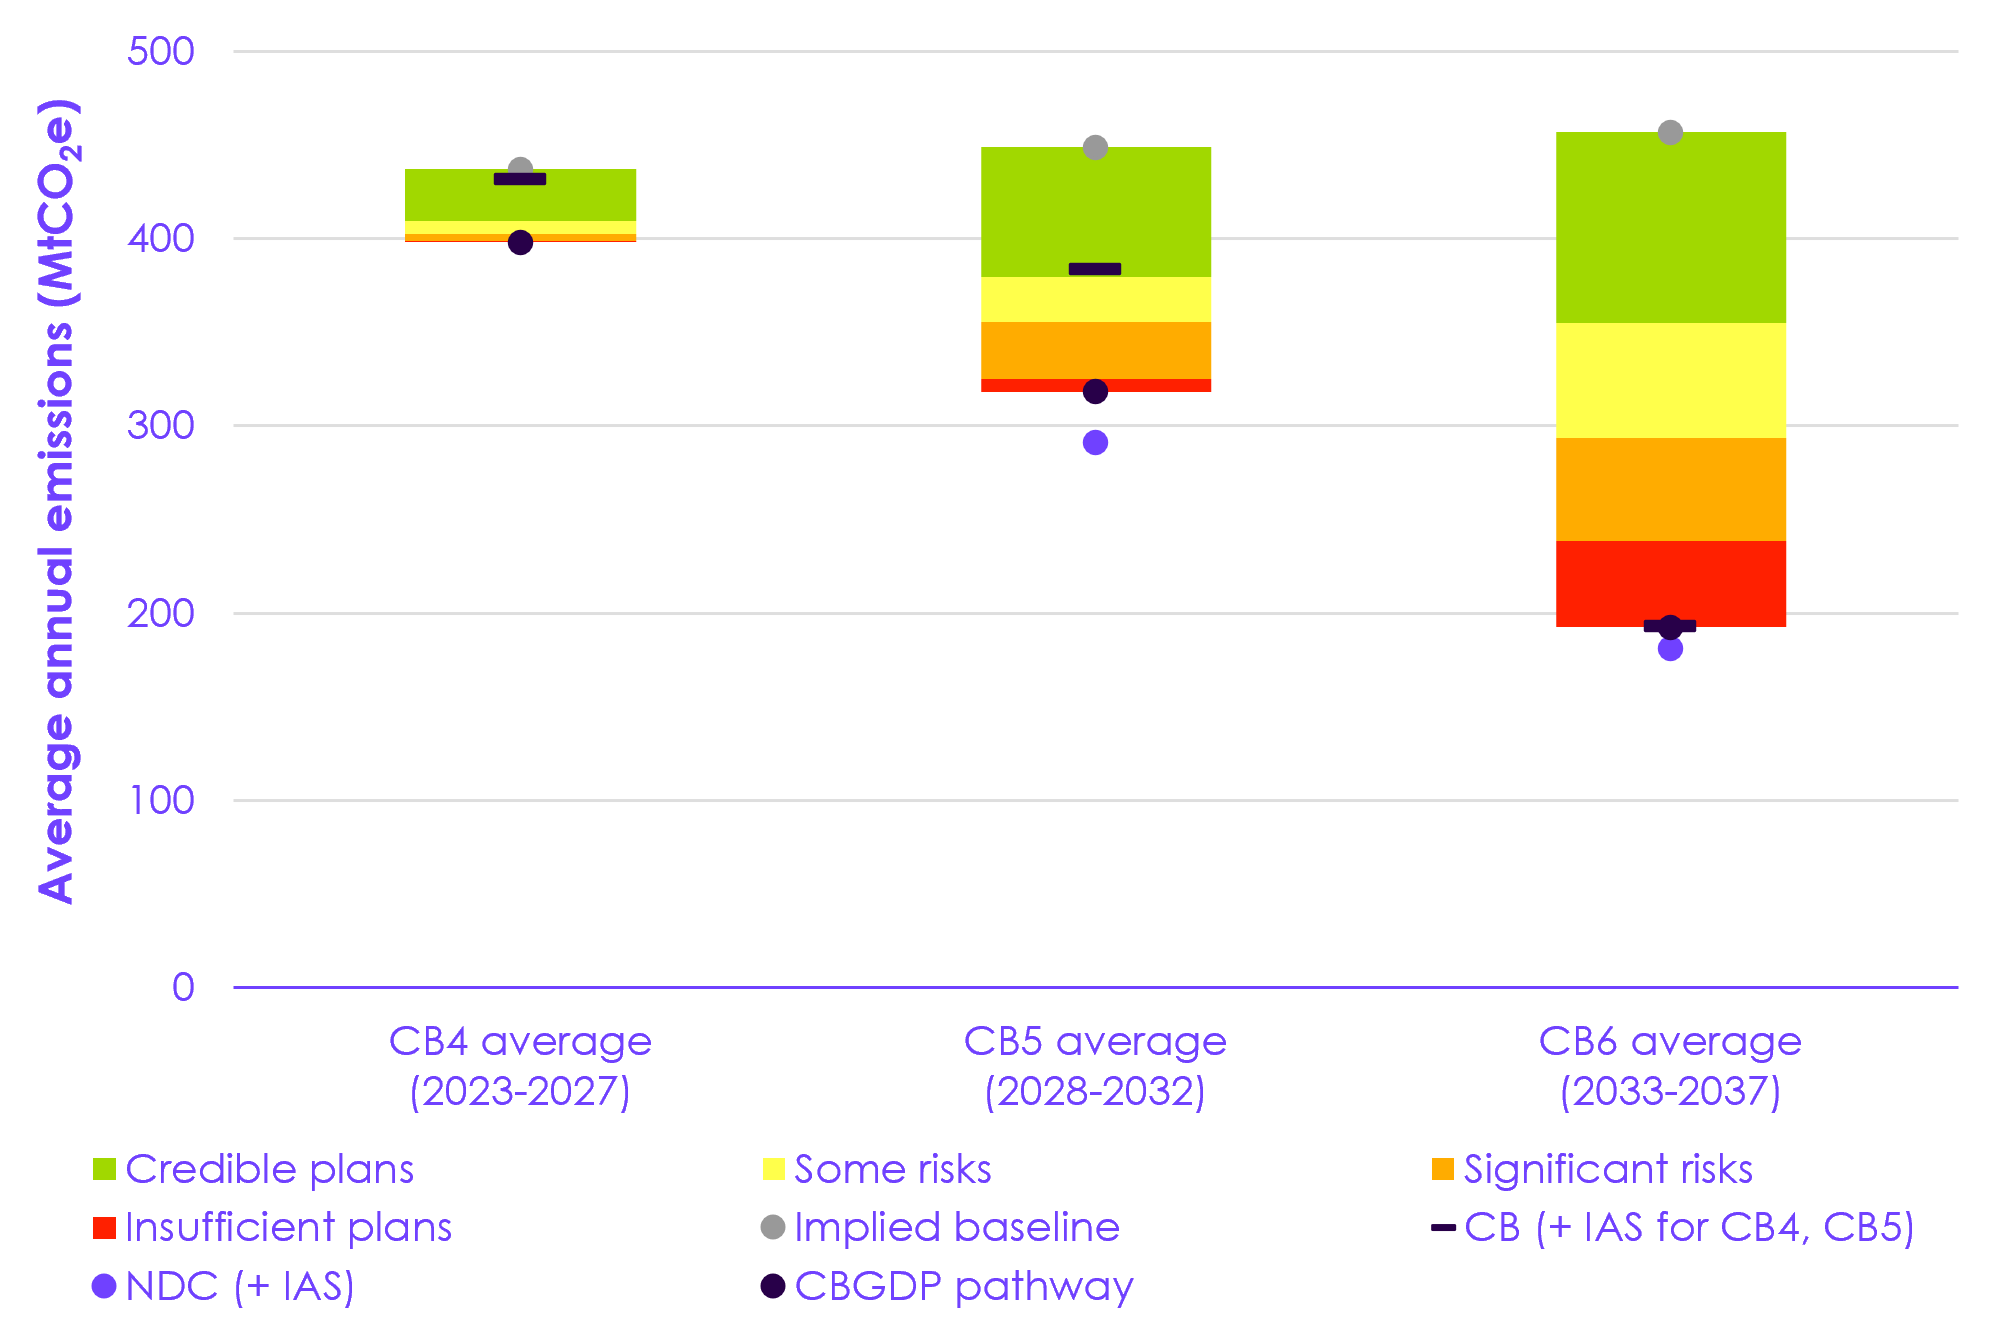 Description: Credible plans are in place to overachieve the Fourth Carbon Budget (CB4), as required to be on a sensible path to Net Zero. Plans that are either credible or have some risks attached cover around three-fifths of the emissions reductions required to meet the UK’s 2030 Nationally Determined Contribution (NDC) and the Sixth Carbon Budget (CB6). But there remain significant areas in which plans are currently insufficient or are missing. Source: DESNZ (2025) Carbon Budget and Growth Delivery Plan; Climate Change Committee (CCC) analysis. Notes: (1) This assessment uses government plans listed in Tables 3, 4, and 5 of the Carbon Budget and Growth Delivery Plan (CBGDP). See Annex 2 for the assessment criteria. (2) The baseline is an adjustment of the Government’s CBGDP baseline, with the impact of some policies removed so that they can be assessed. (3) International aviation and shipping (IAS) emissions from the CBGDP are added to CB4, CB5, and the NDCs, so that they can be displayed together with CB6 (for which IAS emissions are included in the target). (4) Emissions reductions that are associated with delivery in 2023–2025 that we assess to be proceeding as expected have been scored as green. (5) The 2035 NDC is aligned with the Sixth Carbon Budget. However, after adjustments to the latest emissions inventory, the 2035 NDC is narrowly missed. This is due to the inventory adjustments reducing the 1990 baseline against which the NDC is calculated. Before these adjustments, the CBGDP pathway meets the 2035 NDC. |
4.3 Key policy developments
This section focuses on changes to the Government’s plans since last year’s report.
- In the CBGDP, the Government now has an updated plan against which we assess policy progress compared to our last progress report. This means that the level of risk we assess to be associated with each sector’s contribution in this year’s report is not directly comparable to the level of risk in last year’s report.
- The Government committed to publishing a number of strategies in key areas for the Net Zero transition in its response to our 2025 progress report. Some of these strategies have since been published, and are included in our assessment here, for example, the Warm Homes Plan. Others are still due to be published and are therefore excluded from this policy assessment (see Section 4.2.2).
4.3.1 Policy developments across sectors
Across sectors, we have assessed policy developments over the last year, coming to judgements on the risks associated with the emissions reduction planned in each sector, for each carbon budget period (Figure 4.2).
- For the 2030 NDC, among sectors with average annual emissions reduction of 10 MtCO2e or more, the following have particularly low or high risks:
- Electricity supply has 87% of emissions reduction covered by policies with credible plans or some risks, driven by upcoming deployment of low-carbon generation through the CfD and other schemes.
- Surface transport has 84% of emissions reduction covered by policies with credible plans or some risks, driven by the growing EV market and falling prices, underpinned by reducing costs in global supply chains, increasing competition, and the ZEV mandate.
- Industry has 56% of emissions reduction covered by policies with significant risks or insufficient plans, particularly due to the lack of incentives to electrify.
- For the Sixth Carbon Budget, among sectors with average annual emissions reduction of 10 MtCO2e or more, the following have particularly low or high risks:
- Electricity supply and surface transport have 95% and 91% of emissions reduction covered by policies with credible plans or some risks respectively.
- Industry and engineered removals have 73% and 94% of emissions reduction covered by policies with significant risks or insufficient plans respectively.
In the following sections, we discuss developments in each sector and their implications for our assessment of the Government’s plans. Where possible, we reference changes in our assessment compared to last year, but given the updates to the Government’s pathway, this assessment does not reflect a direct comparison.
| Figure 4.2 Assessment of policies and plans for key sectors |
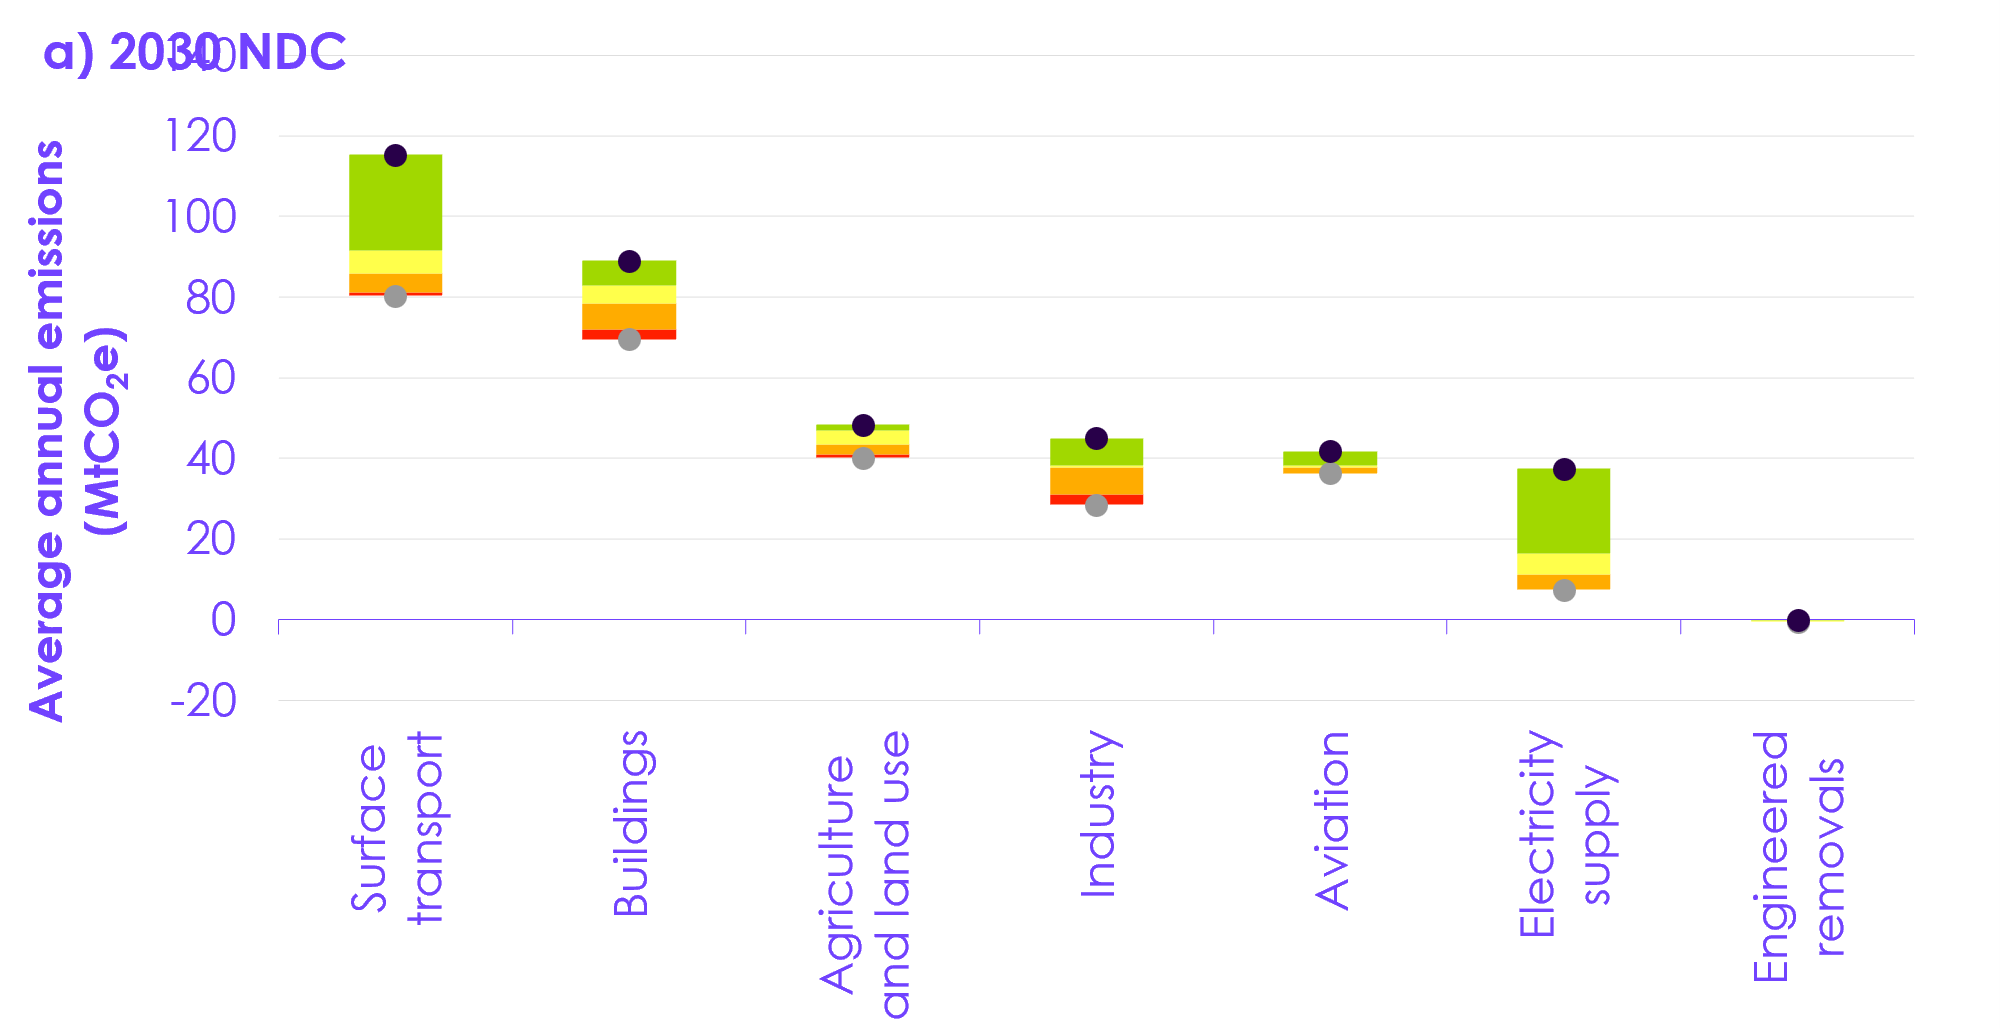 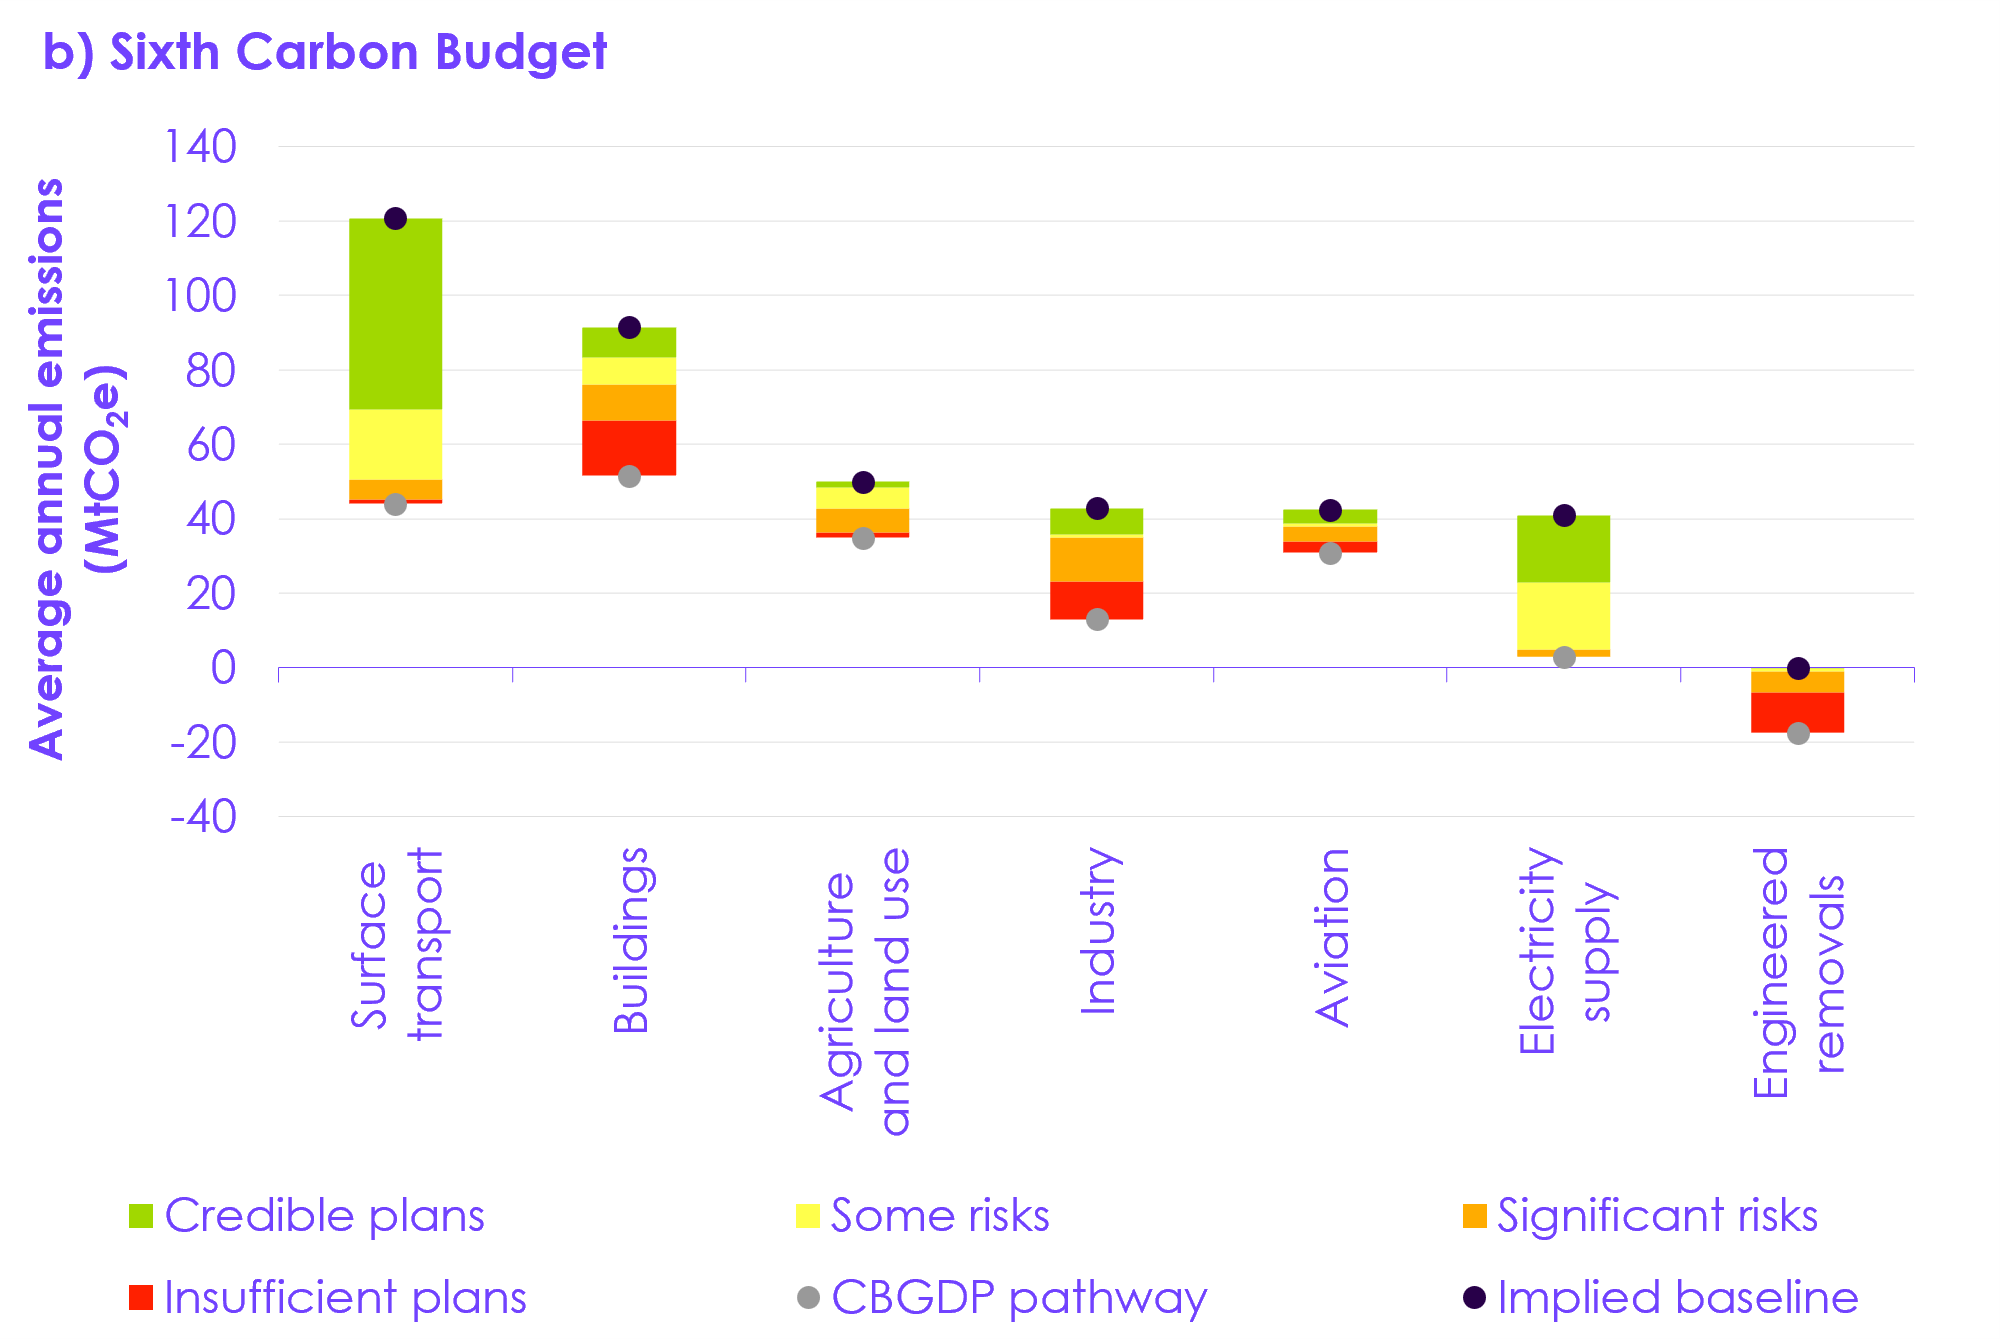 Description: For the 2030 Nationally Determined Contribution (NDC), surface transport and electricity supply have the highest share of emissions reductions covered by credible plans or plans with some risks; industry has the largest share of emissions reductions with higher risks. For the Sixth Carbon Budget, the picture is similar, but with buildings and engineered removals also carrying a significant share of emissions reductions with higher risks. Source: DESNZ (2025) Carbon Budget and Growth Delivery Plan; CCC analysis. Notes: (1) This assessment uses government plans listed in Tables 3, 4, and 5 of the Carbon Budget and Growth Delivery Plan (CBGDP). See Annex 2 for the assessment criteria. (2) The baseline is an adjustment of the Government’s CBGDP baseline, with the impact of some policies removed so that they can be assessed. (3) We include wider factors and cascade effects in our assessment based on an assumed split of the abatement set out in the CBGDP among the sectors in which they are expected to be able to deliver emissions reduction. The largest share of this abatement is within the surface transport and buildings sectors. |
4.3.2 Surface transport
Compared to our 2025 assessment, we have greater confidence in delivery of the Government’s chosen pathway for surface transport. This is mainly due to continued growth in the EV market and falling prices, enabled by effective policies such as the ZEV mandate which give growing confidence in the roll-out of EVs. There are risks associated with policies enabling greater uptake of plug-in hybrid electric vehicles (PHEVs) at the expense of EVs, and with the roll-out of electric vans, which is falling behind but still has opportunities to catch-up provided key barriers are addressed. There are also opportunities for the growth in the EV market to go faster than the Government’s pathway.
Cars
- Zero-emission vehicle mandate: with surface transport currently the UK’s highest emitting sector, the ZEV mandate is one of the most significant policies for delivering the UK’s climate goals. It plays a key role in underpinning and reinforcing market developments towards large-scale uptake of EVs and enabling investment in supporting infrastructure.
- Despite some weakening of incentives in 2025, it continues to be effective in driving investment and increasing the choice and affordability of electric cars on the market. It is essential that this year’s review of the mandate does not lead to further concessions on incentives for EVs. Doing so would severely undermine prospects of meeting the UK’s 2030 NDC as well as reducing the savings that households can make from switching to an electric car (see Section 5.2.3).
- Moreover, accelerating electric car uptake in line with our Balanced Pathway would significantly reduce the risk of missing the UK’s 2030 NDC (see Section 4.5), but achieving this requires maintaining clear, consistent, and ambitious policies.
- Electric Car Grant (ECG) and measures which strengthen incentives for electric vehicles: the ECG, announced in July 2025, provides a discount for certain new electric cars, with grants of £1,500 and £3,750 available for qualifying car models under £37,000. 10 models qualify for the full grant and 45 for the lower grant as of April 2026, with interest in grant-eligible models more than doubling after the announcement.[188];[189] The extension of the grant to the end of this Parliament will provide support until the phase-out of new petrol and diesel cars in 2030.
- The ‘Get That Electric Feeling’ campaign, launched in January 2026, is a welcome initiative to give the public accurate information on the benefits of EVs. This is particularly important as consumer perceptions can lag behind market reality – with drivers often still viewing EVs as more expensive options when in fact they can save many households money (see Section 5.2.3).[190]
- The £40,000 expensive car supplement threshold for EVs rose to £50,000 in April 2026, while remaining unchanged for PHEVs and ICEs. This increases the number of electric models that will be exempt from the £440 annual charge.
- Electric vehicle excise duty (eVED) and measures which dilute incentives for electric vehicles: the Government announced a new three pence per mile tax on EVs (1.5 pence per mile for PHEVs) effective from April 2028. The new tax is intended to replace declining fuel duty receipts as EVs become more popular. However, the timing of the decision risks confusing market signals for EVs before they have gained primacy in the market.
- The cost per mile of eVED will be roughly half the average per mile cost of fuel duty. This means that most households who own an EV and can charge at home will still save money relative to ICE drivers (see Section 5.2.3). It is reasonable for the Government to replace declining fuel duty revenues and for EV drivers to pay their fair share for the upkeep of roads. However, eVED potentially introduces an additional administrative burden and confuses signals to consumers on the benefits of EV ownership.
- The decision to waive additional benefit-in-kind liabilities of PHEV company cars, which would have been owed as a result of updated, more accurate emissions ratings, will risk increased PHEV sales at the expense of EVs.[191] This compounds a decision last year to allow manufacturers to count PHEV sales towards compliance with the ZEV mandate using the older, inaccurate emissions ratings.[192] Providing incentives for emissions savings that PHEVs do not deliver distorts the market (see Section 3.2.2).[193]
Vans and HGVs
- Vans: alongside the ZEV mandate, the plug-in-van grant is the other key measure to support adoption of electric vans. The latter has been extended to 2027 but with adoption rates lagging behind where they need to be, additional support may be needed (see Section 3.2.2).[194] While developments in technology are helping to overcome barriers to van ownership, such as charging downtime and payload constraints, further action is needed to ensure electric van sales catch up with the ZEV mandate. This means delivering regulatory reforms and increasing access to depot charging.[195]
- Several commercial vehicle regulations, including driver rest and license requirements, vehicle testing, and tachograph requirements, are set based on the weight of a vehicle. The extra weight of the battery can bring electric vans into scope of stricter requirements than diesel vans even where operationally equivalent.
- In November 2025, the Government consulted on proposals to address some of these regulatory barriers, based on uplifting the weight threshold for EVs to fall into the scope of such regulations, rising from 3.5 tonnes to 4.25 tonnes.[196] The proposed regulatory changes are awaiting legislative implementation.
- Buses, coaches, and heavy goods vehicles: several promising developments to support larger EVs include a consultation on heavy goods vehicle (HGV) CO2 regulations, confirmation of phase-out dates for new ICE HGVs by 2040, and an £18 million uplift and extension to the plug-in-truck grant. The regulatory framework for decarbonising HGVs should include explicit requirements for zero-emission models to drive investment into these technologies.
Charging
- Public charging costs: while public charge point deployment is on track (see Section 3.2.2), public charging costs are still high and remain a key barrier to EV adoption, particularly for those without off-street charging. The Government is starting to take steps to address this. A decision to grant Charge Point Operators (CPOs) in England and Scotland relief from business rates until 2035, worth an estimated £200m in the first five years, is a significant boost.[197] A planned review into the cost of public charging should consider VAT and standing charge arrangements for public charging.
- Evidence from CPOs points to recent changes which have increased fixed costs for public chargers, which can make up around 25% of the cost to drivers.[198] While energy infrastructure needs to be paid for, the Government’s review should consider reforms and relief to fixed charges so that they do not undermine incentives for EV adoption in the short term.[199]
- The Government could also consider reducing the rate of VAT paid on public charging (20%) to bring it more in line with the rate paid by domestic electricity users (5%). In February 2026, a tribunal ruled that VAT on public EV charging costs should be at the reduced rate of 5%. However, HMRC is appealing against the decision.[200]
- Avoiding a further weakening of the ZEV mandate is also key to supporting EV uptake, which helps to further spread the cost of fixed charges, and for maintaining investor confidence in the business case for public charging projects.[201];[202]
- Enabling access to cheaper off-street charging: several initiatives to improve access to cheaper on-street charging will enable more households to access cheaper electricity tariffs in England. Welcome proposals for permitted development rights to remove planning requirements for installing cross-pavement channel charging should be quickly enacted. Action to unblock the deployment of funds from the Local Electric Vehicle Infrastructure scheme is urgently needed to increase the number of on-street chargers.[203]
- Depot charging: the Depot Charging Scheme for vans, HGVs, and coaches provides £170 million in funding to support up to 70% of the cost of installing charging infrastructure at commercial depots (up to £1 million).
Public transport and active travel
- Funding for public transport and active travel: the 2025 Spending Review allocated £16 billion to Transport for City Regions in England up to 2031/32. It also allocated more than £1 billion per year to reduce fares, increase route frequency and improve infrastructure via the Local Authority Bus Grant from 2026 to 2029. The 2026 Budget confirmed that the bus fare cap in England would be extended to March 2027. English Councils have been awarded £600 million in active travel funding while a consultation to inform the Third Walking and Cycling Strategy closed in late 2025.
- Reforms to improve public transport services: the Bus Services Act (2025) requires bus operators to phase-out non-ZEV buses from local routes by 2030 and provides powers to local authorities to take greater control of bus services.[204] The English Devolution and Community Empowerment Bill intends to increase transport powers for combined authorities and regional mayors.[205]
4.3.3 Buildings
There has been mixed progress in the buildings sector compared to our 2025 assessment. Over half of the Government’s short-term plans are assessed as credible or with some risks. Emissions reductions after 2030 are assessed as having a larger share – around 60% – of significant risks and insufficient plans.
Policies requiring low-carbon heating in new buildings are now finalised across most of the UK, providing a clear path to decarbonising new buildings. However, the Government has reduced the number of heat pumps assumed to be installed in the CBGDP compared to the previous government’s plan. The policies in the Warm Homes Plan should reduce household bills and emissions, but carry some risks, particularly in low-income households following the end of the ECO. In non-residential buildings, the end of funding for the PSDS leaves a significant gap in policy for decarbonising the public sector. Measures to drive the decarbonisation of non-residential buildings have not been prioritised. In the long term it is unclear how decarbonisation of buildings will reach the pace required.
New buildings
- Building regulations: revised regulations requiring low-carbon heating in new buildings will be implemented in England and Wales next year and are already in force in Scotland.
- The regulations in England and Wales will come into force from March 2027, with a
12-month transition period. Applications made before the new regulations come into force and commenced within the transition period can be constructed to the old standards, meaning buildings with fossil fuel boilers will continue to be constructed for several years after the regulations come into force. - There is scope in future for more stringent energy efficiency standards and use of flexibility in new buildings, particularly homes. This would reduce household energy bills and the impact of new buildings on electricity demand.
- The regulations in England and Wales will come into force from March 2027, with a
Existing homes
- Low-carbon heating: the Warm Homes Plan aims for 450,000 heat pumps to be installed per year in the UK by 2030, of which around 250,000 would be retrofit.[206] Installation rates will need to be higher than this to deliver the emissions reductions in the CBGDP.[207]
- The retrofit goal in the Warm Homes Plan is achievable but will require annual growth of 37%. Growth last year was only 7% (see Section 3.2.3).
- Retrofit installations are currently reliant on government subsidies. It is not clear whether the Government’s schemes for low-income households will be able to deliver the additional heat pump installations required. The ECO scheme – which has delivered one-third of retrofit installations in the last three years – has been closed without a clear plan for replacing these installations.
- The 2030 goal for heat pump installations is well below the level that had been assumed in the previous government’s plan, and the expected retrofit installations are around half the level proposed in our Balanced Pathway. Low-carbon heating uptake in our Balanced Pathway is consistent with all new and replacement heating systems being low carbon by 2035, and with zero emissions in 2050. Accelerating uptake in line with this would reduce the risk of missing the UK’s 2030 NDC (see Section 4.5).
- Meeting the Government’s 2030 goal and longer-term aims requires putting in place adequate policies to develop the heat pump market and reduce installation costs (see Box 4.1).
Box 4.1
Creating the market conditions for scaling heat pump deployment
Deploying heat pumps in existing homes is critical to decarbonising buildings. Retrofit heat pump installation rates need to reach around 1.4 million per year in 2035, to eliminate emissions from homes by 2050, while avoiding unnecessary scrappage of boilers.
Capital costs are a major barrier to heat pump adoption, and non-financial barriers currently make it more challenging to install a heat pump than a gas boiler. The Warm Homes Plan includes measures to improve the consumer journey by reducing installation times, providing better information and advice, improving consumer protection, and reducing planning constraints. However, barriers to uptake remain.
To meet the Government’s 2030 goal and longer-term aims, it is essential that adequate policies are in place to develop the heat pump market, reduce installation costs, and make it easier to install a heat pump. Priorities include:
- Increasing the number of installers and improving installer knowledge of heat pumps. Whilst the number of qualified heat pump installers has grown over time, there are still less than 30,000 qualified installers across the UK, compared to over 130,000 gas-safe engineers. For the heat pump market to grow at the pace required, there needs to be rapid training of heat pump installers.
- Removing other non-financial barriers. We welcome the Warm Homes Plan’s focus on improving advice and information and removing planning barriers for consumers. The Government should continue to implement policy and amend existing policy such as noise limits for heat pumps, to ensure that installing a heat pump is as easy as possible.
- Reducing installation costs. Government grants and low-interest loans will overcome the cost barrier for some households (see Section 5.2.4). However, costs remain an obstacle, and the Government has only committed to funding grants until 2030. To meet the Government’s 2030 target and longer-term aims, it is essential that adequate policies are in place to reduce installation costs.
- The Warm Homes Plan sets an intention to challenge industry to find new ways to bring down costs. There is scope for innovation that better enables competition. For example, heat loss calculations and heating system designs are usually produced by installers, and sometimes paid for by customers in order to obtain a quotation. This is inefficient and could disincentivise competition. Policies could be developed to help consumers to obtain system designs at low cost before approaching installers for prices.
Moving towards large scale delivery. The Government needs to ensure that its policies provide clarity and confidence to enable the market for low-carbon heating to scale up to deliver all replacement heating installations by 2035. Government policy should support the adoption of heat pumps at scale, and provide appropriate signals to allow the heat pump market to develop. The Government has highlighted a role for area-based delivery in the Warm Homes Plan, which could overcome some of these barriers and enable economies of scale. However, policies that extend beyond 2030 will be needed to provide stronger market signals for the heat pump sector, to meet future carbon budgets and Net Zero.
- Energy efficiency: increased Minimum Energy Efficiency Standards (MEES) are expected to deliver energy efficiency improvements to a large number of homes. This will help to reduce household energy bills and enable heat pump installations. However, the resulting emissions reductions are small.
- The Government is planning legislation requiring private rented properties to meet a minimum rating of C against two Energy Performance Certificate (EPC) metrics by 2030.[208];[209] The plans are expected to result in energy efficiency improvements to 1.8 million homes.[210]
- The Government is planning legislation requiring social rented properties to meet a minimum rating of C against any one EPC metric by 2030, and against two metrics by 2039.[211] The plans are expected to lead to energy efficiency improvements to 1.1 million homes by 2030, and 2.9 million homes by 2039.[212]
- Microgeneration and flexibility: installations of solar PV and battery storage are being incentivised as a means of reducing household electricity consumption and energy bills.
- The Government expects measures in the Warm Homes Plan to treble the number of homes with rooftop solar by 2030. Domestic solar PV and battery storage will be supported by funding schemes for low-income households and through low-cost consumer loans for homeowners. The proposed private and social rented MEES are also intended to incentivise these measures.
- The Clean Flexibility Roadmap sets out welcome government plans to increase consumer-led flexibility, including the use of time-of-use tariffs.[213]
Measures to support consumer awareness of potential savings of time-of-use tariffs could drive further uptake, including through information campaigns and improving transparency from Ofgem and suppliers on the benefits of alternative tariffs.
Our analysis suggests that with current grant support and a standard tariff, many households will not make a saving over the lifetime of a heat pump (see Chapter 5). Use of a heat pump in combination with domestic solar and time-of-use tariffs can improve the financial case, but not all households are able to use these.
- Funding: the Warm Homes Plan sets out funding commitments for decarbonising homes to 2029/30.
- The Government has committed funding of £1 billion per year to support upgrading the homes of low-income households. This is intended to fund solar PV, batteries, energy efficiency, and heat pumps. With the closure of ECO, this level of funding represents a substantial drop in expenditure on low-income households.
- The Government has allocated £2 billion of funding to support low and zero-interest consumer loans, to assist households with the costs of PV, batteries, and heat pumps.
Non-residential buildings
- Public sector funding: a greater share of non-residential buildings emissions reduction has insufficient plans for the Sixth Carbon Budget than in our previous assessment, due to the end of funding for the PSDS in England.[214] This represents a loss of almost 5 MtCO2e average annual abatement over the Sixth Carbon Budget period and 2.4 MtCO2e in 2030. Making up this lost abatement offers an opportunity to help close the gap to the 2030 NDC (see Section 4.5).
- HMT is assessing business cases from government departments for public-private partnerships.[215] These are expected to focus more on energy efficiency and solar installations, which have shorter payback periods, rather than heat decarbonisation.
- Funding schemes for public sector decarbonisation in Scotland and Wales continue as planned, although delivery of the schemes will be affected by the closure of Salix who currently manage funding schemes across UK nations and provide advice and support to recipients. This role is intended to be brought into the new Warm Homes Agency.[216]
- The Public Sector Low Carbon Skills Fund, which provided grants for public sector organisations to engage the expert advice and skills required to develop a heat decarbonisation plan, is no longer being funded.
- Low-carbon heating: there has been no action to address the electricity-to-gas price ratio for non-residential users, which limits the incentives for commercial and public sector organisations to switch to low-carbon heating.
- Energy efficiency: there continues to be a need for further policy on non-residential energy efficiency. Tightening of the private rented sector MEES in England and Wales continues to be delayed and has yet to be confirmed. The Government first consulted on raising the minimum standard from EPC E to EPC B by 2030 in 2019.[217] There also remains a gap in encouraging owner occupiers to improve the energy efficiency of their buildings.
- Microgeneration and flexibility: Great British Energy is investing in solar and batteries for schools, National Health Service (NHS) sites, and military sites, aiming to reduce energy bills for public sector organisations.
Heat networks
- Increasing heat network uptake: the Government has a target of doubling the amount of heat met via heat networks to 7% by 2035 and expects them to provide one-fifth of all heat by 2050, mainly concentrated in towns and cities.
- The WHP commits further capital support of £195 million per year to 2030 for the expansion of low-carbon heat networks through the Green Heat Network Fund and signals the intention to mobilise more private capital through the National Wealth Fund.
- A new heat network zoning authority (the Warm Homes Agency) will collate and publish a national pipeline of heat network zoning opportunities (geographic zones where heat networks are projected to be the best solution). Local Zone Coordination Bodies will oversee local designation and delivery. The Government’s aim is to designate at least ten of the biggest heat network zones in 2026.
Enabling measures
The Government is implementing a range of enabling measures to support the decarbonisation of buildings. These include: establishing the Warm Homes Agency, supporting area-based delivery, improving advice for households, and reforming metrics used on domestic EPCs.
4.3.4 Agriculture and land use
Compared to our 2025 assessment, we have increased confidence in delivery of the Government’s chosen pathway for agriculture and land use. This reflects policy progress by the UK Government, Scottish Government, Welsh Government, and Northern Ireland Executive in setting out frameworks for future support and incentive schemes, necessary for farmers to diversify their operations. But risks remain in many areas, with all agricultural policies assessed to have at least some or significant risk, and some emerging technologies without clear roll-out plans assessed to have insufficient plans. Good progress has been made in encouraging agricultural research and innovation, but this is yet to translate into delivery. Land use actions such as peatland restoration are starting to gain momentum. In March 2026, the UK Government published the Land Use Framework (LUF), setting out a vision for multifunctional land use in England for the next 25 years. Stability and clarity in policy is now necessary to support farmers, foresters, and land managers to engage at scale (see Box 4.2).
Agriculture
There has been further development in the replacement of legacy Common Agricultural Policy (CAP) with all regions of the UK now having in place future agri-environment schemes. Going forward, the adoption of low-emissions farming actions will require stable, long-term support through funding, regulation, and policy certainty to reduce emissions across the sector.
- Farming in England: the Sustainable Farming Incentive (SFI), part of the Environmental Land Management scheme, is to be reopened in June 2026 following a one-year pause in funding. Payments will support a range of low-emissions farming actions. The emissions reduction associated with these policies has largely been assessed to carry some risks.
- Around 4,000 farming businesses, largely in the uplands, are currently excluded from the SFI and the Countryside Stewardship Higher Tier due to software limitations in processing applications.
- The delayed 25-year Farming Roadmap setting out the long-term direction for farming in England is due to be published in 2026.[218] Its aim is to maintain food production, deliver environmental outcomes, and ensure profitability in the sector.
- The Government has re-launched competitive funding to encourage farming innovation and uptake of agricultural technologies. These are key to reducing farming emissions. Abatement in this area carries risks, with some early technologies still at the research and development stage. Those without supporting policy for rollout are assessed as having insufficient plans or carrying significant risks.
- Emissions from livestock: in October 2025, the Government published its UK methane action plan where it reiterated its commitment to mandate the use of proven safe and effective methane suppressing feed products (MSFPs).[219] Northern Ireland and Wales have yet to implement farm-level policy to support their roll-out. Using feed additives that inhibit methane in cattle is a key measure to reduce emissions from livestock. We assess MSFP rollout as carrying some risks.
- The Government is planning to consult on extending regulations on environmental permitting to dairy and intensive beef farms, which could require the uptake of measures that reduce pollutants and benefit GHG reduction.[220] Regulations are not expected to be in place until 2032/33 at the earliest.
- Livestock numbers are not addressed in the CBGDP. Reductions in livestock numbers are needed to go further in reducing emissions from agriculture, and to release land to sequester carbon and reduce emissions from degraded soils and habitats. To deliver this, people will need support to make alternative dietary choices to meat and dairy, and farmers will require support to diversify their businesses.
- National farming policy: Scotland, Wales, and Northern Ireland have launched post-CAP support schemes. We assess the emissions reduction associated with these policies as carrying some or significant risks.
- Scotland: Scotland’s Rural Support Plan (2026 to 2031), launched in March 2026, sets out a four-tier funding structure, with 70% of this delivered through direct payments.[221] Funding is heavily weighted towards the lower baseline tiers, while funding for low emissions practices is not expected to increase significantly until the end of this decade. The remaining 30% of funding is allocated to additional actions on climate and nature, and research and innovation.
- Wales: the baseline payment under the universal layer of the Sustainable Farming Scheme, launched in January 2026, requires farmers to take up some actions which reduce emissions. Additional optional layers, which have wider climate benefits through actions on sustainable production, soil health, enhanced habitat management, and improvements to air and water quality, will open for applications later in 2026.[222]
- Northern Ireland: the Sustainable Agriculture Programme has renewed several of its policy support measures. For the first time, receipt of Farm Sustainability Payments requires compliance to seven new Farm Sustainability Standards (started January 2026), to reduce pollution, protect soils, and improve animal welfare.[223] The Programme does not explicitly set out how the standards could reduce emissions.
Land use
Across the UK, woodland creation and peatland restoration are showing progress with increasing annual rates of activity. While this is positive, further support in advice, skills and accessing finance will be needed if annual rates are to reach the ambition set out by Defra, the Scottish Government, the Welsh Government, and the Northern Ireland Executive.
- Land use change: the Nature for Climate Fund (NCF) Programme (England) has been assessed to have not met its overall tree planting and peat restoration targets over 2020 to 2025. However, due to the associated development of sector capacity, skills, and clear guidance, it has facilitated a step change in delivery rates, representing high value for money.[224] The 2025 Spending Review has allocated £816 million and £85 million for woodland establishment and peatland restoration respectively for England through to 2030.
- Peatland restoration and management: restoration of peatlands has increased to reach the highest reported rate to date (see section 3.2.4). In the near-term, we assess peatland abatement policies to carry a mix of credible plans and some risks. All UK nations currently have grant support in place until at least 2027.
- The UK Government committed to restoring 40,000 hectares of peatland in England before 2030, in the Environmental Improvement Plan.[225] In England, the area protected from burning management has tripled, which will support resilience, habitat restoration outcomes, and other benefits such as air quality.
- In 2025, Nature Scot updated its peatland partnership plan to reflect restoration delivery through to 2030, the Welsh Government launched its 2025 to 2030 National Peatland Action Plan, whilst Northern Ireland established its first Peatland Strategy.[226];[227];[228] In England, there will not be a dedicated strategy. Instead, the Land Use Framework and Environmental Improvement Plan will be the strategic overview for peatland action.
- Despite commitments made by the UK, Scottish, and Welsh Governments to ban the sale of horticultural peat, this has yet to progress into legislation. We have assessed this to have insufficient plans.
- Woodland creation: woodland planting fell by 25% in 2024/25 compared to 2023/24, which recorded the highest rates since 1990. Scotland continues to lead in the establishment of new woodlands in the UK (see Section 3.2.4). We assess most of the abatement assigned to woodland and forestry actions as facing some risks, however this will depend on scaling up rates of new planting at pace to support future emission targets.
- Woodland creation rates have increased elsewhere in the UK, significantly in England where clear grant support and simplified application processes have supported engagement. Defra’s Tree Action Plan ended in 2024, but a new plan setting out the approach for woodland creation in England is expected in 2026.
- The Welsh Government has set an ambition for 17,000 hectares of new woodland to be established under the Sustainable Farming Scheme by 2030, supported by opportunity mapping and grant support. With 840 hectares planted in 2024/25, planting rates will have to increase significantly if this is to be reached.
- Energy crops: there are currently no policies in place in the CBGDP to support the upscaling of domestically grown perennial energy crops in England, and policy in Scotland and Northern Ireland is also lacking. The Welsh Government has made capital grants available under the Agricultural Diversification Scheme which can be used to facilitate new production approaches, including crops such as miscanthus.
- Agroforestry: despite the opportunity for agroforestry to support on-farm carbon sequestration alongside ongoing agricultural production, and the availability of grant funding, uptake across the UK is low. Dedicated support is provided by Defra’s Countryside Stewardship Schemes and in Scotland under the Forestry Grant Scheme. Challenges such as knowledge gaps and having the time and networks to adopt new land practices remain the key barriers.[229]
Box 4.2
Accelerating change in the agriculture and land use sectors – farmers need stability and support
In March, the UK Government published the LUF, setting out for the first time its long-term vision for multifunctional land use in England. Its intended use is as a guide, rather than to be used to prescribe action or bind decision makers.
- The LUF sets out 2030 and 2050 visions for priority land use objectives. A long-term commitment to maintain overall food production in England is set out to underpin food security and drive economic growth and investment.
- The LUF shows that England does have the land area to deliver this vision, including for the expansion of renewable energy such as solar and onshore wind power.
- Resilience and adaptation are embedded through the report at a high level. Less clear is the representation of land use change for climate mitigation actions, and the rate at which these need to be delivered to reach the level of abatement required to meet future carbon budgets.
- While the LUF is a welcome development in its recognition of the tensions and opportunities of land use for multiple priorities, further information is required on how it will drive future change on the ground.
Support structures following the phase out from the CAP have yet to translate to an increase in on-farm action. Agriculture represents an increasing share of national GHG emissions. Delivery of land use actions has been mixed with the good progress for woodland creation and peat restoration not matched in the establishment of energy crops and agroforestry.
Farmers across the UK face challenges when participating in actions that reduce emissions and build resilience in the face of climate change, which may require them to diversify their farm business. Clear, stable regulatory and support frameworks are needed in the long-term. Engagement by the Climate Change Committee (CCC) with farmers and farming organisations points to issues which would help facilitate uptake by farmers who wish to engage in such opportunities in the near-term.
- Rebuild trust: sudden changes to schemes and unclear objectives have led to an erosion of trust and expectation of instability in the sector. Farmers need clear and consistent steers from government from which to make long-term business decisions. New approaches need to be inclusive, addressing barriers to groups such as tenant farmers or small farms.
- Simple support structures: new schemes and emerging private finance were described as complex, bureaucratic and placing much of the risk on the farm business. Upfront capital grants, clear demand mechanisms, income certainty in the short-to-medium term, and simpler access to funding are needed to enable greater uptake.
- Advice and skills: locally grounded advice and farmer networks are highly valued when trialling new approaches on-farm. Farmers viewed local advisers as key to managing the risks in diversification via providing guidance grounded in what works in an area.
The LUF represents a coherent vision for land use in England. The UK Government must now provide a stable policy direction. This commitment should also be mirrored by the Northern Ireland Executive, the Scottish Government, and the Welsh Government, for example, through agricultural plans and strategies, land-use planning, and/or land-use frameworks.
4.3.5 Industry
Compared to our 2025 assessment, we have similar confidence in delivery of the Government’s chosen pathway for industry. The Government’s CBGDP involves more emissions reduction from electrification of industry than its previous plan, and less from CCS and hydrogen. This is a sensible reflection of the latest evidence on the balance of industrial decarbonisation technologies. However, while work is currently underway to electrify Port Talbot steelworks, there are significant risks or insufficient plans associated with electrification beyond this. There are credible plans for CCS and hydrogen projects which have received confirmed government funding, but we judge the emissions attributed to unfunded projects as carrying significant risks. Policy is currently insufficient to deliver industrial resource efficiency and to decarbonise non-road mobile machinery.
- Electrification: the CBGDP confirms that electrification is the primary route to decarbonise industry, but there is no clear plan as to how this will be delivered. Government has indicated that it intends to introduce further measures to make electrification the economically rational choice for a wider range of businesses, but it is yet to demonstrate how.
- Following a £500 million grant from the Government in 2024, construction is underway on the electric arc furnace at Port Talbot steelworks, due to complete in 2027.[230] This has caused a significant reduction in industrial emissions. However, a more proactive and decisive transition plan should have been developed to mitigate impacts on the local economy (see our advice on Wales’ Fourth Carbon Budget). In 2025, the Government intervened to prevent the closure of the blast furnaces at Scunthorpe Steelworks, and has now announced plans for nationalisation.[231] However there is still uncertainty around plans to decarbonise the site. If the site were to electrify, this could reduce industrial emissions by 3–4 MtCO2/year.
- The Industrial Strategy announced additional discounts to the electricity prices paid by certain manufacturers.[232] Around 500 businesses will receive an uplift to the network charging compensation available through the British Industry Supercharger Scheme, from 60% to 90%. Once applied, this is estimated to reduce electricity prices by an additional £7/MWh, bringing the total value of discounts for eligible businesses to £82/MWh (a reduction of around 50%).[233] In 2027, around 10,000 businesses will also receive policy cost exemptions on electricity prices via the BICS, which is estimated to reduce electricity costs by £35–£40/MWh (a reduction of around 20%).[234];[235] From 2028, the removal of Carbon Price Support is expected to further reduce industrial electricity prices (see Section 4.3.7).[236]
- However, the Government has not assessed whether these discounts will incentivise electrification. Our estimates suggest that the BICS discounts will not be large enough to mean that electrification delivers energy-cost savings (see Section 3.2.5). While the Supercharger discounts are larger, bringing the electricity-to-gas price ratio into a more favourable range, it is too soon to say whether this will be enough to incentivise electrification. There is no evidence that discounts to date have had an impact.
- Several first-of-a-kind industrial electro-thermal technologies are now coming online in Europe, but these require significant government support (see Box 4.3). While many of the most important technologies for industrial electrification, such as heat pumps and boilers, are commercially mature, there is still limited adoption both in the UK and in Europe. In addition to the higher cost of electricity relative to gas, these technologies typically have higher upfront costs and often require specific operational adjustments. In 2025, the UK Government confirmed that it will not continue the IETF, meaning there is now no support for the capital costs of electrification, although a scheme in Scotland continues.[237];[238]
- A new funding support package for the chemicals and ceramics sectors was announced in May 2026. Its primary aim is to support competitiveness, alongside energy efficiency and electrification.[239]
- The commercial case for industrial electrification is also considered relative to carbon prices and alternative decarbonisation options like CCS and hydrogen. Unlike for electrification, the Government’s hydrogen and CCS business models are designed to provide a long-term subsidy against the additional costs of the low-carbon alternative.
- There is still an opportunity for the UK to build a competitive, largely electrified industry, but the Government urgently needs a plan to deliver its ambition. This requires clarity on which industrial use cases electrification is deemed suitable for, and an assessment of the commercial conditions needed to deliver those. Continued action to address wider barriers will also be needed. A new Connections Accelerator Service to speed up grid connection timelines for major investment projects could help but is yet to get up and running.[240]
Box 4.3
Electrification of industrial technologies
Technological progress is being made globally to develop electric technologies which can decarbonise a wide range of industrial processes. However, it is key that policy creates the right environment for these technologies to be scaled up.
Technologies for electrifying lower temperature industrial processes (below 200˚C), including industrial heat pumps and electric boilers, are commercially ready. In some European economies, industrial heat pumps are also approaching cost parity.[241] There are many examples of these technologies being deployed in industrial applications, both in the UK and internationally.
- For example, in the UK, heat pumps have been installed at breweries for steam generation and brickworks for brick drying.[242];[243];[244] These projects are mostly small-scale, and were supported by funding from Government, including the IETF which has now been discontinued.
- BASF are installing a heat pump to provide 50 MW thermal output for steam production at its chemicals plant in Germany.[245] This is one of the largest heat pumps installed at a manufacturing site. The project received €310m in support from the German Government via their carbon contracts for difference programme.
- UPM have installed 50 MW and 60 MW electric boilers at their paper mills in Finland and Germany.[246]
However, there is not yet evidence of any country reaching a tipping point in scaling up the deployment of these technologies. The share of electricity used for industrial heat has not grown significantly in Europe, China or Southeast Asia.[247] This indicates that the right conditions for scaling up lower temperature industrial heat electrification are not yet in place. Action is needed to address financial barriers (including energy prices, capital costs, and incentives), and non-financial barriers (including grid connections and system integration).[248]
There are also increasing examples of innovation in large-scale projects which electrify very high-temperature industrial processes or provide thermal energy storage.
- Electric steam crackers: BASF, SABIC and Linde have developed a demonstration plant for a large-scale electric steam cracker (6 MW) for making basic chemicals in Germany.[249]
- Electric furnaces and kilns: Verallia installed a 9 MW electric furnace at its container glass factory in France.[250] Weinerberger has installed an electric 3 MW brick kiln at the Uttendorf plant in Austria.[251]
- Heat batteries: Heineken is installing a heat battery, supplied by Rondo Energy, which can provide 7 MW of steam at its Lisbon brewery.[252] A heat battery is being installed in Scotland at a whisky distillery to power a 3 MW steam boiler.[253]
These technologies are in an earlier stage of development, and have all received significant financial support, either from national governments or the EU Innovation Fund. Further government support will be needed to scale up these more innovative electrified industrial technologies.
- Industrial CCS: progress has been made this year with industrial CCS, as a final investment decision was reached to construct a CO2 capture facility at the first UK manufacturing site.
- £9.4 billion was allocated in the 2025 Spending Review for CCS.[254] The majority of this is for the expansion of Track-1 clusters, alongside £200 million in development funding for the Acorn Cluster. Construction of CO2 transport and storage infrastructure has now begun at both Track-1 clusters, which are expected to start operations in 2028.[255];[256]
- The Government has signed final contracts with Heidelberg Materials to build an 0.8 Mt CO2/year capture facility at its cement plant in Padeswood, Wales, to be operational by 2029.[257] No other manufacturing sites have yet secured funding for industrial CCS.
- The National Wealth Fund announced a £28.6 million investment to support the development of Peak Cluster CO2 transport system, which could support CCS for four cement and lime plants.[258]
- The Government is consulting on policy proposals to support non-pipeline transport of CO2.[259] A selection process has been launched for pathfinder non-pipeline transport projects to connect to the East Coast Cluster by 2032.[260]
- Industrial hydrogen: the Low Carbon Contracts Company has signed contracts with green hydrogen projects under Hydrogen Allocation Round 1 (HAR1), several of which plan to supply industrial users. Government has not yet awarded any contracts under HAR2, which closed to applicants in 2024, or launched HAR3 which is due this year (see Section 4.3.9).
- Resource efficiency: there is little policy in place to incentivise industrial resource efficiency. Government is consulting on a framework to support low-carbon products including voluntary product standards.[261] However, further action is needed to deliver the resource efficiency in the CBGDP, particularly to incentivise resource-efficient construction. The delayed Circular Economy Strategy, expected in 2026, is an opportunity to deliver this.
- Non-road mobile machinery: there is still no policy in place to incentivise decarbonisation of non-road mobile machinery. Government has committed to producing an Off-Road Machinery decarbonisation strategy, although the timeline for this is unclear.[262]
- Carbon Border Adjustment Mechanism (CBAM) and ETS: the UK CBAM will come into force in January 2027, covering imports of steel, cement, aluminium, fertiliser, and hydrogen.[263] The EU CBAM has applied to UK exporters of these products to the EU since January 2026.[264] The UK and EU have agreed to work towards linking their respective ETSs and CBAMs.[265] This is likely to promote further decarbonisation in industry, but it is important that the Government ensures the mechanisms work effectively together to incentivise decarbonisation whilst maintaining a level playing field.
4.3.6 Aviation
There has been mixed progress in the aviation sector compared to our 2025 assessment. Achievement of the SAF mandate in 2025 and legislating the Sustainable Aviation Fuel Act (2026) increases confidence that some of the SAF mandate will continue to be delivered in the future. However, development and supply of second and third-generation SAF, uncertainty regarding CORSIA and international carbon pricing, and industry delivery of ambitious efficiency improvements, puts the sector at significant risk.
- Sustainable aviation fuel: achievement of the SAF Mandate in 2025 and implementing the Sustainable Aviation Fuel Act (2026), which will enable a SAF revenue certainty mechanism, represents positive progress towards ensuring SAF incentivisation and delivery.[266] However, timing uncertainty and financing risk remain for domestic and global construction and supply of second-generation biowaste SAF and third generation power-to-liquid SAF (see Section 3.2.6).
- Carbon Offsetting and Reduction Scheme for International Aviation (CORSIA) credits: the CBGDP includes use of CORSIA credits for meeting the Sixth Carbon Budget where they ‘represent high integrity reductions and removals and are sourced from countries that have ambitions consistent with the Paris Agreement temperature goal’. CORSIA is a developing market that is currently set to end in 2035. While there is time for the scheme to develop, relying on CORSIA credits for domestic action entails significant risk and uncertainties regarding quality credit supply, overall scheme ambition, global implementation of CORSIA, and future International Civil Aviation Organisation negotiation outcomes.
- It is difficult to assess whether the abatement from CORSIA credits in the CBGDP is credible without more information on the underpinning assumptions. This includes the criteria and methodology for assessing credit quality and country alignment with the Paris Agreement temperature goal. It also includes assumptions for the scheme after 2035, when CORSIA currently ends.
- International carbon pricing: the CBGDP assumes international aviation emissions reduction from CORSIA international carbon pricing. This reduces the growth rate in demand for flying because these costs are passed onto ticket prices. The CORSIA carbon price is currently low, and the future price is highly uncertain.
- Ambitious efficiency improvements: the high levels of efficiency improvements assumed in the CBGDP will be challenging to achieve without airspace modernisation and increased uptake of ultra-efficient aircraft. Airspace modernisation is currently being consulted on but it is uncertain when it will lead to reduced emissions from efficiency improvements. Aircraft are not retiring at their usual rate due to a global aircraft order backlog, which reached 17,000 aircraft in 2025, equivalent to around 60% of the current global fleet.[267] Normalisation is not expected until the early to mid-2030s.
- Engineered removals: engineered removals are essential to achieving Net Zero aviation. See Section 4.3.11 for more information on progress in the engineered removals sector.
4.3.7 Electricity supply
Positive progress has been made in electricity supply decarbonisation over the past year. AR7 secured record levels of low-carbon generation and important steps have been taken to remove planning barriers and reform the grid connections process. As a result, the majority of emissions reduction in electricity supply in the CBGDP has credible plans for the Fourth and Fifth Carbon Budget periods and we have increased confidence compared to our 2025 assessment. However, more action is needed. There is further to go in driving down the price of electricity, so that barriers to electrification are reduced. More progress on flexibility is also needed to optimise use of the cheapest and cleanest available resources. A range of policy risks in delivering a decarbonised system also remain, including delivering sufficient renewable generation capacity to meet the Government’s ambitions and addressing transmission network constraints. A small share of emissions reduction carries significant risks, with these being most pronounced in the Fifth Carbon Budget Period and for the 2030 NDC, mainly driven by potential shortfalls in offshore wind capacity by 2030 relative to Government plans.
Electricity prices
Driving down electricity prices is critical to enabling economy-wide electrification.
- Policy and legacy costs: the Government reduced electricity unit prices through removing three-quarters of the Renewables Obligation (RO) and ending the ECO scheme. The Energy Independence Bill is due to maintain this for three years. However, further reductions in the price of electricity are needed (see Section 3.2.3 and Section 5.2.5). The Government also plans to offer fixed-price contracts to existing legacy low-carbon generators on the RO scheme, potentially ‘decoupling’ wholesale revenues from marginal prices for up to approximately 30% of existing generation, on top of the 15% already on fixed price contracts.[268];[269];[270] The impact on bills will depend on the strike prices agreed.
- Carbon Price Support: the Government will abolish the Carbon Price Support (CPS) from April 2028, likely reducing electricity prices.[271] CPS applies an additional carbon tax to generators alongside the UK Emission Trading Scheme (UK ETS) price. It was introduced in 2013 to help phase out coal generation, an ambition now achieved. Its removal may modestly increase gas generation in the short term.[272] However, this effect would be expected to fade with UK ETS price rises.
Deployment support and funding
The Government has taken steps to strengthen support and funding for the deployment of low-carbon technologies.
- Renewables: AR7 delivered record offshore wind and solar PV capacity, alongside a large volume of onshore wind projects. This has improved our confidence in delivering the necessary emissions reduction in electricity supply. However, further capacity will need to be secured in upcoming allocation rounds to meet Government targets.
- Offshore wind: a small share of emissions reduction is at significant risk for the 2030 NDC. This is due to likely challenges in meeting the levels of capacity in the Government plans on time, driven by long lead times (currently around four to eight years) between CfD award and commissioning. Addressing them will require concerted action by the Government and industry to shorten lead times and/or increase deployment of other technologies. A 1 GW offshore wind shortfall would require around 1.5 GW of onshore wind or 3.7 GW of solar to replace lost annual generation. However, differences in generation profiles mean these technologies are not direct substitutes. In particular, wind generation is generally better aligned with seasonal demand patterns, whereas solar output is more concentrated in summer periods.[273] As noted in the CCC Adaptation Committee’s report on A Well-Adapted UK, future UK electricity demand is still expected to be highest in winter, even as the climate changes. As such, changes in the generation mix will affect the overall requirement for storage and system flexibility, with greater reliance on solar typically increasing these needs.
- Onshore wind and solar: some risks remain in securing sufficient future capacity due to uncertainty over future CfD rounds and merchant deployment. However, these are lower than for offshore wind, given typically shorter delivery lead times and greater scope for deployment outside the CfD scheme (due to lower capital intensity and smaller, modular project sizes).
- Storable energy: progress has been made, but risks remain around timely delivery of both firm power and dispatchable generation.
- Nuclear: in July 2025, the Government confirmed the final investment decision for Sizewell C, with funding secured via a Regulated Asset Base model.[274] Government states that operation is expected in the mid-to-late 2030s.[275] Delivery timelines are relatively tight and there are risks given the delays at Hinkley Point C, on which the design for Sizewell C is based. Some progress has been made on additional capacity beyond Sizewell C, but further steps are needed.[276] The Government has also accepted the recommendations of the Nuclear Regulatory Review and plans to legislate for them through a new bill.[277];[278]
- Biomass: the Government has agreed a temporary CfD contract (covering 2027 to 2031) with Lynemouth Power Station, following a similar contract agreed with Drax Power Station in 2025.[279] These contracts only subsidise the plants to operate unabated at low load factors. However, significant uncertainty remains over the long-term role of large-scale biomass due to delays in the Power BECCS business model, a lack of formal CCS requirements, and limited clarity on CO2 transport and storage arrangements (see Section 4.3.11).
- Low-carbon dispatchable: the Connah’s Quay Low Carbon Power Project was listed in the emitter project negotiation list for the expansion of the HyNet CCS Cluster.[280] If successful, it could provide up to 1.4 GW of gas CCS capacity, adding to the 0.74 GW already contracted at Net Zero Teesside. Additional low-carbon dispatchable capacity, including Hydrogen-to-Power, will still be needed.
- Long Duration Energy Storage (LDES): in September 2025 Ofgem announced 77 projects had progressed to the Project Assessment Stage of the LDES scheme, totalling 28.7 GW.[281] A significant amount of this potential capacity is lithium ion batteries. Award decisions are expected in summer 2026.
Networks
Significant and sustained investment in networks is essential to accommodate and realise the emissions‑reduction benefits of new low‑carbon generation, and to support electrification across the economy. Baseline funding allowances have now been set for the next transmission price control, although a substantial share of funding remains to be agreed through in-period mechanisms.[282]
Ofgem has also published its methodology for the next distribution price control, with business plans due this year and final funding decisions in 2027.[283] Clear, consistent criteria for evaluating the impact of distributed generation and demand on peak flows on the distribution networks would enable appropriate levels of network investment. Along with the Regional Energy Strategic Plans (RESPs), these funding decisions will be essential to help enable electrification of key sectors such as surface transport and buildings.
In addition to adequate funding of network investment, constraint management and connections reform remain critical for effective use of network capacity and renewable generation.
- Constraint management: the Government’s Constraint Management Action Plan, published in April, outlines actions to reduce network constraints through both new investment and better use of existing assets.[284] Delivery is key to maximising use of renewables and limiting reliance on unabated gas during periods of constraint (see Section 1.1.2).
- Connections reform: progress has been made on connections reform, with the National Energy System Operator (NESO) and network companies confirming a revised connections delivery pipeline in December 2025.[285] This provides greater clarity on the sequencing and deliverability of projects, though successful delivery will rely on market collaboration and transmission owners meeting high connections demand alongside rapid infrastructure build.
Flexibility, markets, and planning
- Flexibility: the Government’s Clean Flexibility Roadmap (published in July 2025) sets out actions to support the growth of flexibility.[286] It includes new governance and updates on consumer protections and appliance standards. It also contains commitments on system planning, to timely delivery of market-wide half-hourly settlement, and to addressing market barriers (including missed flexibility dispatch opportunities such as high flexibility asset skip rates). More progress is needed to optimise use of the cheapest and cleanest available resources and to ensure consumers are aware of and able to benefit from time-of-use tariffs (see Section 5.2.4). Effective use of system flexibility remains critical for efficient markets and networks and has the potential to offer some contingency against infrastructure delays.
- Market arrangements: in July 2025 the Government provided an update on the Review of Electricity Market Arrangements, ruling out zonal pricing and committing to a Reformed National Pricing (RNP) delivery plan.[287] In April 2026, the Government published the plan, detailing the expected roles of strategic planning and markets, as well as a summary of proposed balancing and settlement reforms.[288] While this is a positive step, significant uncertainty remains, particularly on the future of network charging, and how operational reforms will support efficient dispatch decisions. Decisions on implementation are needed.
- Planning and consenting: reforms introduced under the Planning and Infrastructure Act are expected to streamline Nationally Significant Infrastructure Project applications in England, improve prioritisation in the connections queue, and enhance consenting in Scotland.[289] However, timeframes remain dependent on adequate resourcing of planning authorities. The Government has also proposed reforms to consents, land access and rights for electricity network infrastructure, and reductions in the grounds for judicial review of energy projects deemed critical by Parliament.[290];[291]
- Spatial energy planning: some progress has been made through the transitional Regional Energy Strategic Plan, but the main Strategic Spatial Energy Plan (SSEP) has been delayed. Its timely completion and implementation are needed to provide strategic direction for network and generation investment. This is particularly important given the significant role the Government expects the SSEP to play in informing the various spatial ‘levers’ used to influence siting decisions of new generation. Completion of the SSEP is also critical for the subsequent development of the final Centralised Strategic Network Plan.
Alongside decarbonisation of the system, there is a need to make it resilient to the current and future climate. Upgrades to the energy system provide a once in a generation opportunity to build in resilience. For further detail on how this can be delivered please see the CCC Adaptation Committee’s A Well-Adapted UK report.
4.3.8 Waste
Compared to our 2025 assessment, we have greater confidence in the delivery of Government’s plans. Important reforms to improve recycling rates and reduce waste have now been implemented, but further policy will be needed to meet the Government’s ambitions to reduce waste, increase recycling, and prevent landfilling. Progress has also been made with CCS at EfW sites, as a final investment decision was reached on the first site to connect to HyNet Cluster in 2029. Several further EfW sites beyond those already in negotiations will need to connect to CCS to deliver the pathway in the CBGDP. There are insufficient plans to deliver emissions reduction from landfill gas capture, which are significant over the Sixth Carbon Budget period. There are also at least some or significant risks associated with the emissions reduction from wastewater.
- Collection and packaging reforms: Extended Producer Responsibility (EPR) for packaging and Simpler Recycling, two key policies to improve recycling and reduce waste, have been implemented this year.[292];[293] The third reform, the Deposit Return Scheme, is delayed until 2027.[294]
- EPR has been implemented across all UK nations. Simpler Recycling applies only in England, requiring all councils to collect consistent materials for recycling including separate food waste collections. Similar requirements for food waste collections already apply in Northern Ireland, Scotland and Wales.
- Energy from waste: some progress has been made with CCS for EfW sites.
- The Government has signed final contracts with Protos Energy Recovery Facility to connect to the Hynet CO2 transport and storage network in 2029.[295] This site has the potential to capture 0.37 MtCO2/year, around 5% of current EfW emissions. Two further EfW sites are on the ‘standby’ list for Hynet, which means they are contingency projects which could enter negotiations to connect to the cluster when capacity becomes available.[296]
- The Government has also introduced decarbonisation readiness requirements for new EfW sites to access an environmental permit.[297] EfW operators will be required to demonstrate space and technical requirements for CCS, economic feasibility, and plans for CO2 transport and storage. However, locational feasibility will be self-certified. Allowing operators to self-certify could lead to inappropriately located new sites, which should instead be informed by the forthcoming Strategic Spatial Energy Plan.
- The Government plans to include EfW in the UK ETS from 2028, although full details of how it will be included have not yet been confirmed.[298] This should provide an additional incentive for developers to consider CCS, although it is important that the overall cap on emissions allowances is not increased when EfW is added.[299]
- Landfill gas capture: subsidies for landfill gas capture via the RO scheme come to an end from 2027 and no new incentives have been announced.[300] This means there is currently no delivery mechanism for Government’s ambition to increase landfill gas capture rates.
4.3.9 Fuel supply
The CCC’s focus is on progress towards achieving carbon budgets. As new fossil fuel development within UK borders has minimal impact on UK carbon budgets it is not assessed here, although wider, global impacts remain.[301]
There has been mixed progress in policy development and delivery to decarbonise the fuel supply sector and develop low-carbon fuels compared to our 2025 assessment. There are some or significant risks associated with reducing emissions from upstream oil and gas production. More projects to reduce flaring and venting and to electrify oil platforms are needed to achieve the level of emissions reduction in the CBGDP and the industry’s 2040 target and 2050 Net Zero target for oil and gas production emissions.
While good progress is being made in developing the low-carbon hydrogen sector, we still see some risks given tight timelines and delays in providing funding allocations, making decisions around transport and storage, and publishing a refreshed hydrogen strategy. There are also some risks in the refining sector, which will rely on low-carbon hydrogen and CCS to decarbonise. The long-delayed biomass sustainability framework was published as a consultation and needs to be finalised promptly to allow business to confidently invest in sustainable, domestic bioenergy supply.
- Fossil fuel supply: while the oil and gas industry is expected to meet its 2030 emissions reduction target (of a 50% reduction in production emissions relative to 2018), the CBGDP goes beyond this. Subsequent industry targets are also at risk. There has been progress on developing CCS and low-carbon hydrogen to service two of the UK’s four oil refineries, but risks remain.
- Upstream oil and gas production: the North Sea Transition Authority’s (NSTA) Emissions Monitoring Report (EMR) 2025 highlights that more projects to reduce flaring and venting and electrify oil platforms need to come to fruition to stay on track for industry targets beyond 2030.[302] Emissions reduction in the CBGDP goes beyond the 2030 target and the NSTA’s EMR 2025 mid-range electrification scenario, and is therefore subject to significant risks without further action.[303] It is, however, positive to see the Government’s North Sea Future Plan focus on decarbonising oil and gas production and on helping workers and communities make the transition, as production in the UK’s mature North Sea basin continues to decline.[304]
- Oil refining: two of the four UK refineries (Stanlow and Phillips 66) are involved in the Government’s CCUS cluster sequencing process (see Section 4.3.5).[305] Funding agreements have not yet been reached so there are still some risks around achieving these emissions reductions. All four refineries are engaged in the Hydrogen Allocation Rounds (HAR), either as planned off-takers or producers of green hydrogen, although this is unlikely to be enough to fully meet their energy demands. Stanlow refinery installed a hydrogen-ready furnace in 2025 in preparation for a switch to hydrogen in 2028.[306]
- Hydrogen: while progress on developing the hydrogen sector is positive, we judge plans to have some risks. Government timelines are tight and have been slipping for initial hydrogen production from projects awarded contracts through HAR1, decisions on future allocation rounds and an overarching hydrogen strategy.
- Hydrogen Allocation Round 1: the Low Carbon Contracts Company has signed Low Carbon Hydrogen Agreements with HAR1 green hydrogen projects, which are expected to provide up to 117 MW of low-carbon hydrogen installed capacity once fully operational.[307];[308] Following a decision by Scottish Power not to proceed, citing a challenging market environment, the Low Carbon Hydrogen Agreement for its Whitelee project was terminated in December 2025.[309] All other projects are currently proceeding through to the final investment decision, construction and operation phases. HyMarnham Power started operations in April 2026, and the expectation is for remaining projects to come online between 2026 and 2028.[310]
- Future allocation rounds: a final decision on which HAR2 shortlisted projects will be awarded a Low Carbon Hydrogen Agreement was expected in early 2026 but has not yet been made. Deadlines for the launch of further allocation rounds are tight, with HAR3 expected in 2026 and HAR4 from 2028. It will be important for the Government to stick to its aim of shortening the time between application and final award, set out in the 2025 Hydrogen Update to the Market.[311]
- Blue hydrogen: CCS-enabled hydrogen projects are eligible for support through the CCUS cluster sequencing process and can undertake direct agreements with the Government to achieve a route to market.[312] The Government plans to expand the HyNet Cluster include EET Hydrogen’s Hydrogen Production Plant 1 as a priority project.[313] This is currently the most advanced UK blue hydrogen project, targeting final investment decision by the end of 2026, following initial challenges in securing financing.[314] BP confirmed in December 2025 that they have decided not to progress the development of H2Teeside, citing material changes in circumstances, including land use conflicts – planning permission was given by the local planning authority for a data centre to be built on the same site.[315];[316]
- Transport and storage: the Government has committed to establishing the first regional hydrogen network from 2031.[317] Successful projects will be selected through a joint hydrogen transport and storage competition, which aims to launch later this year. If the competition timings slip beyond this year, it could put Government ambitions for a regional hydrogen network at risk.
- Hydrogen strategy: a hydrogen strategy was aimed for publication in 2025 and has not yet been published. Progress must continue on the ground in the absence of a new strategy.
- Bioenergy: the Government’s common biomass sustainability framework represents a valuable opportunity to strengthen rules on the sourcing of bioenergy feedstocks, including on greenhouse gas emissions. This is a long-delayed process. It will be important to promptly finalise the framework.
4.3.10 Shipping
There has been limited progress on shipping policy compared to our 2025 assessment. The inclusion of domestic shipping in the UK ETS is an important step, but this only covers a small proportion of the total required emissions reduction.[318] However, the delay to the IMO’s Net-Zero Framework has significantly increased our assessment of the risk to delivery of the CBGDP pathway, given the large share of emissions associated with international shipping.[319]
- Domestic shipping: domestic shipping will be included in the UK ETS from July 2026.
- International shipping: a decision on the IMO’s Net-Zero Framework has been delayed, and there has not been sufficient domestic policy to fill this gap. The UK ETS Authority has run a consultation on including international shipping in the ETS from 2028, which would fill some of the gap left by the IMO delay, but only a relatively small amount.[320]
4.3.11 Engineered removals
We have greater confidence in the delivery of the Government’s pathway for engineered removals in the Fifth Carbon Budget period compared to our 2025 assessment. This is both because the CBGDP pathway reflects recent policy delays by significantly scaling back the assumed level of engineered removals in this period, and due to important progress in the policy development and implementation required to support their initial deployment.
However, there is more uncertainty over engineered removals’ growth in the longer term. The important Power BECCS Business Model is increasingly delayed and there is no long-term funding allocated for engineered removals beyond initial projects. The Government’s CBGDP includes a substantially steeper engineered removals scale-up in the Sixth Carbon Budget period than their previous plan but provides no delivery strategy (see Section 4.6).
Proposed integration into the ETS provides a partial means of funding engineered removals in the medium and long term. However, there is no mechanism in place to ensure the whole aviation sector (much of which is outside the ETS) can fund engineered removals, even though aviation is likely to be the largest source of residual emissions requiring them.
To a larger extent than our 2025 assessment, we assess a large share of the engineered removals that the Government plans for the Sixth Carbon Budget period to have insufficient plans. The independent Whitehead Review also set out recommendations to accelerate deployment in the short- and long-term.[321]
- Engineered removals business models: the GGR Business Model was finalised in August 2025, an important milestone which allows eligible projects to enter negotiations with the Government through the CCS clusters programme.[322] However, there have been no public developments on the Power BECCS Business Model since December 2023.[323] This is increasing the uncertainty around the potential to deploy removals from existing large-scale biomass generators.
- Integration of engineered removals into the UK ETS: in July 2025, the UK ETS Authority reconfirmed plans to integrate engineered removals into the UK ETS by 2029, setting out the decisions on several high-level design elements.[324] Timely consultation on further technical details is now important to allow for legislation in 2028.
- CCS cluster developments: several engineered removals projects are on government negotiations lists. The Protos Energy Recovery Facility has now reached final investment decision, the first engineered removals project to do so. Four other engineered removals projects are on the HyNet negotiations lists (one priority project, three standby projects).[325];[326] Successful expansion of the East Coast Cluster and progression of the Acorn Cluster and Viking Cluster are also important for engineered removals to ensure prospective sites have access to CO2 pipelines (see Section 4.3.5). Prompt progression of planned support for non-pipeline CO2 transport will be particularly important for dispersed engineered removals sites, which have the potential to contribute substantial removals but many of which are facing expiring support in the coming years.[327] Until there is clarity on the source and scale of long-term funding to support these additional projects and prospects for their CO2 transport and storage infrastructure, there is considerable risk associated with a large share of planned engineered removals in the Sixth Carbon Budget period.
- Wider enablers: there has also been progress in important supporting policy areas, helping to give clarity to the market.
- The British Standards Institute has published minimum quality thresholds for direct air carbon capture and storage and BECCS.[328];[329] It is now working on developing full standards, which will be used to verify projects using the Government’s business models.
- The Government has consulted on a new common biomass sustainability framework (see Section 4.3.9).[330] A robust framework will be important to give confidence to the BECCS supply chain and their stakeholders.
4.4 Key developments on enablers of effective delivery
4.4.1 Public engagement and awareness of household low-carbon choices
The Government has made positive steps to increase public engagement with the transition to Net Zero and awareness of household low-carbon choices. The impact will depend on how these broader strategies are translated into delivery in the coming years.
- Public participation plan: the Government published Energising Britain, its public participation plan. The plan’s focus on trusted messengers and in-depth, two-way engagement marks an important step towards meaningful public involvement in the transition to Net Zero.[331] However, beyond initial initiatives such as the Youth Climate and Nature Panel and the Energising Britain event, the strategy does not yet set out a concrete future programme. Government should focus on implementation, establishing mechanisms for direct public dialogue, drawing on insights from local deliberation and conducting regular evaluation of the strategy’s impact.
- Local Power Plan: the Local Power Plan represents a significant step towards expanding community ownership of clean energy, setting out investment and practical support to help develop more than 1,000 local and community energy projects.[332] Success will depend on the delivery of these community energy projects and associated benefits.
- Government leadership: the Department for Energy Security and Net Zero (DESNZ) has increased efforts to communicate the purpose and benefits of its Clean Energy Mission, including through their new annual State of Climate and Nature Address.[333] There is an opportunity to strengthen public engagement on climate action and low‑carbon choices across government, beyond the current focus within DESNZ.
4.4.2 Local government
Over the last year, the Government has repeatedly recognised local authorities as central partners in delivering Net Zero in strategic documents such as the Local Power Plan, public participation plan, Warm Homes Plan and Land Use Framework.[334];[335];[336];[337] However, many delivery‑related details are yet to be announced. There is a need to set out ways of working and ongoing collaboration, and clearer roles, responsibilities, and funding arrangements between national and local government.
4.4.3 Workers and skills
The Government has taken positive steps in publishing plans to support the development of low-carbon skills in key ‘clean energy’ industries. The Government should ensure there is sufficient training capacity to deliver jobs and skills training across all relevant sectors, not just clean energy, working in coordination with trade unions, employers, and training providers to deliver this.
- Clean Energy Jobs Plan: the publication of the Clean Energy Jobs Plan is a welcome step. It includes a commitment to ensuring good quality jobs and measures such as supporting greater trade union recognition in the wind sector, widening access to the clean energy sector, and setting up an Industrial Strategy Zones Skills Forum.[338] However, similar plans are needed for other sectors key to the Net Zero transition, such as transport, waste, and agriculture and land use.
- Industrial Strategy: the identification of clean energy as a key sector in the Industrial Strategy provides welcome certainty to workers and skills providers, and means the clean energy sector is eligible for some of the planned investment packages to support skills and jobs.[339];[340]
- Funding and initiatives to support skills: the Government has also set out funding and initiatives to provide new and transitioning workers with the necessary clean energy skills. This includes reinstating Local Skills Improvement Plans (LSIPs) which should consider the priority occupations required to deliver the transition, and establishing five new Clean Energy Technical Excellence Colleges.[341];[342];[343] Overall these are positive steps, however it is unclear whether this is sufficient.
- Just transition: the Government has made progress in supporting oil and gas workers to transition into the clean energy sector through the North Sea Future Plan, targeted investments in key regions, and progress on the Energy Skills Passport. However, many workers in high-carbon industries face continued uncertainty.
- The North Sea Future Plan, with £20 million funding from the UK and Scottish Governments, was published following demand for the Aberdeen skills pilot to help oil and gas workers retrain. The plan sets up the North Sea Jobs Service, which will offer oil and gas workers career guidance and advice, training funding, and support options if they become unemployed.[344]
- The Government has continued development of the Energy Skills Passport platform.[345] However, it has faced significant delays and is still in early stages of its rollout, with around 400 users since its launch.[346];[347]
- Offshore wind development has been announced in Port Talbot, with Associated British Ports securing grant funding of up to £64 million from the Government. This is expected to support thousands of direct and indirect jobs, with the company estimating it could lead to more than £500 million in associated investment.[348]
- In 2025 the Government intervened to prevent the closure of the blast furnaces at Scunthorpe Steelworks. However no firm plan for decarbonising the site has been agreed yet. Workers in many energy-intensive industries face continued uncertainty due to high energy prices and the lack of clear and proactive decarbonisation plans.[349];[350]
- The LUF is a welcome development in the agriculture and land use sector (see Section 4.3.4). However, farmers need support to diversify their operations, and to build skills and capacity to reduce emissions and sequester carbon in their activities (see Box 4.2).
- The Northern Ireland Executive has announced it will set up a Just Transition Commission, and the Scottish Government has confirmed another five-year mandate for the Scottish Just Transition Commission.[351] As noted in our advice letter, it will be important to ensure a tightly defined scope and role for the Commission in Northern Ireland.[352]
4.4.4 Business and finance
The Government has made progress in engaging with businesses and financial institutions and improving disclosure and transparency around decarbonisation. Key outstanding priorities are clear guidance for small and medium enterprises (SMEs) and policies to reduce the impact of high energy prices.
- Disclosure and transparency: there have been positive, if delayed, developments in disclosure and transparency for business and financial sector decarbonisation. Further details on planned implementation will increase the impact of these developments.
- The final UK Sustainability Reporting Standards (UK SRS) were published in February 2026.[353] The standards set out how businesses report on climate impacts and strategies and are currently available for voluntary compliance. Clarity is needed on UK SRS reporting requirements for large companies, and how they will interact with or replace current climate-related reporting requirements. The Government has not yet responded to its consultation on transition planning, often seen as complementary to UK SRS.
- The Prudential Regulatory Authority strengthened its supervisory expectations on large UK banks and insurers for how they assess and manage risks related to the Net Zero transition and climate impacts.[354]
- Net Zero Council: the Net Zero Council is starting to establish itself as a constructive forum for coordinating the transition and should focus in the next year on driving delivery of sector plans with clear ambitions, actions, and ownership.[355]
- Energy prices: high energy prices remain a major challenge for business competitiveness, with little support for non-energy intensive businesses and SMEs. This is a barrier to electrification, particularly for low-carbon heating in commercial properties (see Section 4.3.3), and to businesses’ ability to pursue low-carbon growth opportunities.[356]
- Energy price support policies are targeted for energy-intensive industries only (see Section 4.3.5).[357]
- The Willow Review highlighted the need to make sustainability accessible and viable for SMEs.[358] Government has taken some limited action to address this, by committing to publishing new Net Zero guidance for SMEs and in announcing £2 million in funding support for SMEs electrification and efficiency measures.[359];[360]
- Investment: the National Wealth Fund (NWF) committed to investing the remainder of its £28 billion core capitalisation by 2030/31, including £5.8 billion for CCUS, hydrogen, green steel, battery manufacturing and electric vehicle supply chains, and ports.[361] As of April 2026, the NWF (formerly the UK Infrastructure Bank) has already committed £5.8 billion to clean energy projects in addition to a £36.6 billion loan to Sizewell C nuclear power station.[362];[363]
- Voluntary carbon markets: in July 2025, the UK Government launched the International Coalition to Grow Carbon Markets, in partnership with Singapore and Kenya.[364] The Coalition proposed a set of shared principles for use of carbon credits and called for governments to clarify domestic laws and regulations of carbon markets.[365]
4.5 Closing the gap to the 2030 NDC
The Climate Change Act places a legally binding obligation on the Government to deliver carbon budgets. The Act does not refer to NDCs, which are international commitments set under the 2015 Paris Agreement, which came several years after the Act. However, there are two important reasons for the UK to ensure that its NDCs are delivered.
- A feasible Net Zero trajectory: for the UK to be on track to deliver the Sixth Carbon Budget and Net Zero by 2050, it is important that the 2030 NDC is achieved. The Fifth Carbon Budget, covering the period 2028 to 2032, was set before the 2019 amendment to the long-term target set out in the Act to achieve Net Zero by 2050. The trajectory it implies is therefore not consistent with a feasible, economically-efficient pathway to Net Zero, nor to the Sixth Carbon Budget (covering the period 2033 to 2037), which was set on a pathway to Net Zero.
- The CBGDP pathway involves a significant ramp-up of engineered removals after 2030 to support delivery of the Sixth Carbon Budget. This approach carries substantial risks.
- Accelerating near-term electrification in buildings, surface transport, and industry would increase confidence in the delivery of the Sixth Carbon Budget, allow consumers to benefit from more stable energy prices, and keep the 2030 NDC within reach.
- International leadership: while there is no legal mechanism by which countries can be held to account for missing their NDC targets, the success of the Paris Agreement relies on countries making best efforts to achieve them. The UK has a strong reputation for international leadership on climate change. Having set an ambitious target for 2030, to deliver on it in full and on time would send a strong signal. Conversely, limiting ambition to that in the CBGDP would risk signalling a delay in UK ambition, particularly on plans to electrify key sectors, which could undermine other countries’ commitment to growing markets for low-carbon technologies and delivering ambitious reductions in emissions.
While the Government has stated that it is committed to delivering its 2030 and 2035 NDCs, the CBGDP pathway does not meet the 2030 NDC. The pathway delivers a 65% reduction below 1990 levels, with the target level of 68% below 1990 levels reached in 2032. This equates to a gap of 26 MtCO2e of emissions reduction, required to achieve the 2030 NDC, that are not covered by policies and plans. The Government will need to bring forward additional policies and plans to make up this gap.
The Balanced Pathway presented as part of our advice on the UK’s Seventh Carbon Budget provides an achievable and cost-effective route to Net Zero, meeting all carbon budgets and the NDCs. There are three key areas where our pathway reduces emissions more quickly than the CBGDP, which together would close the majority of the gap to the 2030 NDC. In each of these areas – especially surface transport and buildings – emissions reduction in the CBGDP is lower than in the previous government’s plan.
- Surface transport: our Balanced Pathway for surface transport delivers around 10 MtCO2e of additional emissions reduction by 2030 through a combination of faster uptake of electric cars and vans and stronger action to enable modal shift.
- There is clear scope for the EV market to grow more rapidly than the CBGDP pathway. The CBGDP uses a conservative uptake trajectory based on the minimum of what the ZEV mandate delivers, once expected uses of flexibilities are included.
- The market, underpinned by the ZEV mandate, is rapidly increasing the choice and reducing the price of electric cars on offer. The like-for-like price premium of a new electric car fell to 16% in 2025 (see Section 3.2.2). We expect that once new electric cars are cheaper than equivalent petrol cars, this will trigger a tipping point in the transition, after which demand will surpass the levels implied by the ZEV mandate. In our Balanced Pathway, this occurs between 2026 and 2028.
- As we approach this tipping point, the Government must stand firmly behind the ZEV mandate to provide certainty to the market. The Government should continue to unblock barriers to EV adoption, in particular increasing access to affordable charging.
- Buildings: our Balanced Pathway for buildings delivers around 4 MtCO2e of additional emissions reduction by 2030, due to faster roll-out of low-carbon heating, especially in residential and public sector buildings.
- In our Balanced Pathway, retrofit heat pump installations in domestic buildings reach around 450,000 per year by 2030. This is more ambitious than the aim set out in the Warm Homes Plan to achieve a retrofit installation rate of 250,000 by that point, and likely also higher than the larger number required to deliver the CBGDP pathway.[366]
- The market growth rate required to achieve our pathway’s higher level of installations is consistent with the rates seen in comparable European countries, such as Ireland and the Netherlands. Furthermore, the growth seen in the UK market between 2023 and 2024 was ahead of this required rate, although this growth slowed between 2024 and 2025. Provided the right mechanisms and market signals are put in place, there is therefore scope for faster heat pump roll-out than assumed in the CBGDP.
- Future phases of the PSDS – which have now been cancelled – had been expected in the previous government’s plan to deliver 2.4 MtCO2e of emissions savings per year by 2030. Putting plans in place to replace this scheme could allow these emissions savings to be recovered.
- Waste: our Balanced Pathway for waste delivers around 3 MtCO2e of additional emissions reduction by 2030, as a result of more ambitious assumptions on recycling rates and a faster reduction in biodegradable waste to landfill.
Other sectors could also contribute to greater emissions reduction, including agriculture, fuel supply, and HGV decarbonisation.
4.6 Priority recommendations
4.6.1 Priority actions for the UK Government
Meeting the UK’s emissions targets is achievable – most of the technologies and choices that are required are already available today. The markets for many of these are already growing quickly; when this combines with effective policy that provides confidence and certainty to drive these markets forward, change can happen quickly.
Last year, we set out ten priority actions that needed to be acted upon urgently to achieve this. There has been some progress in a number of these key areas (see Section 4.1.1), but action is needed with more urgency in several critical areas.
Accelerating electrification across the economy
Rapid progress over the next year is essential to keep the 2030 NDC in reach, with the pace of emissions reduction needing to almost double. To achieve this, the Government must urgently remove barriers facing households and businesses to transition to electric technologies.
In particular, electrification of home heating and transport could save up to 80 million barrels of oil and 1.5 billion therms of gas in 2030, which would cost almost £8 billion per year at current oil and gas prices.[367] Electrification is the most effective form of energy efficiency: by 2050, the efficiency of a more electrified energy system would reduce wasted energy by around half.
Key actions to enable this include:
Make electricity cheaper
While progress has been made in the past year to remove some policy costs from electricity bills, this is not sufficient to incentivise many households and businesses to transition to low-carbon heating (see Section 5.2.5). Remaining policy costs should be removed from electricity bills for both households and non-residential users so that the greater efficiency of heat pumps compared to fossil fuel heating is reflected in lower bills. Lower bills would also improve the case for investing in the UK’s energy-intensive sectors (R2025-046).
Create the conditions for a more rapid transition to electric cars
Propelled by the ZEV mandate, the market continues to drive down the price of electric cars, allowing more households and businesses to benefit from lower costs of EV ownership. With clear and consistent incentives and messaging, the adoption of electric cars can outpace current ambition, and the adoption of electric vans can catch-up. To flourish, the UK car industry needs to continue its pivot to the technologies of the 21st century. This requires the Government standing firm behind the ZEV mandate and removing barriers to EV adoption. Crucial to this is increasing access to affordable charging, allowing the one-third of homes without access to off-street parking to benefit from lower running costs. It is also important to, remove regulatory barriers and minimise any ‘hassle factor’ to consumers from the planned introduction of eVED (R2025-055; R2025-056; R2026-011).
Accelerate the installation of heat pumps in buildings
The UK has one of the lowest market shares of heat pump installations in Europe. The Government must ensure installations accelerate in all segments of the market (R2025-059; R2025-062; R2026-008; R2026-009; R2026-010). It should do this by:
- Urgently addressing the gap left by the closure of the ECO scheme. In the last three years, this scheme accounted for around a third of retrofit heat pump installations in the UK, providing targeted support for low-income households. Without a sufficient replacement, installations could fall significantly this year.
- Removing any unnecessary barriers that make a heat pump harder to install than a gas boiler, so that low-carbon heating installations become the default choice by 2035. This could be done by: reducing regulatory barriers, addressing skills gaps, improving advice to households and businesses, and enabling market conditions which reduce installation costs.
- Introducing a comprehensive programme to decarbonise public sector buildings, following the closure of the PSDS. The Government should consider restricting the installation of fossil-fuel boilers in public buildings. Moving instead to low-carbon combined heating and cooling systems can both reduce fossil fuel dependency and protect vulnerable people from rising temperatures, as set out in the CCC Adaptation Committee’s report on A Well-Adapted UK, published earlier this year.
Deliver on industrial electrification
Exemptions to electricity network and policy costs will not be sufficient to incentivise industrial electrification on their own. The Government should now set out a plan to deliver its ambition for industrial electrification. This should confirm suitable use cases and establish the conditions necessary to make electrification the economically rational choice – addressing both capital and operating cost barriers (R2026-013).
Key actions in other areas
Provide long-term policy certainty for farmers and land managers
Policy certainty is needed for farmers and land managers to support and incentivise sustainable farming approaches and land use change that reduce GHG emissions and sequester carbon. New strategies such as the LUF and Farming Roadmap should be used to ensure delivery at the scale and pace needed to support the sectors’ contribution to Net Zero (R2025-069; R2025-070).
Continue the rapid expansion of the low-carbon electricity system
This will require continued progress on both the build-out of low-carbon generation capacity, including through an effective Allocation Round 8, and on the strengthening of the grid, connections and spatial planning processes (R2025-072; R2025-073; R2026-015; R2026-014).
Develop policy to ensure that the aviation industry takes responsibility for its emissions reaching Net Zero by 2050
The Government’s CBGDP is reliant on CORSIA credits and carbon pricing to address international aviation emissions. Government should set out stringent criteria to determine CORSIA credit eligibility in a UK carbon budget and how country alignment with the Paris Agreement temperature goal will be determined. The Government should also mitigate the significant risks the CORSIA scheme faces, including insufficient quality credit supply and the scheme ending in 2035, by developing policy to enable strong carbon pricing and industry access to engineered removals for the whole of the aviation sector (much of which is currently outside the ETS). The Independent Review of Greenhouse Gas Removals puts forward viable options for ensuring this. Given the risks the sector faces, robust contingencies should be in place to address any delays in decarbonisation, including through demand management (R2025-075).
Provide long-term confidence and funding to deliver a rapid scale-up of engineered removals
The Government’s CBGDP pathway assumes a very rapid scale-up of engineered removals in the Sixth Carbon Budget period. Government business models, the integration of engineered removals into the UK ETS, and voluntary carbon markets provide a broad framework to deploy engineered removals. However, there is no funding allocated beyond an initial set of projects in CCS clusters and no mechanism in place to link the whole aviation sector (much of which is currently outside the ETS) to engineered removals. The Government should publish an engineered removals strategy to give clarity on the remaining policy gaps, funding mechanisms, and roles of different technologies. It should also explain how progress will be monitored and link to broader contingency plans (R2026-016; R2026-017).
4.6.2 Priority actions for Scotland, Wales, and Northern Ireland
Section 4.1.2 set out the progress of the Northern Ireland Executive and the Welsh Government against the priority recommendations we made for them last year. Twenty-nine of these recommendations are carried over into this report, having not yet been delivered in full. We make two new recommendations to the Northern Ireland Executive and one new recommendation to the Welsh Government. The full list of recommendations is set out in Annex 1.
The Committee will be reviewing our recommendations to the Scottish Government later in 2026.
Chapter 5: Household costs and savings
In this chapter we estimate the costs and savings for different households on fossil fuel or low-carbon electric technologies. We do this to assess whether, under current market prices and government policy, there is sufficient financial incentive for households to switch to low-carbon electric technologies.
Our key messages are:
- Overall costs and savings for a typical UK household: a typical UK household will see lower bills overall if they have an electric car and a heat pump, rather than a petrol car and a gas boiler, with today’s market prices and government policies. This depends on them having access to at-home electric car charging. The same is true for a representative low-income household, and a rural household moving from a diesel car and an oil boiler to an electric car and a heat pump. This is true for prices both before and following the start of the Iran war.
- Electric cars: the majority of the savings come from the lower running costs of electric cars. Most households would now save on combined upfront and running costs over the lifetime of a car by switching from a petrol or diesel car to an electric car. However, high public charging costs mean this is not true for the one-third of households without at-home charging.
- Heat pumps and solar panels: government policy is providing grants and will provide low-cost loans for heat pumps and solar panels. Combined with time-of-use electricity tariffs, these can make a heat pump more affordable for a typical household than a gas boiler.
- If home heating costs are considered in isolation, the typical household does not make a saving on combined upfront and running costs by switching to a heat pump. However, they do make a saving if they also switch to a time-of-use tariff and solar panels. This is true for prices both before and following the start of the Iran war.
- Not all homes are suitable for solar panels and homes vary in the degree to which they can use time-of-use tariffs. Making electricity cheaper, and further action to address barriers to heat pump uptake, would enable many more households to save when switching and help wider electrification in the economy.
- Impact of the Iran war: the second major fossil fuel price shock in just four years makes switching to electric technologies all the more important.
- Bill increases following the start of the Iran war are almost four times higher for a typical household and 10 times higher for a rural household with an oil boiler if they have a petrol or diesel car and fossil fuel heating, rather than an electric car and a heat pump.
- At prices following the start of the Iran war, a typical household would save around £1,210 a year by switching to an electric car, a heat pump, solar panels, and a time-of-use tariff, compared to £840 before the Iran war. A rural household with an oil boiler could save around £1,880 a year by switching to a heat pump and an electric car, even without solar panels or a time-of-use tariff, compared to £350 before the Iran war.
5.1 Analytical approach
In this analysis we compare costs for households with high-carbon (fossil fuel) versus low-carbon (electric) technologies, under current prices and current and planned policy settings. We assess household costs for home energy and transport for a typical household, as well as for a range of different household types. This approach differs from our previous published analysis (see Box 5.1).
We assess annualised household spending on home energy, such as heating and solar panels, as well as on surface transport. This includes both upfront and running costs.
- Home energy upfront costs include technology costs, installation costs (including one-off retrofit costs), financing costs, and savings from policy support such as grants and low interest loans. Home energy includes both heating technologies and solar panels.[368] We do not include home batteries due to modelling limitations.
- Home energy running costs include costs of heating, cooking, lighting, and other home energy use, as well as maintenance costs and standing charges. Where applicable, this also includes time-of-use tariffs and solar panels.
- Transport upfront costs include purchase costs and costs of capital for petrol or diesel cars, electric cars, and at-home chargers. Running costs include costs of fuel, charging, car maintenance, insurance, and policy costs such as vehicle taxes, fuel duty, and planned electric vehicle (EV) per mile charges.
- Upfront costs are annualised over the lifetime of the technology. For heat pumps, we split costs into longer-term home upgrades (for example, upgrading radiators) and technology costs (for example, the cost of the heat pump itself), with varying lifetimes.
We assess costs based on current prices and current and planned policies, including policies announced in the 2025 Budget and the 2026 Warm Homes Plan. We assume households take up government grants and low-cost loans where they are available, based on UK Government policy. In some cases, policy in Scotland, Wales and Northern Ireland differs. In the analysis we define ‘savings today’ to include some announced policies (for example, low-interest loans or EV per mile charges) that may only be introduced in the next few years, up until 2028. We do this to present a full picture of the most relevant current and planned policies. Electricity and gas prices are modelled under two scenarios, before and following the start of the Iran war, so that the analysis is not skewed by current high fossil fuel prices (Table 5.1).
We model a typical ‘fossil fuel household’ with a petrol car and a gas boiler, compared to an ‘electric household’ with an electric car, an air source heat pump, and solar panels. In addition to our typical UK household, we have modelled the costs and savings for low-income, high-income, and rural household archetypes when they switch to electric technologies today, under current and planned policies.
- The typical household is based on median (or modal, where there are a range of discrete options) household characteristics for the UK. For a fossil fuel household this is a semi-detached, owner-occupied house with a gas boiler and one petrol car. We assume this household has the same energy demand as Ofgem’s typical dual fuel household (based on the Q2 2026 demand assumptions).[369] Its electric counterpart swaps the gas boiler and petrol car for an air source heat pump, solar panels (where stated), and an electric car. We assume both petrol and electric cars are purchased in the used car market.
- We vary the low- and high-income archetypes’ home energy consumption, property floor area, and car mileage based on average values for the lowest and highest income quintiles. The rural household archetype has a detached house and switches from an oil boiler to a heat pump, and from a diesel car to an electric car. It has relatively high floor area, heat demand, and car mileage. The high-income household archetype is the only one which buys a new car. A new electric car is assumed to be more expensive, but also more efficient than older models.
- Overall, these factors determine the size of heat pump required (and therefore the upfront installation cost), the amount of energy consumed for heating and other uses (for example lighting and cooking), the upfront cost of their car, and the amount they drive. We also assume differing policy support across the archetypes (Table 5.1 and Table 5.2). We assume heat pumps with a seasonal coefficient of performance (SCOP) of 2.94, but test how our results vary with heat pumps with an efficiency of 3.86.[370];[371]
We draw on published data to estimate the usage and rates of time-of-use tariffs and solar panels.
- For electric cars, if a home has an at-home charger, we assume all their at-home charging is on the off-peak time-of-use tariff rate in any scenario, whether or not they use a time-of-use tariff for heating. We base the split and tariffs of charging at home, on rapid/ultra-rapid and slow on-street charging based on Zapmap data.[372];[373]
- For home heating, we model a tri-rate time-of-use tariff with off-peak and peak rates that are 50% higher and lower than the standard rate. We assume that a typical household with a heat pump can shift approximately two-thirds of electricity demand from peak hours onto standard and off-peak hours.[374];[375] When we refer to households being on a time-of-use tariff, it is this tariff that we are referring to. When we refer to households not having a time-of-use tariff, that refers to their heating demand (they are still assumed to use off-peak charging for an electric car if they have at-home charging).
- We use Microgeneration Certification Scheme (MCS) data to estimate average capacity and upfront costs of solar panels.[376] We use MCS data on solar yield across roof angles, orientations, and geographies to estimate the average solar yield for households where the inclination, orientation, and/or geography is favourable. Solar panel maintenance costs are based on government published estimates, and the export tariff rate is based on the modal current rates from the largest suppliers.[377]
We present our findings on costs and savings rounded to the nearest £10.
| Table 5.1 Current policy assumptions |
|
|
Buildings |
|
|
Transport |
|
|
Energy prices |
|
|
Notes: (1) For buildings we model policies largely based on the Warm Homes Plan, which covers the UK but includes some support that is only available in England, or in England and Wales. While low-cost financing will be available across Great Britain, the £7,500 BUS grant is only available in England and Wales. The Home Energy Scotland grant is also £7,500 for most households, with higher levels available for rural households and for some low-income households through Warmer Homes Scotland. The Warm Homes: Local Grant is only available in England. Northern Ireland’s Affordable Warmth scheme does not include heat pump support. Transport policies modelled would apply across the UK. Changes to electricity and gas prices will be across Great Britain. (2) We use the Q2 2026 price cap for our scenario before the Iran war because the Q2 2026 price cap was set before the start of the Iran war. (3) Upfront grants for new electric cars under £37,000 are not explicitly modelled, as none of our archetypes meets the criterion of buying a new car under £37,000. However, the grants may affect the market prices that we use in our modelling. (4) Although we model the Warm Homes: Local Grant, following the closure of ECO the number of low-income households accessing grant support for heat pumps is likely to significantly decrease. |
|
| Table 5.2 Assumed costs and grant support for household technologies | ||||
| Low-income household | Typical household | High-income household | Rural household | |
| Costs | ||||
| Petrol car | £2,956 (used) | £12,639 (used) | £47,587 (new) | £20,328 (used) |
| Electric car | £3,560 (used) | £12,639 (used) | £54,617 (new) | £20,328 (used) |
| At-home charger | £993 | £993 | £993 | £993 |
| Solar panels (kit plus installation) | £8,620 | £8,620 | £8,620 | £8,620 |
| Fossil fuel boiler | £2,519 (gas boiler) | £2,609 (gas boiler) | £2,729 (gas boiler) | £2,355 (oil boiler) |
| Heat pump (capital cost) | £8,178 | £9,361 | £10,940 | £11,038 |
| Heat pump (ancillary/installation costs) | £4,797 | £5,856 | £6,420 | £6,269 |
| Grant support available | ||||
| Grant support for heat pump | Full cost up to £15,000 | £7,500 | £7,500 | £9,000 |
| Grant support for solar panels | Full cost up to £15,000 | £0 | £0 | £0 |
| Notes: (1) Most used electric cars under ten years of age have reached price parity with the equivalent internal combustion engine (ICE) model (except for those that are only one or two years old). We assume our typical household and rural household archetypes face no additional upfront cost in purchasing a used EV, beyond the cost of an EV charger. Our low-income archetype buys a used car that costs £600 more than a used petrol car would have cost, as we assume that due to limited availability of old EVs, they buy a newer EV model than they would have otherwise. (2) The high-income archetype buys a new EV, which carries a 15% price premium compared to the equivalent ICE. This is based on Autotrader data from March 2026, weighted across car models. This is a relatively conservative assumption as some new EV models have now reached price parity with ICEs (see Section 4.3.2). As the cost of the car is over £37,000, they are not eligible for a grant. (3) We assume a heat pump with a seasonal coefficient of performance (SCOP) of 2.94 but test how our results vary with a heat pump with an efficiency of 3.86. (4) We do not include batteries in our analysis due to modelling constraints. (5) We assume all household archetypes have at-home charging, as around two-thirds of households do. However, we include a sensitivity to test how costs and savings change if there is not access to an at-home charger. (6) We include maintenance costs for each technology. (7) Heat pump capital costs and ancillary/installation costs vary across household archetypes because they are affected by household heat demand and floor area. For example, the rural household archetype has relatively high floor area and heat demand, and so higher heat pump costs compared to the other archetypes. (8) We assume that heat pumps have a lifetime of 15 years, supporting heating systems have a lifetime of 50 years, cars and EV chargers have a lifetime of 15 years, and solar panels have a lifetime of 25 years. | ||||
Box 5.1
Comparison with analytical approaches in previous publications
There are key differences between this analysis and the approach used in our advice on the Seventh Carbon Budget and in our Supplementary Analysis of the Seventh Carbon Budget.[378];[379]
- This analysis assesses costs of switching today, rather than over the period from 2025 to 2050. This allows us to use current prices (for example, retail energy prices) rather than projections, and current or planned policies, so we can assess what the transition means for household bills and incentives today.
- This analysis includes a wider range of technologies and evidence than in the Seventh Carbon Budget advice. Key additions include rooftop solar, use of time-of-use tariffs for home energy and EV charging, and inclusion of used car data.
- This analysis is focused on the implications of government policy for individual household costs and savings and does not consider economy-wide cost effectiveness of individual technologies.
- This analysis looks at the impacts of an individual household switching from fossil fuel technologies to electric technologies. It does not look at system-wide implications, which are assessed in our Seventh Carbon Budget advice. The costs of existing government policy are assumed to be met from existing budgets and therefore do not impact taxes, borrowing, or other government spending.
- In previous analysis, we presented quantified co-impacts alongside household costs. We do not do this here as our assessment has not changed since the publication of our Supplementary Analysis.
- Fuel duty was excluded in our Seventh Carbon Budget advice for all calculations for petrol, diesel, and electric cars. We assumed there would be policy in place to maintain current levels of taxes but could not model what policy design would be in 2050. As the analysis in this chapter focuses on current and planned policies, we include fuel duty and per mile charges for EVs which were announced in Budget 2025.
- In this chapter we use the term ‘costs’ to refer to the real-world prices faced by households. This is distinct from the use of the term ‘costs’ in Chapter 4 of our Seventh Carbon Budget advice and in our Supplementary Analysis where we discuss whole economy costs, which are distinct from prices.
5.2 Findings
5.2.1 Overall costs and savings for a typical household
Before taking into account the impact on energy prices of the Iran war, current market prices and current and planned government policies mean that a typical UK household will face lower costs with an electric car and a heat pump, compared to if they had a gas boiler and a petrol car. This relies on them accessing at-home EV charging (Figure 5.1). The same is true for our low-income and rural household archetypes.
- Savings are caused by lower driving costs, which bring annual savings of £470. This is dependent on the household having access to at-home charging, which around two-thirds of households have.[380]
- If home heating costs are considered in isolation, the typical household does not make a saving on combined home energy upfront costs and running costs by switching to a heat pump. However, if they also switch to a time-of-use tariff, they make a saving on home energy and running costs of £140 per year. If they switch to a heat pump, time-of-use tariff, and solar panels, this saving is £460 per year.
A similar pattern, but with greater savings from low-carbon technologies, is seen when we take into account increases in energy prices following the start of the Iran war.
- Under energy prices following the start of the Iran war, the typical household saves £570 per year on combined upfront and running costs if it switches to an electric car today, provided it has at-home charging. It saves a further £640 per year on combined upfront and running costs if it switches to a heat pump, time-of-use tariff, and solar panels.
| Figure 5.1 A typical household’s annual spend on home energy and transport with fossil fuel and electric technologies |
 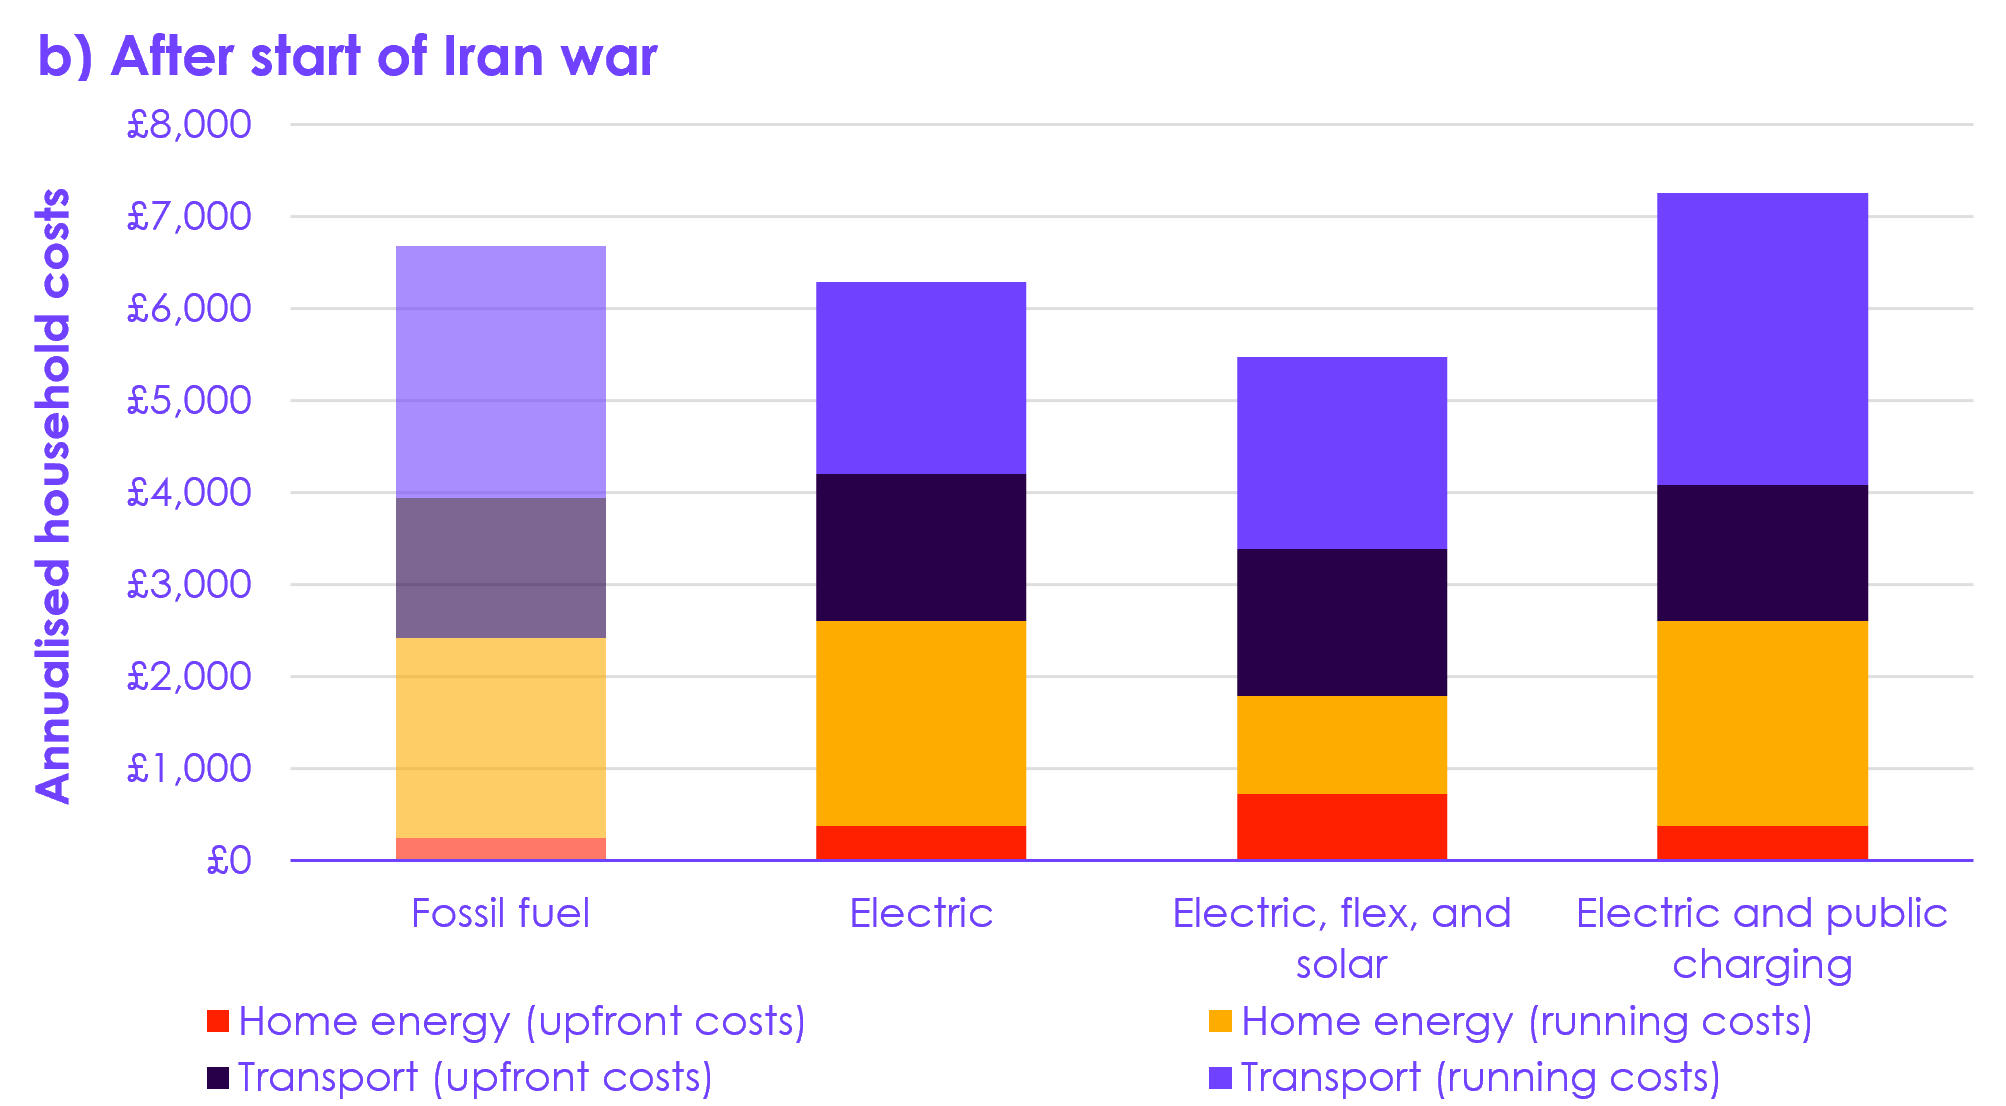 Description: The typical household saves money when switching from fossil fuel to electric technologies if they charge their electric cars at home. Savings from switching are higher if the household can make use of a time-of-use electricity tariff (‘flex’) and solar. Source: Ofgem (2026) Energy price cap (default tariff) levels; Climate Change Committee (CCC) analysis. Notes: (1) This figure represents the typical annual spend per household on home energy and driving bills (including maintenance and insurance costs), and annualised capital investment on home energy and cars, based on a median UK profile for a fossil fuel or electric household. (2) Home energy upfront costs include technology and installation costs for a gas boiler, heat pump, and solar panels (where labelled) and financing costs, annualised over their assumed lifetime. (3) Home energy running costs include standing charges, heating, cooking, lighting, savings from solar panels, and other home energy use, excluding car charging as this is included in transport running costs. (4) Transport upfront costs include purchase costs and financing costs, and running costs include costs of fuel, charging, car maintenance, insurance, and policy costs such as vehicle taxes, fuel duty, and per mile charges. We do not assess the impact on household bills of any associated changes in the rate of general taxation. (5) Energy prices before the Iran war draw on the energy price cap for Q2 2026 and heating oil, petrol, and diesel prices from Q1 2026. Prices following the start of the Iran war draw on the energy price cap for Q3 2026, and heating oil, petrol, and diesel prices from Q2 2026. (6) The bars for fossil fuel homes are given in a lighter shade to highlight the differences. (7) We assume the household accesses available government grants and loans. (8) We assume the household charges their electric car at home using an off-peak tariff rate, except for the ‘public charging’ scenario, where they charge their electric car with public charge-points. |
5.2.2 Impact of the energy price shock following the start of the Iran war
Ongoing global energy price volatility is leading to increased energy retail prices and energy price volatility for households. Between February and April 2026, heating oil prices almost doubled, and petrol and diesel prices rose by a fifth and a third respectively. Between Ofgem’s Q2 2026 and Q3 2026 price caps, electricity and gas prices have risen by 6% and 28% respectively. Around three-quarters of a typical household’s driving and home energy bills come from the direct use of fossil fuels in cars and gas boilers.[381] Households with electric technologies see significantly smaller bill increases as a result of the shock than households with fossil fuel technologies, particularly with a time-of-use tariff and solar panels.
- For a typical household, the impact on bills from recent energy price increases has been almost four times more if it has a gas boiler and a petrol car than if it has a heat pump and an electric car. For a rural household with an oil boiler and a diesel car, it is 10 times more.
- Energy price increases following the start of the Iran war would lead to a £440 increase in annual energy costs for a typical household with a gas boiler and petrol car. A typical household with a heat pump and electric car would see a smaller bill increase of £120.
- A rural household with an oil boiler and a diesel car would see a £1,700 annual increase in household costs, compared to £170 for the same household with a heat pump and an electric car (Figure 5.2).[382]
- Overall, the annual saving on upfront and running costs for a rural household with an oil boiler and a diesel car when switching to a heat pump and electric car has increased from £350 to £1,880 per year. It would be even higher if the household also switched to solar panels and a time-of-use tariff.
In this context, it is all the more important to support households to switch to more efficient electric technologies. It remains to be seen whether energy prices will increase further through 2026.
| Figure 5.2 Increase in annual energy bills for a rural household before and after the start of the Iran war |
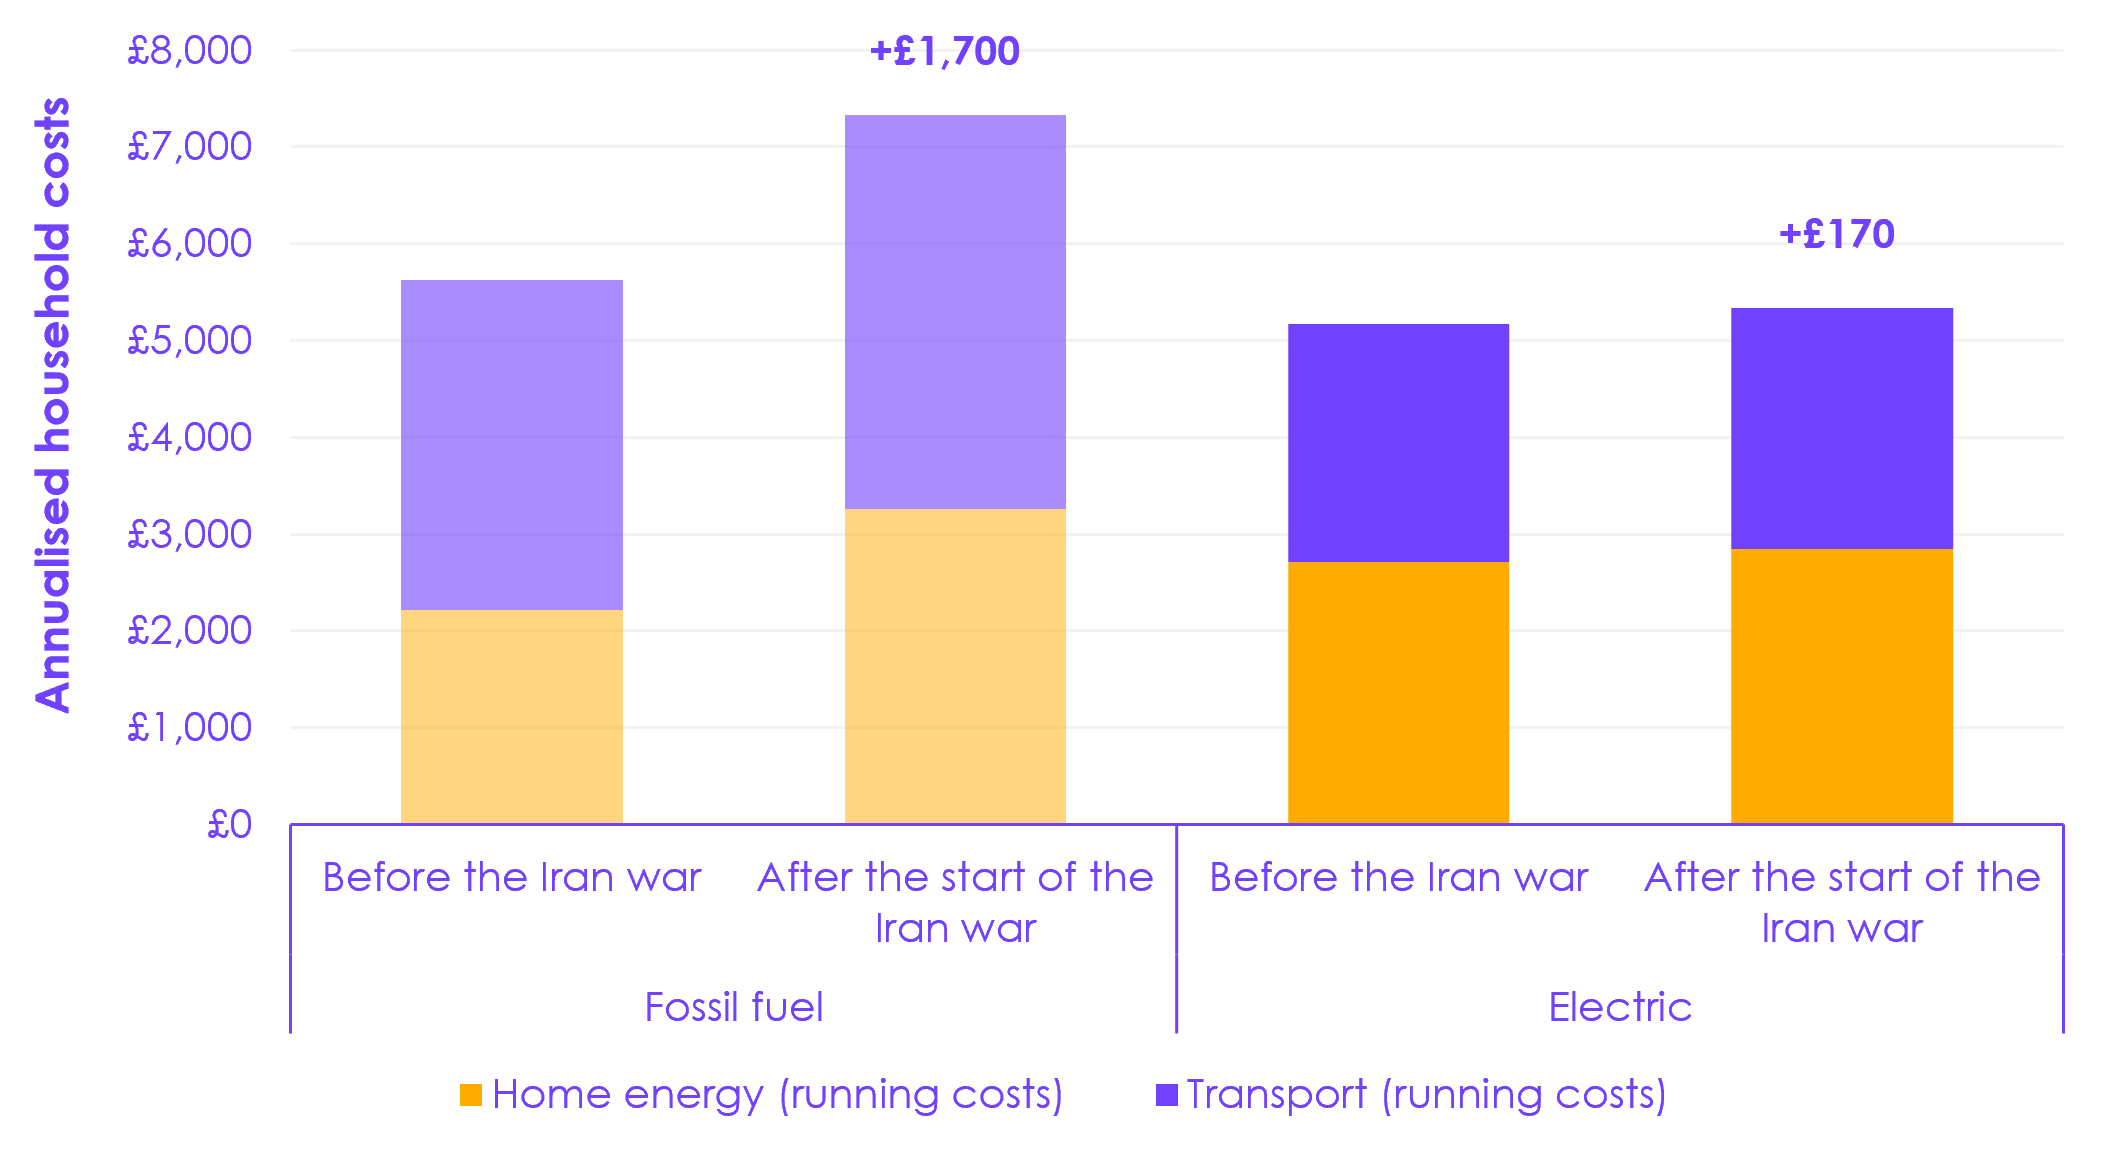 Description: A rural household with an oil boiler and a diesel car would face an increase in annual energy costs of over £1,700 following the start of the Iran war. If instead they had a heat pump and an electric car, their running costs would increase by £170. Source: Ofgem (2026)Energy price cap (default tariff) levels; CCC analysis. Notes: (1) Home energy running costs include standing charges, heating, cooking, lighting, savings from solar panels, and other home energy use, excluding car charging as this is included in transport running costs. Transport running costs include costs of fuel, charging, car maintenance, and policy costs such as vehicle taxes, fuel duty, and per mile charges. (2) Energy prices before the Iran war draw on the energy price cap for Q2 2026 and heating oil, petrol, and diesel prices from Q1 2026. Prices following the start of the Iran war draw on the energy price cap for Q3 2026, and heating oil, petrol, and diesel prices from Q2 2026. (3) The bars for fossil fuel homes are given in a lighter shade to highlight the differences. (4) Numbers displayed are rounded to the nearest £10. |
5.2.3 Cars
A typical household saves money overall by switching to an electric car, provided they have access to at-home charging (Figure 5.3). This underlines the importance of the Government reviewing the cost of public charging, and unblocking barriers to cross-pavement charging (see Section 4.3.2).
- All of our household archetypes, except for the high-income household, save by switching from a petrol or diesel car to an electric car. Transport savings are largely caused by lower running costs. Savings range across archetypes from £350–£950 when we assume energy prices before the Iran war, rising to £450–£1,580 when we factor in the increase in energy prices following the start of the Iran war.
- Our high-income household archetype pays a 15% price premium for a new electric car compared to the equivalent petrol car. Despite this, provided they have at-home charging, they make a saving on overall costs when the increase in prices following the start of the Iran war is factored in.[383]
- As of April 2026, certain models of new electric car are cheaper than their petrol or diesel car equivalent (see Section 3.2.2). We expect that in the next two years, the cost of a new electric car will be the same as the cost of an equivalent new petrol or diesel car, across the market.
- If our high-income household archetype bought a new electric car at price parity with the petrol or diesel equivalent model, under prices from before the Iran war, they would see a saving of £490 (across total annual upfront and running costs).
- With prices from before the Iran war, all our household archetypes face costs by switching to an electric car if they do not have at-home charging, due to relatively high public charging costs.
- This effect is weaker with prices following the start of the Iran war.
- Some households without at-home charging may be able to make a saving if they minimise reliance on ultra/rapid on-street charging (which we assume is used about a third of the time) or make use of EV charging subscription or charge-sharing models.
- Further savings from switching to an electric car are available to the small number of households with at-home charging who are using vehicle-to-grid charging.
- The analysis in this chapter only considers electric cars, not hybrids, as we assess these are the best option from an emissions perspective. Section 3.2.2 outlines our comparison of plug-in hybrids (PHEVs) with EVs, highlighting that PHEVs deliver only a fraction of the fuel savings to a typical household.
| Figure 5.3 How much different households spend on transport each year |
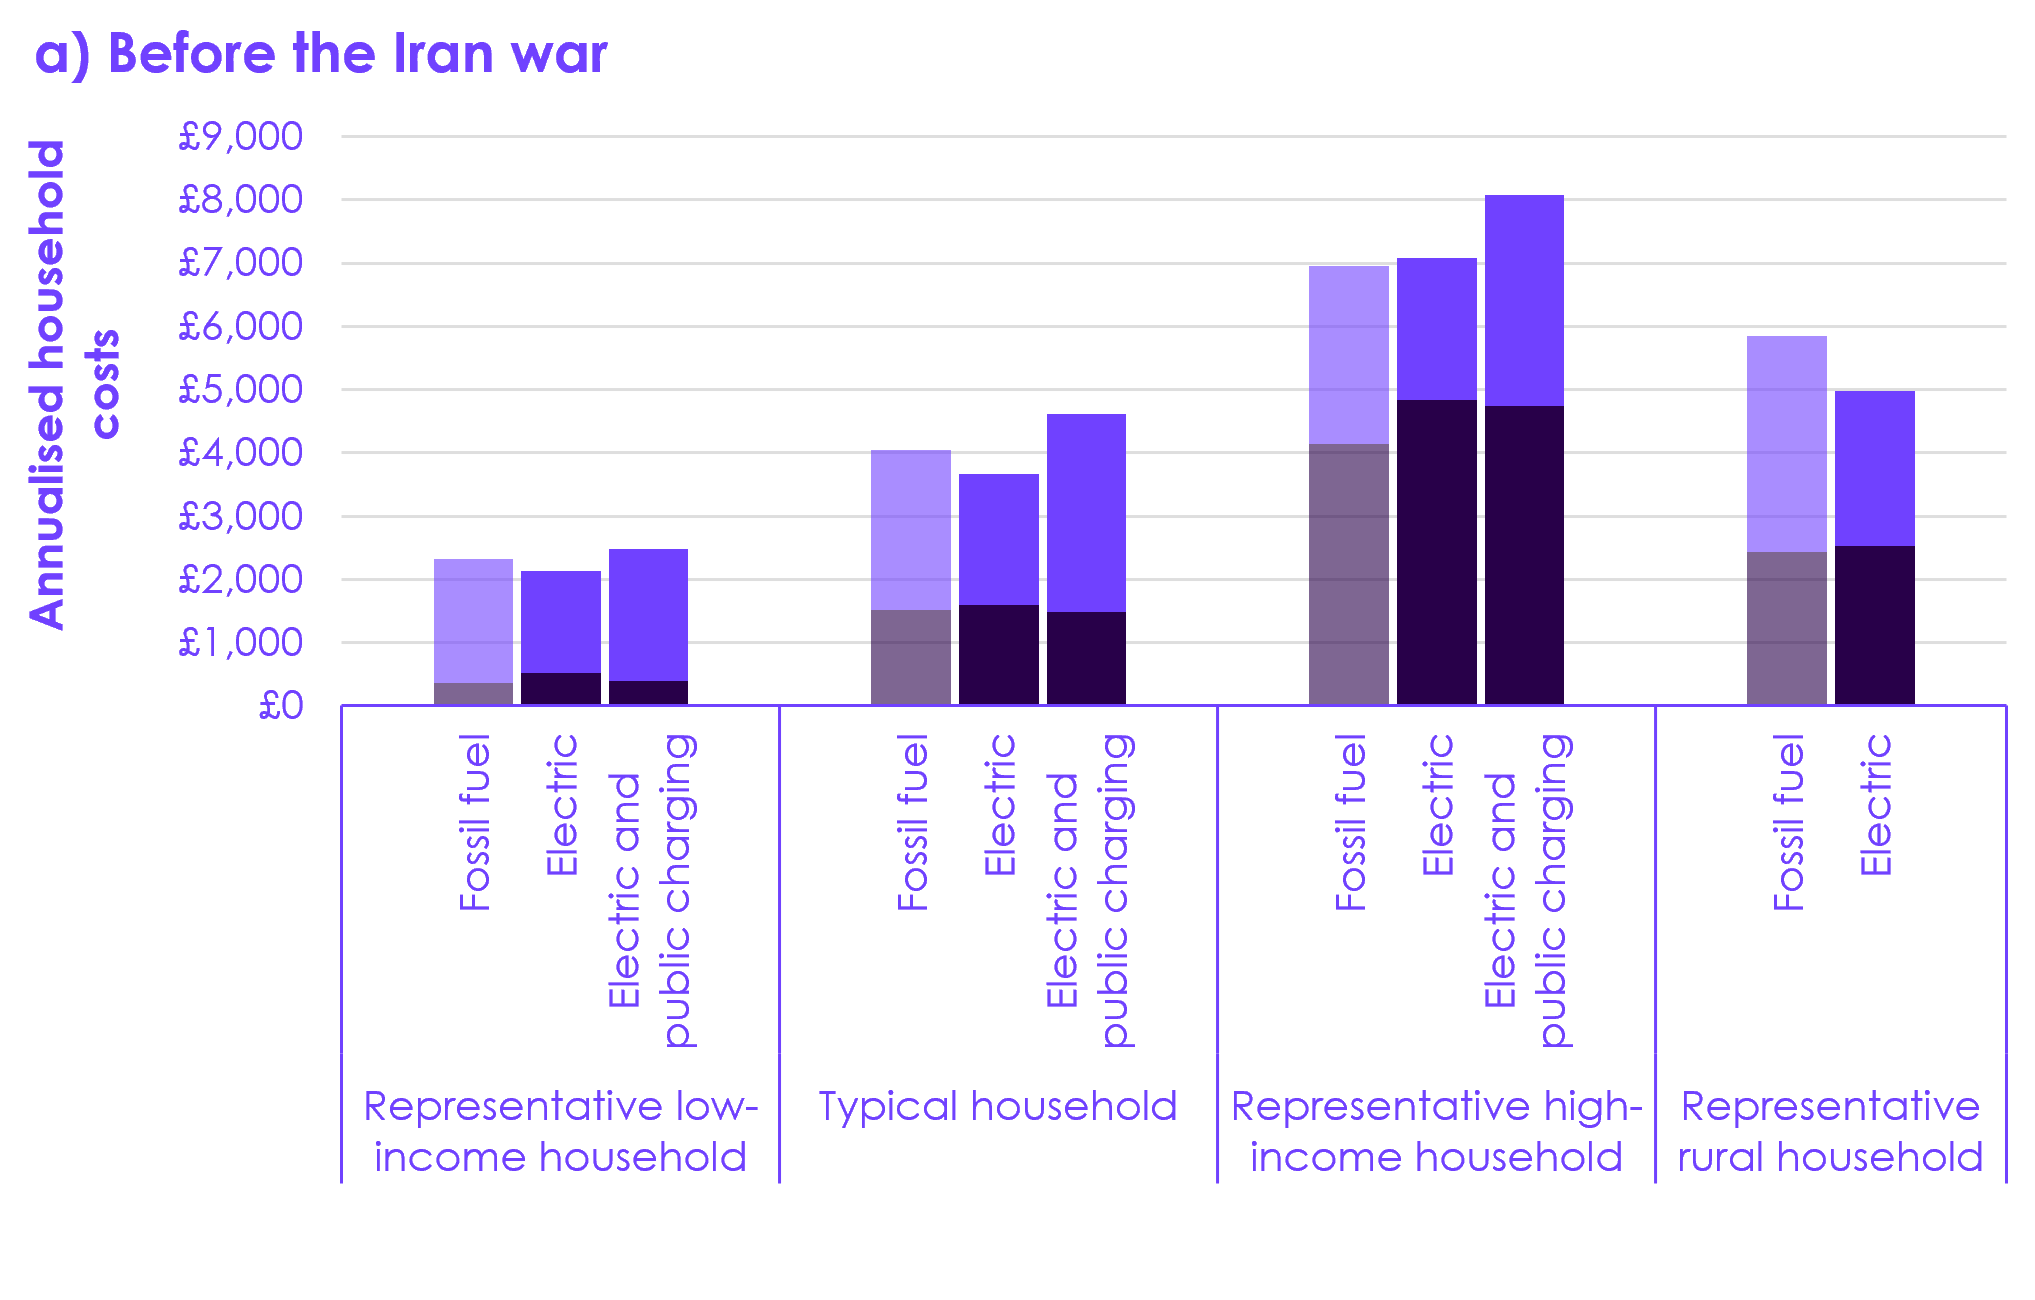 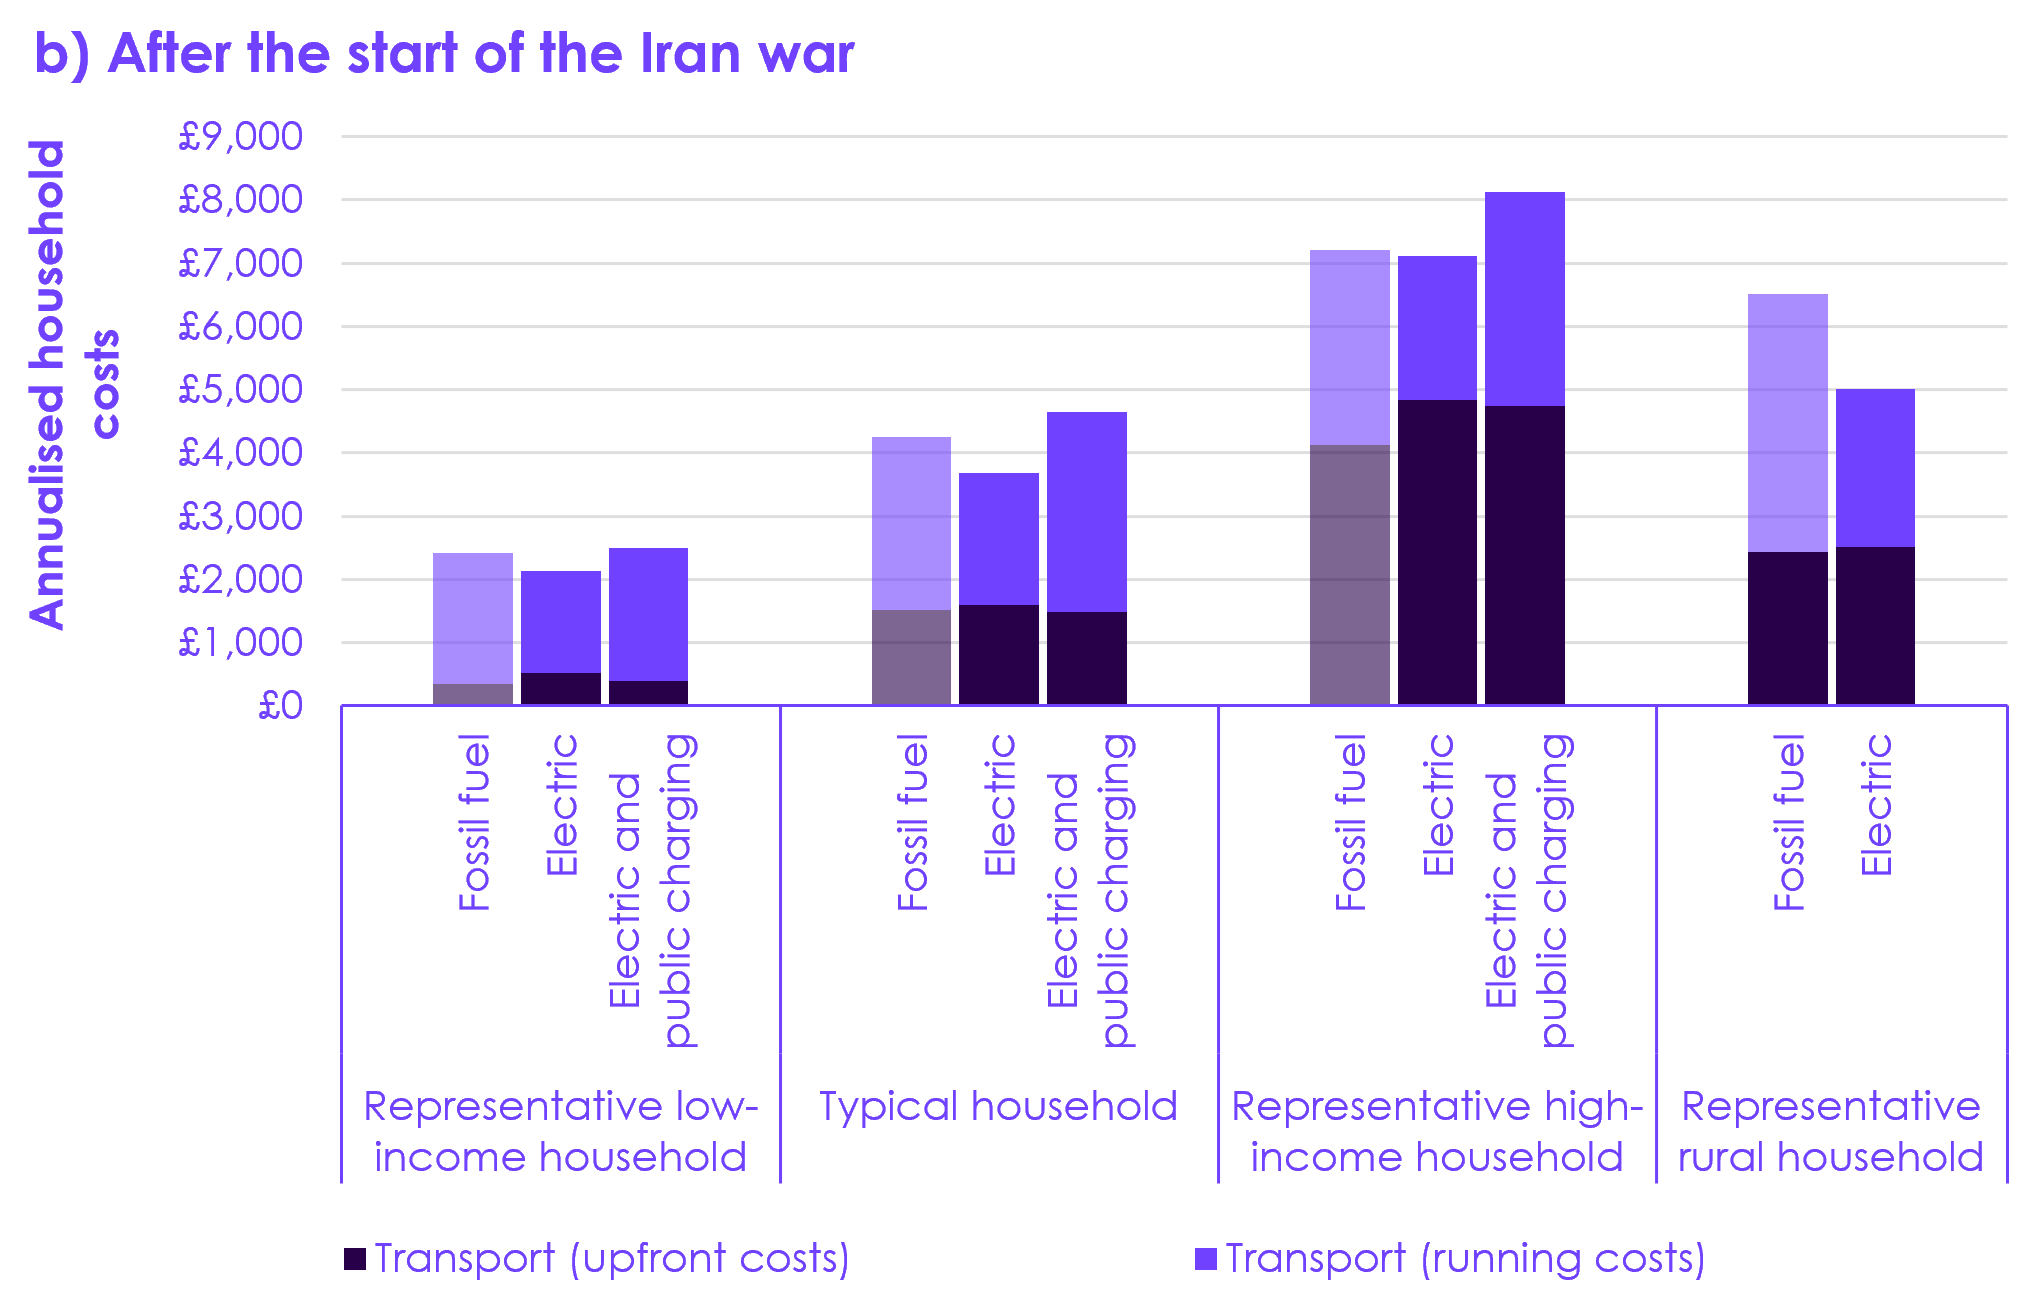 All household archetypes who buy used cars save when switching to an electric car, provided they have access to at-home charging. Source: Ofgem (2026) Energy price cap (default tariff) levels; CCC analysis. Notes: (1) We do not show costs for a rural household without an at-home charger, as we assume most rural detached households have space to install an at-home charger. (2) Energy prices before the Iran war draw on the energy price cap for Q2 2026 and heating oil, petrol, and diesel prices from Q1 2026. Prices following the start of the Iran war draw on the energy price cap for Q3 2026, and heating oil, petrol, and diesel prices from Q2 2026. (3) The bars for fossil fuel homes are given in a lighter shade to highlight the differences. (4) The ‘electric’ scenario is when a household has an electric car and at-home charging, accessing an off-peak time-of-use tariff. The ‘electric and public charging’ scenario is when a household has an electric car but no access to at-home charging. |
5.2.4 Home heating and solar
Many households would face some additional cost over the lifetime of the technology by switching to a heat pump alone, under current conditions. More progress is needed to further lower the lifetime cost of a heat pump relative to a gas boiler. Supporting access to batteries, ensuring high quality installations to maximise the efficiency of heat pumps, and making electricity cheaper can help strengthen the financial case for heat pumps.
- Due in part to policy costs on electricity, the typical household on a gas boiler would currently face additional costs by switching to a heat pump alone, even under prices following the start of the Iran war (Figure 5.4). The same is true for a representative high-income household (Figure 5.5).
- The rural household with an oil boiler also faces additional costs by switching to a heat pump before the Iran war (Figure 5.5). This is not the case following the start of the Iran war due to the high heating oil prices.
- The low-income household archetype sees a saving switching to a heat pump, due to larger grant support. This reflects support available, in England, under the Warm Homes: Local Grant. However, with the closure of the more widely available Energy Company Obligation (ECO) scheme, there is a risk that installations of heat pumps fall, especially in low-income households.
- Making electricity cheaper would help make heat pumps more affordable for some households. We assess that removal of policy costs (Renewables Obligation, Feed-in Tariff, and Warm Homes Discount) and legacy Contract for Difference (CfD) costs from electricity bills, under prices following the start of the Iran war, would lead the typical household to have lower running costs than with a gas boiler. They would almost break even on lifetime cost by switching to a heat pump, even in the absence of solar panels and a time-of-use tariff for heating (Figure 5.6).
- The Government will also provide financial support for batteries, which we have not included due to modelling constraints. Batteries would likely increase the savings households make when switching to a heat pump and a time-of-use tariff.
- Our numbers assume a heat pump with SCOP of 2.94, in line with our Seventh Carbon Budget advice Balanced Pathway assumptions. In our Supplementary analysis of the Seventh Carbon Budget, we noted that recent evidence suggests that the real-world efficiency of a heat pump could be higher than assumed in our analysis for the Balanced Pathway. If the SCOP was higher, due for example to the quality of the installation enabling the heat pump to run more efficiently, running cost savings would be higher.
All our household archetypes make a saving over the lifetime of the technologies if they switch to a heat pump, solar panels, and time-of-use tariff together. This is the case with energy prices from both before and following the start of the Iran war, with larger savings following the start of the Iran war.
- Solar panels and flexible tariffs can enable households who switch from a gas boiler to a heat pump to make savings on their home energy costs.
- If a typical household on a gas boiler chooses to switch to a heat pump, solar panels, and a time-of-use tariff together, they save £460 on combined upfront and running costs (Figure 5.4). This saving is even larger in the context of prices following the start of the Iran war. A similar pattern is true for our high-income, low-income, and rural household archetypes.
- Time-of-use tariffs present a saving to the household while bringing system-wide benefits, as the household is shifting its electricity consumption to times when it is cheaper to produce.
- Solar panels can bring savings to those households for whom they are suitable (see below). Solar panels generate less electricity in winter months, when heating demand is highest, but meet part of winter heating demand in our modelling as well as much of summer hot water demand.
- The upfront cost of solar panels may fall in future, leading to greater annualised household savings.
Not all households are able to access solar panels and households vary in the degree to which they can use time-of-use tariffs. Moreover, even for those households who can access them, the additional savings may be too small to encourage households to switch to a heat pump. This underlines the importance of other actions to improve the incentive to switch to a heat pump, including making electricity cheaper.
- Not all homes are suitable for solar panels. Whether solar panels are a worthwhile investment depends on the combination of location (for example, further north generally receives less sunlight), the inclination of the roof, and the orientation of the roof. Flat owners who do not have a roof will not be able to install rooftop solar, although they may be able to access plug-in solar for some small-scale generation. Rented properties are also less likely to have solar panels, although the recent updates to the private rented sector Minimum Energy Efficiency Standard Regulations should change this by 2030.
- Not all households are in a position to adjust their heating demand and benefit from time-of-use tariffs (for heating). It is unclear how many households are sufficiently well-insulated or have sufficient access to energy storage capacity to adjust their heating demand sufficiently for time-of-use tariffs to make their heat pumps cheaper than a gas boiler. Currently around two-thirds of domestic electricity connections have a smart meter, which is required to access time-of-use tariffs.
- While our analysis factors in the financing costs different households will face, households may be deterred by the upfront costs of a heat pump that remain after the Boiler Upgrade Scheme (BUS) grant, especially in the context of a high cost of living. In addition, the savings from adding a heat pump to a home with solar panels and time-of-use tariffs are relatively small and will be affected by small changes in electricity and gas prices, heat pump efficiency, or heat pump upfront costs. This, alongside the non-financial barriers to installing a heat pump (see Section 4.3.3), means larger savings from heat pumps may be needed for the switch to be worthwhile for some households.
- Installing low-cost insulation measures such as draught proofing and insulating hot water tanks can also help reduce household bills.
| Figure 5.4 Change in a typical household’s annual costs from switching to low-carbon heating today |
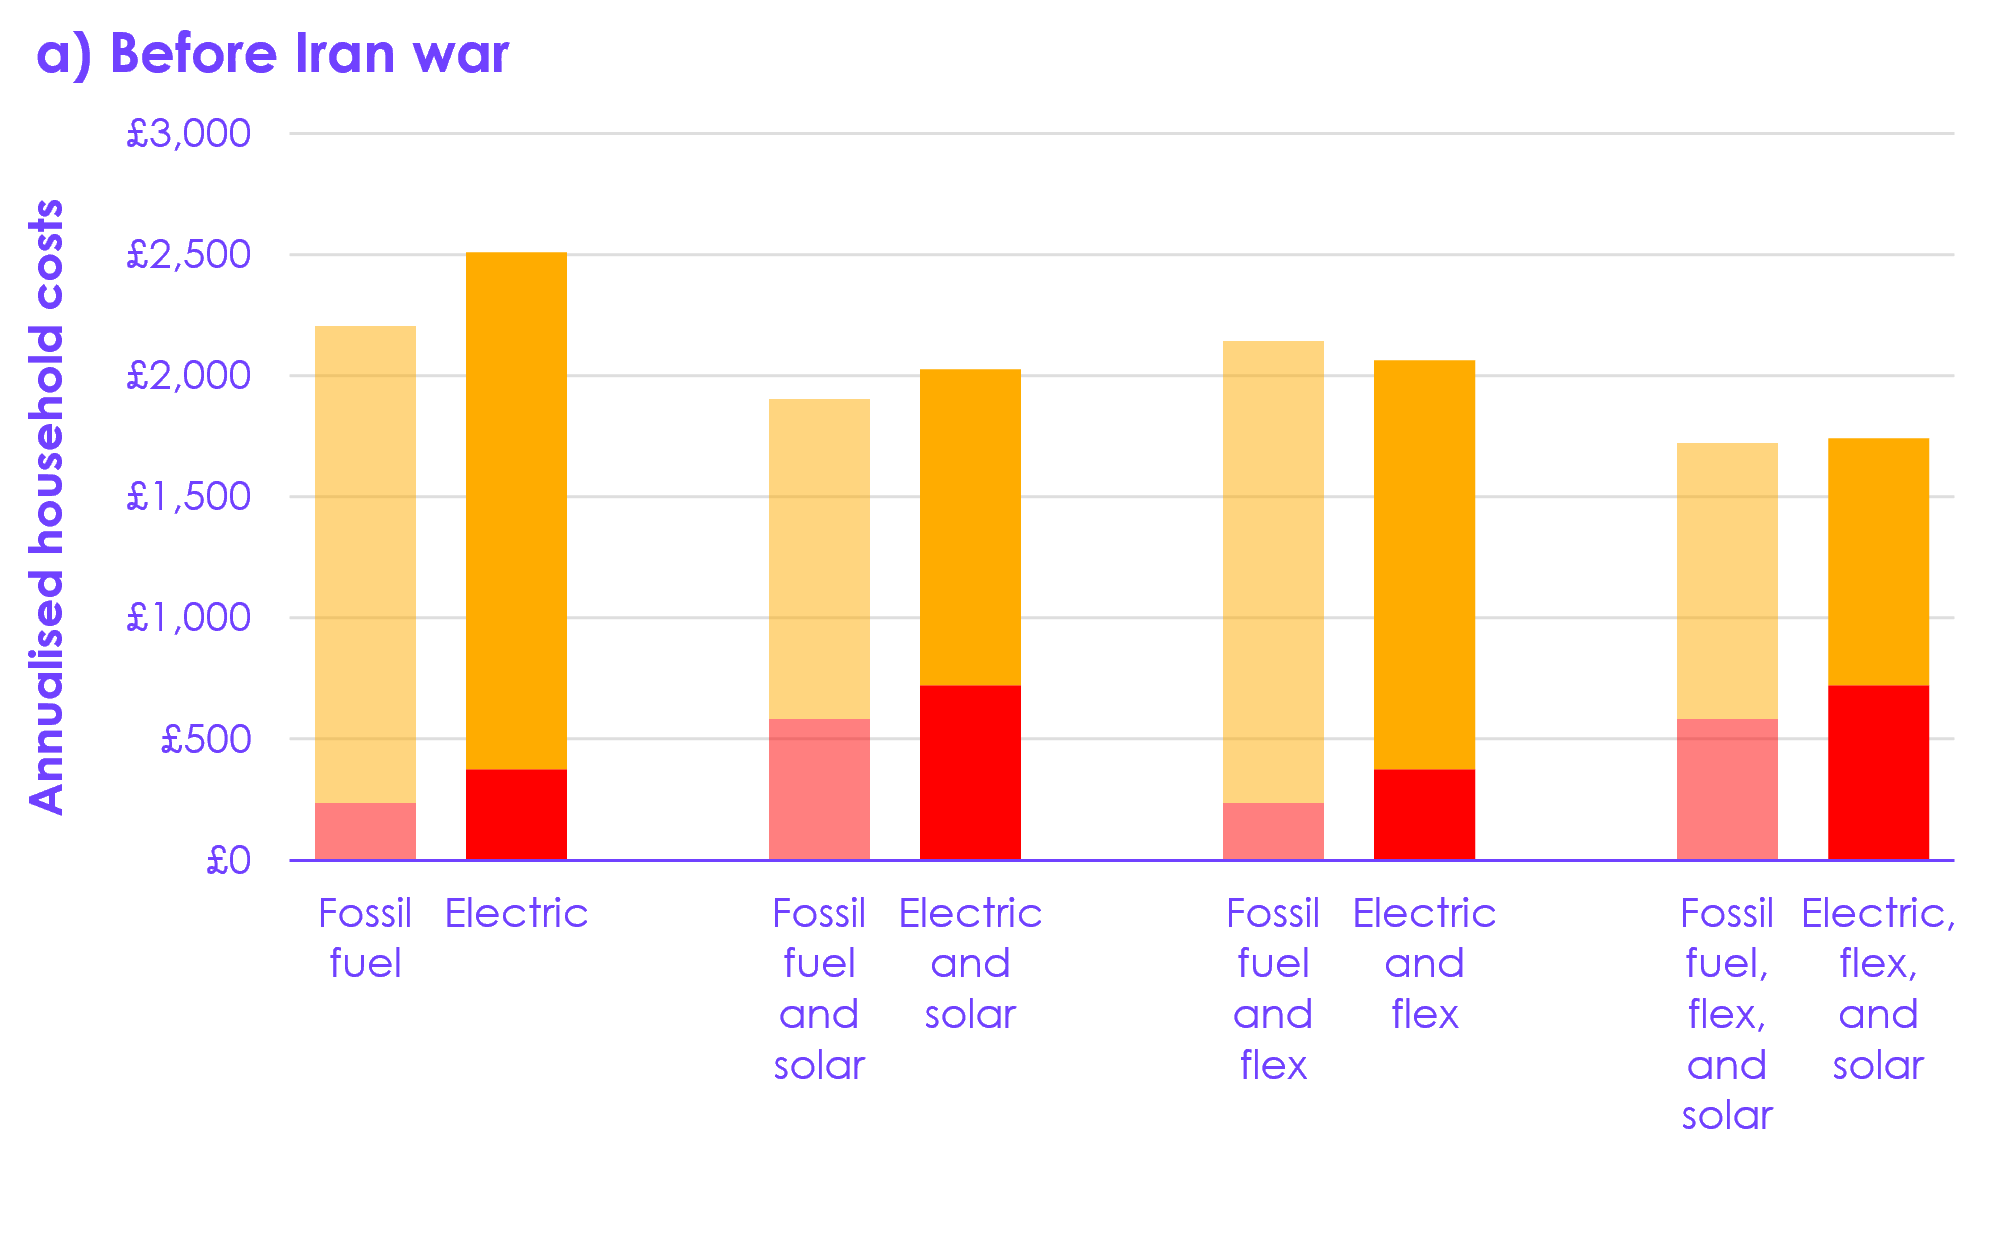  Description: A typical household is incentivised to switch to a heat pump if it already has a time-of-use tariff (‘flex’). Description: A typical household is incentivised to switch to a heat pump if it already has a time-of-use tariff (‘flex’).Source: Ofgem (2026) Energy price cap (default tariff) levels; CCC analysis. Notes: (1) Energy prices before the Iran war draw on the energy price cap for Q2 2026 and heating oil, petrol, and diesel prices from Q1 2026. Prices following the start of the Iran war draw on the energy price cap for Q3 2026, and heating oil, petrol, and diesel prices from Q2 2026. (2) The bars for fossil fuel homes are given in a lighter shade to highlight the differences. (3) We assume each household accesses available government grants and loans. For the low-income household, we assume they receive a Warm Homes: Local Grant to cover the full upfront cost of a heat pump. |
| Figure 5.5 Different households’ annual costs from switching to low-carbon heating today |
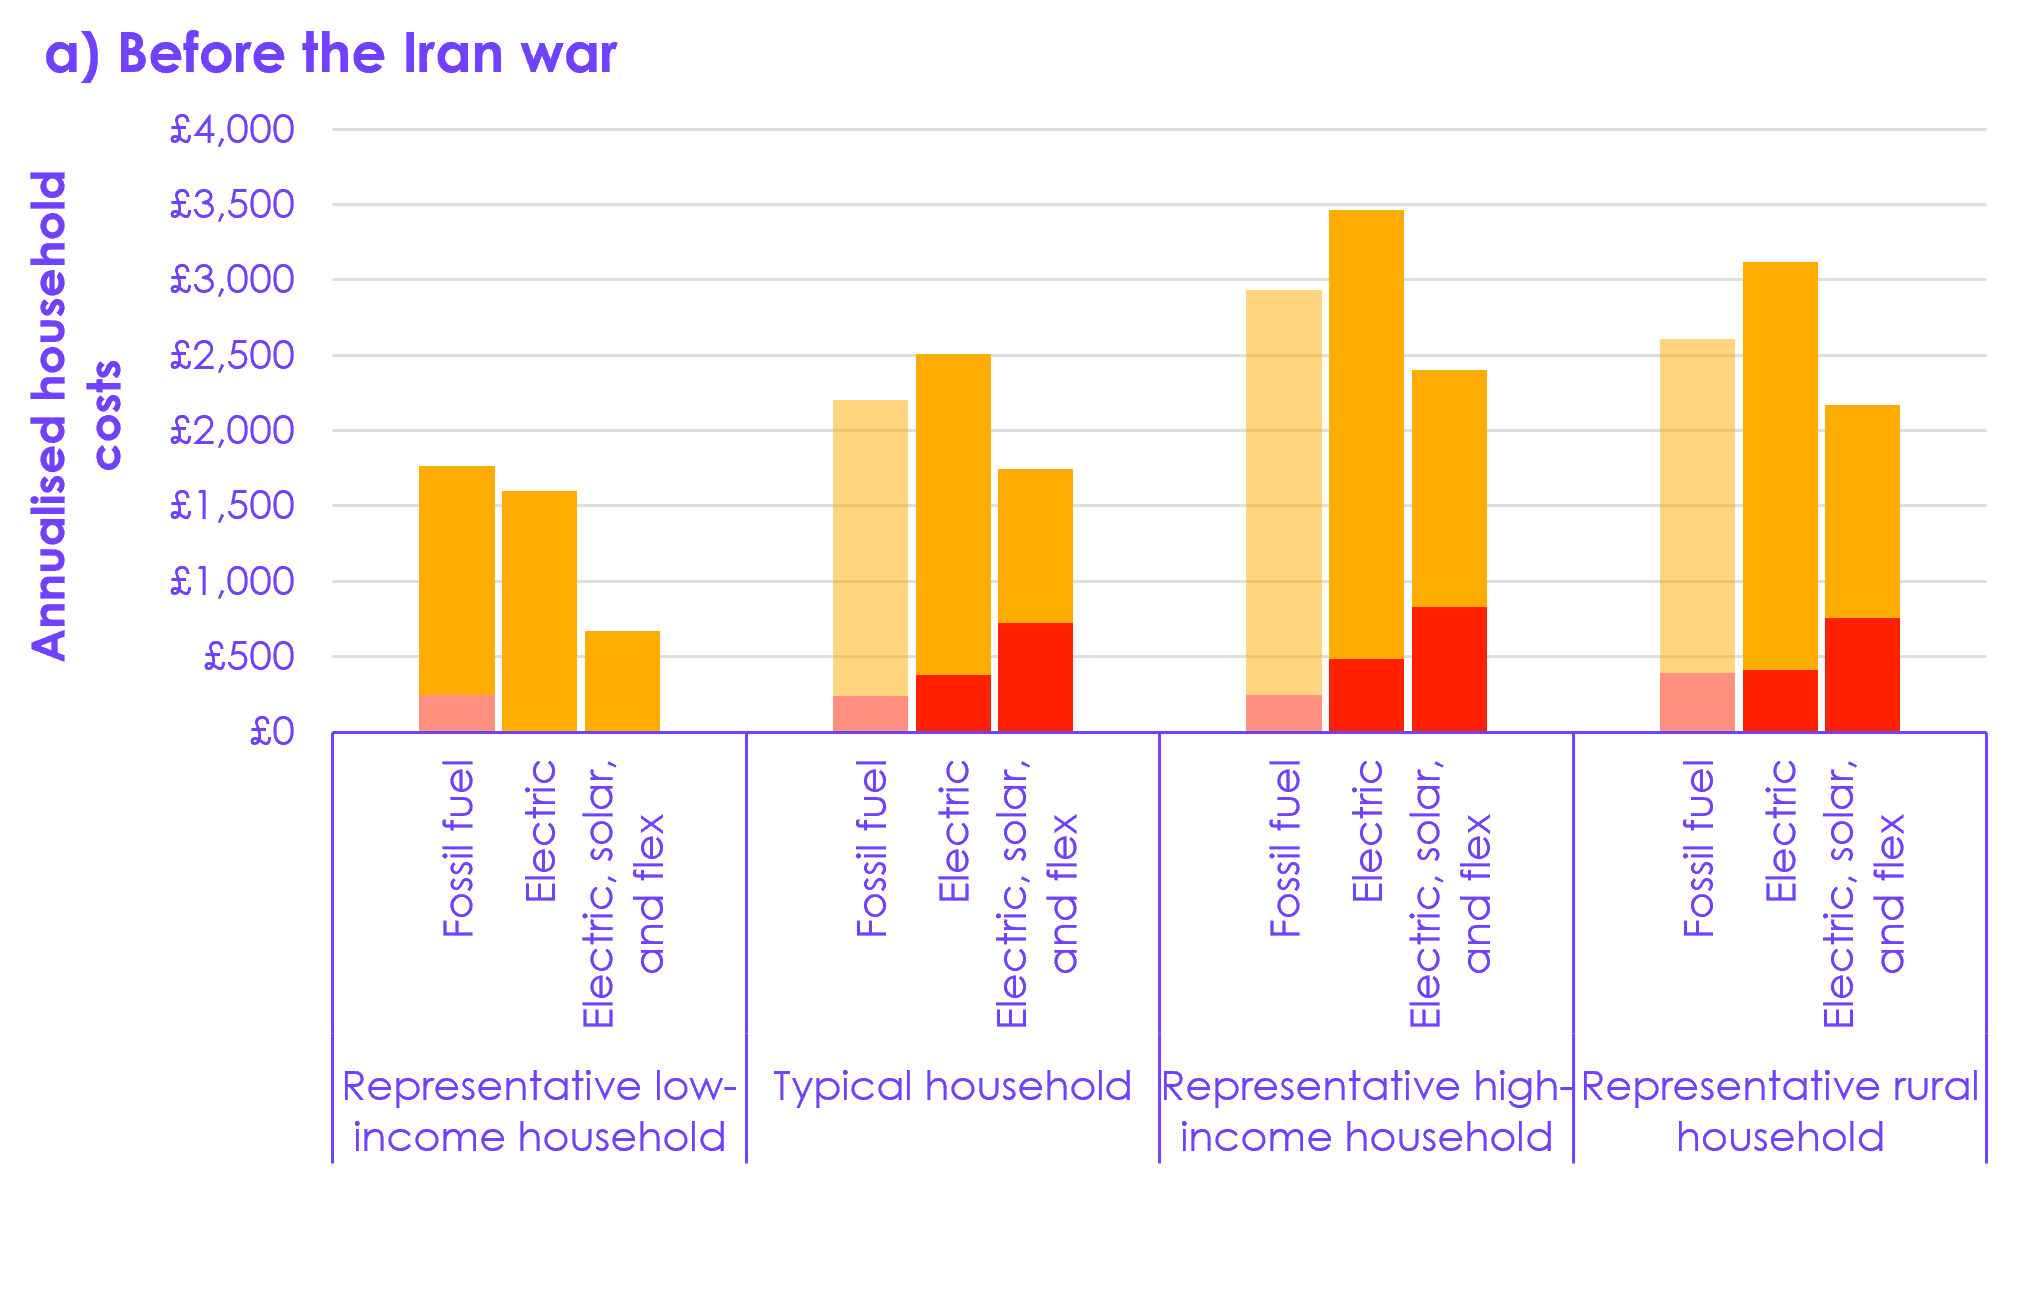 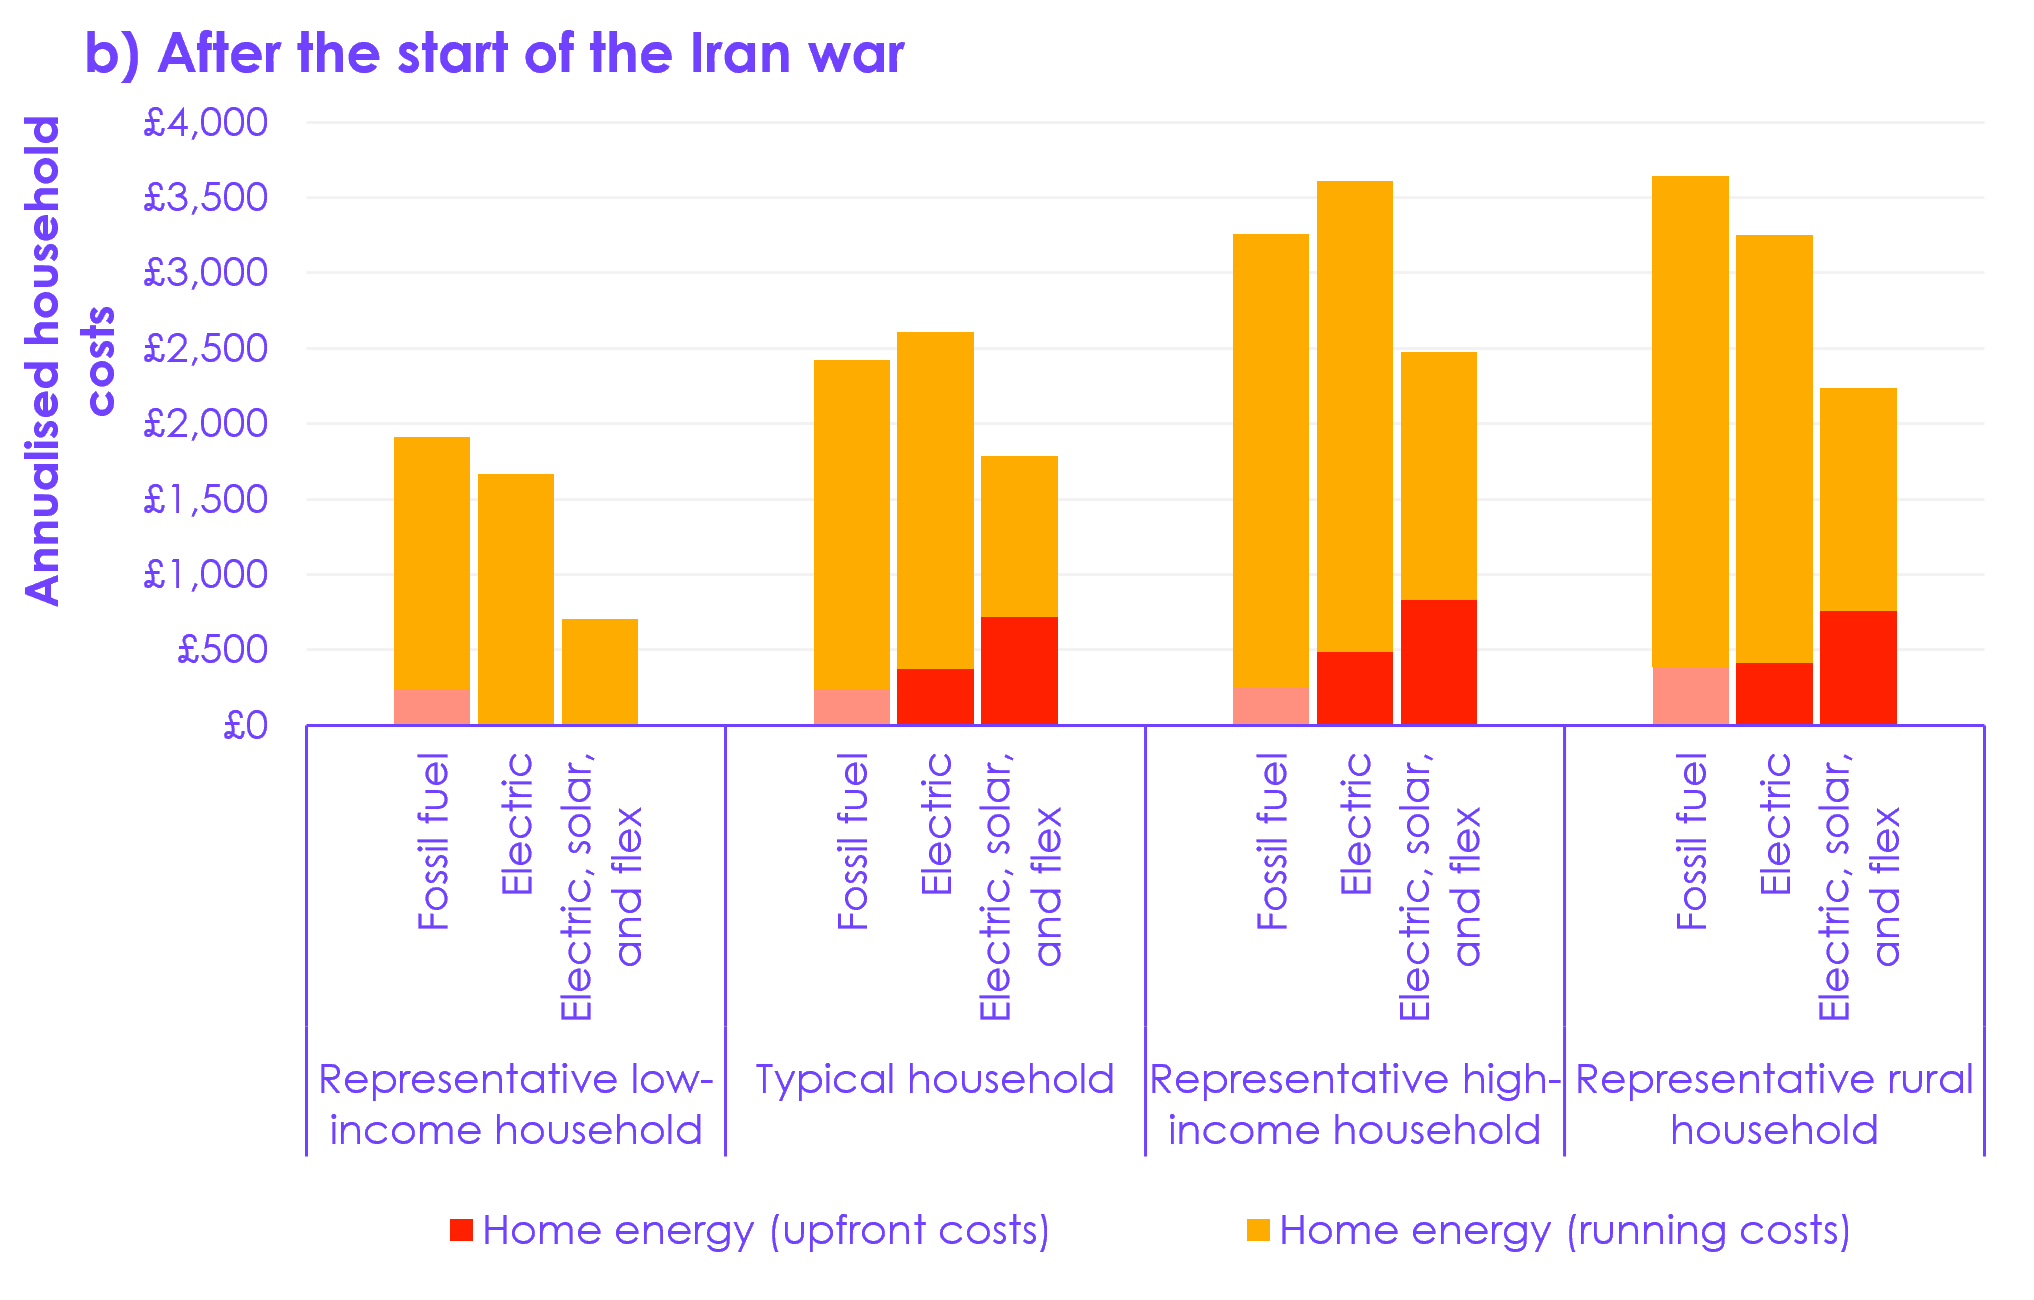
Description: Most household archetypes we model see savings in home energy costs if they switch from a gas boiler to a heat pump, provided they also install solar panels and switch to a time-of-use tariff (‘flex’). Savings are greater in the context of the recent energy price shock. |
5.2.5 Making electricity cheaper
The Government’s removal of some policy costs from electricity bills in November 2025 contributed to the electricity-to-gas ratio decreasing from 4.7:1 in Q1 2026 to 4.3:1 in Q2 2026. While this was a welcome step, the electricity-to-gas price ratio increased from 3.9:1 in Q2 2025, due in part to falls in the wholesale cost of gas before the Iran war (see Section 3.2.3).[384] As of May 2026, the ratio for Q3 2026 is due to be 3.6:1, with prices reflecting the impact of the Iran war. The ratio that would be sufficient for a household to break even on lifetime costs by switching to a heat pump varies across household circumstances (Table 5.3).
Removal of remaining policy costs (Renewables Obligation, Feed-in Tariff, and Warm Homes Discount) and legacy CfD costs would bring down the electricity-to-gas price ratio to 3.1:1 under prices following the start of the Iran war. This would be almost enough for a typical household with a £7,500 grant to break even on lifetime cost if they installed a heat pump with a SCOP of 2.94 (in line with our Seventh Carbon Budget advice), on a standard tariff for heating (Table 5.3). The Government should look to remove these, as well as other policy costs and levies that artificially increase the price of electricity.
Our Seventh Carbon Budget advice citizens’ panel was clear that they would want a heat pump to pay back positively over its 15-year lifetime, rather than simply breaking even. For households who can use time-of-use tariffs, removing policy costs would be sufficient to achieve this in many cases. However, not all households are able to adjust their energy demand profile and benefit from a time-of-use tariff. For others, further action to reduce heat pump lifetime costs relative to boilers is likely to be needed.
- Under prices from before the Iran war, a typical household on a time-of-use tariff would make a saving with a heat pump with efficiency 2.94 (as they require only a ratio of 5:1 to break even on lifetime cost). To make a saving of £2,000 over the lifetime of the heat pump, they would require a ratio of 4.1:1 or lower. The saving would be even larger if the SCOP was increased to 3.86 (Table 5.3).
- However, households vary in the degree to which they can make use of time-of-use tariffs. A typical household with a heat pump with efficiency 2.94, on a standard tariff, and receiving a £7,500 grant, would require a ratio of 2.4:1 in order to make a £2,000 saving over the lifetime of the heat pump, rather than simply breaking even.
| Figure 5.6 Effect of removing electricity policy costs on a typical household’s home energy costs |
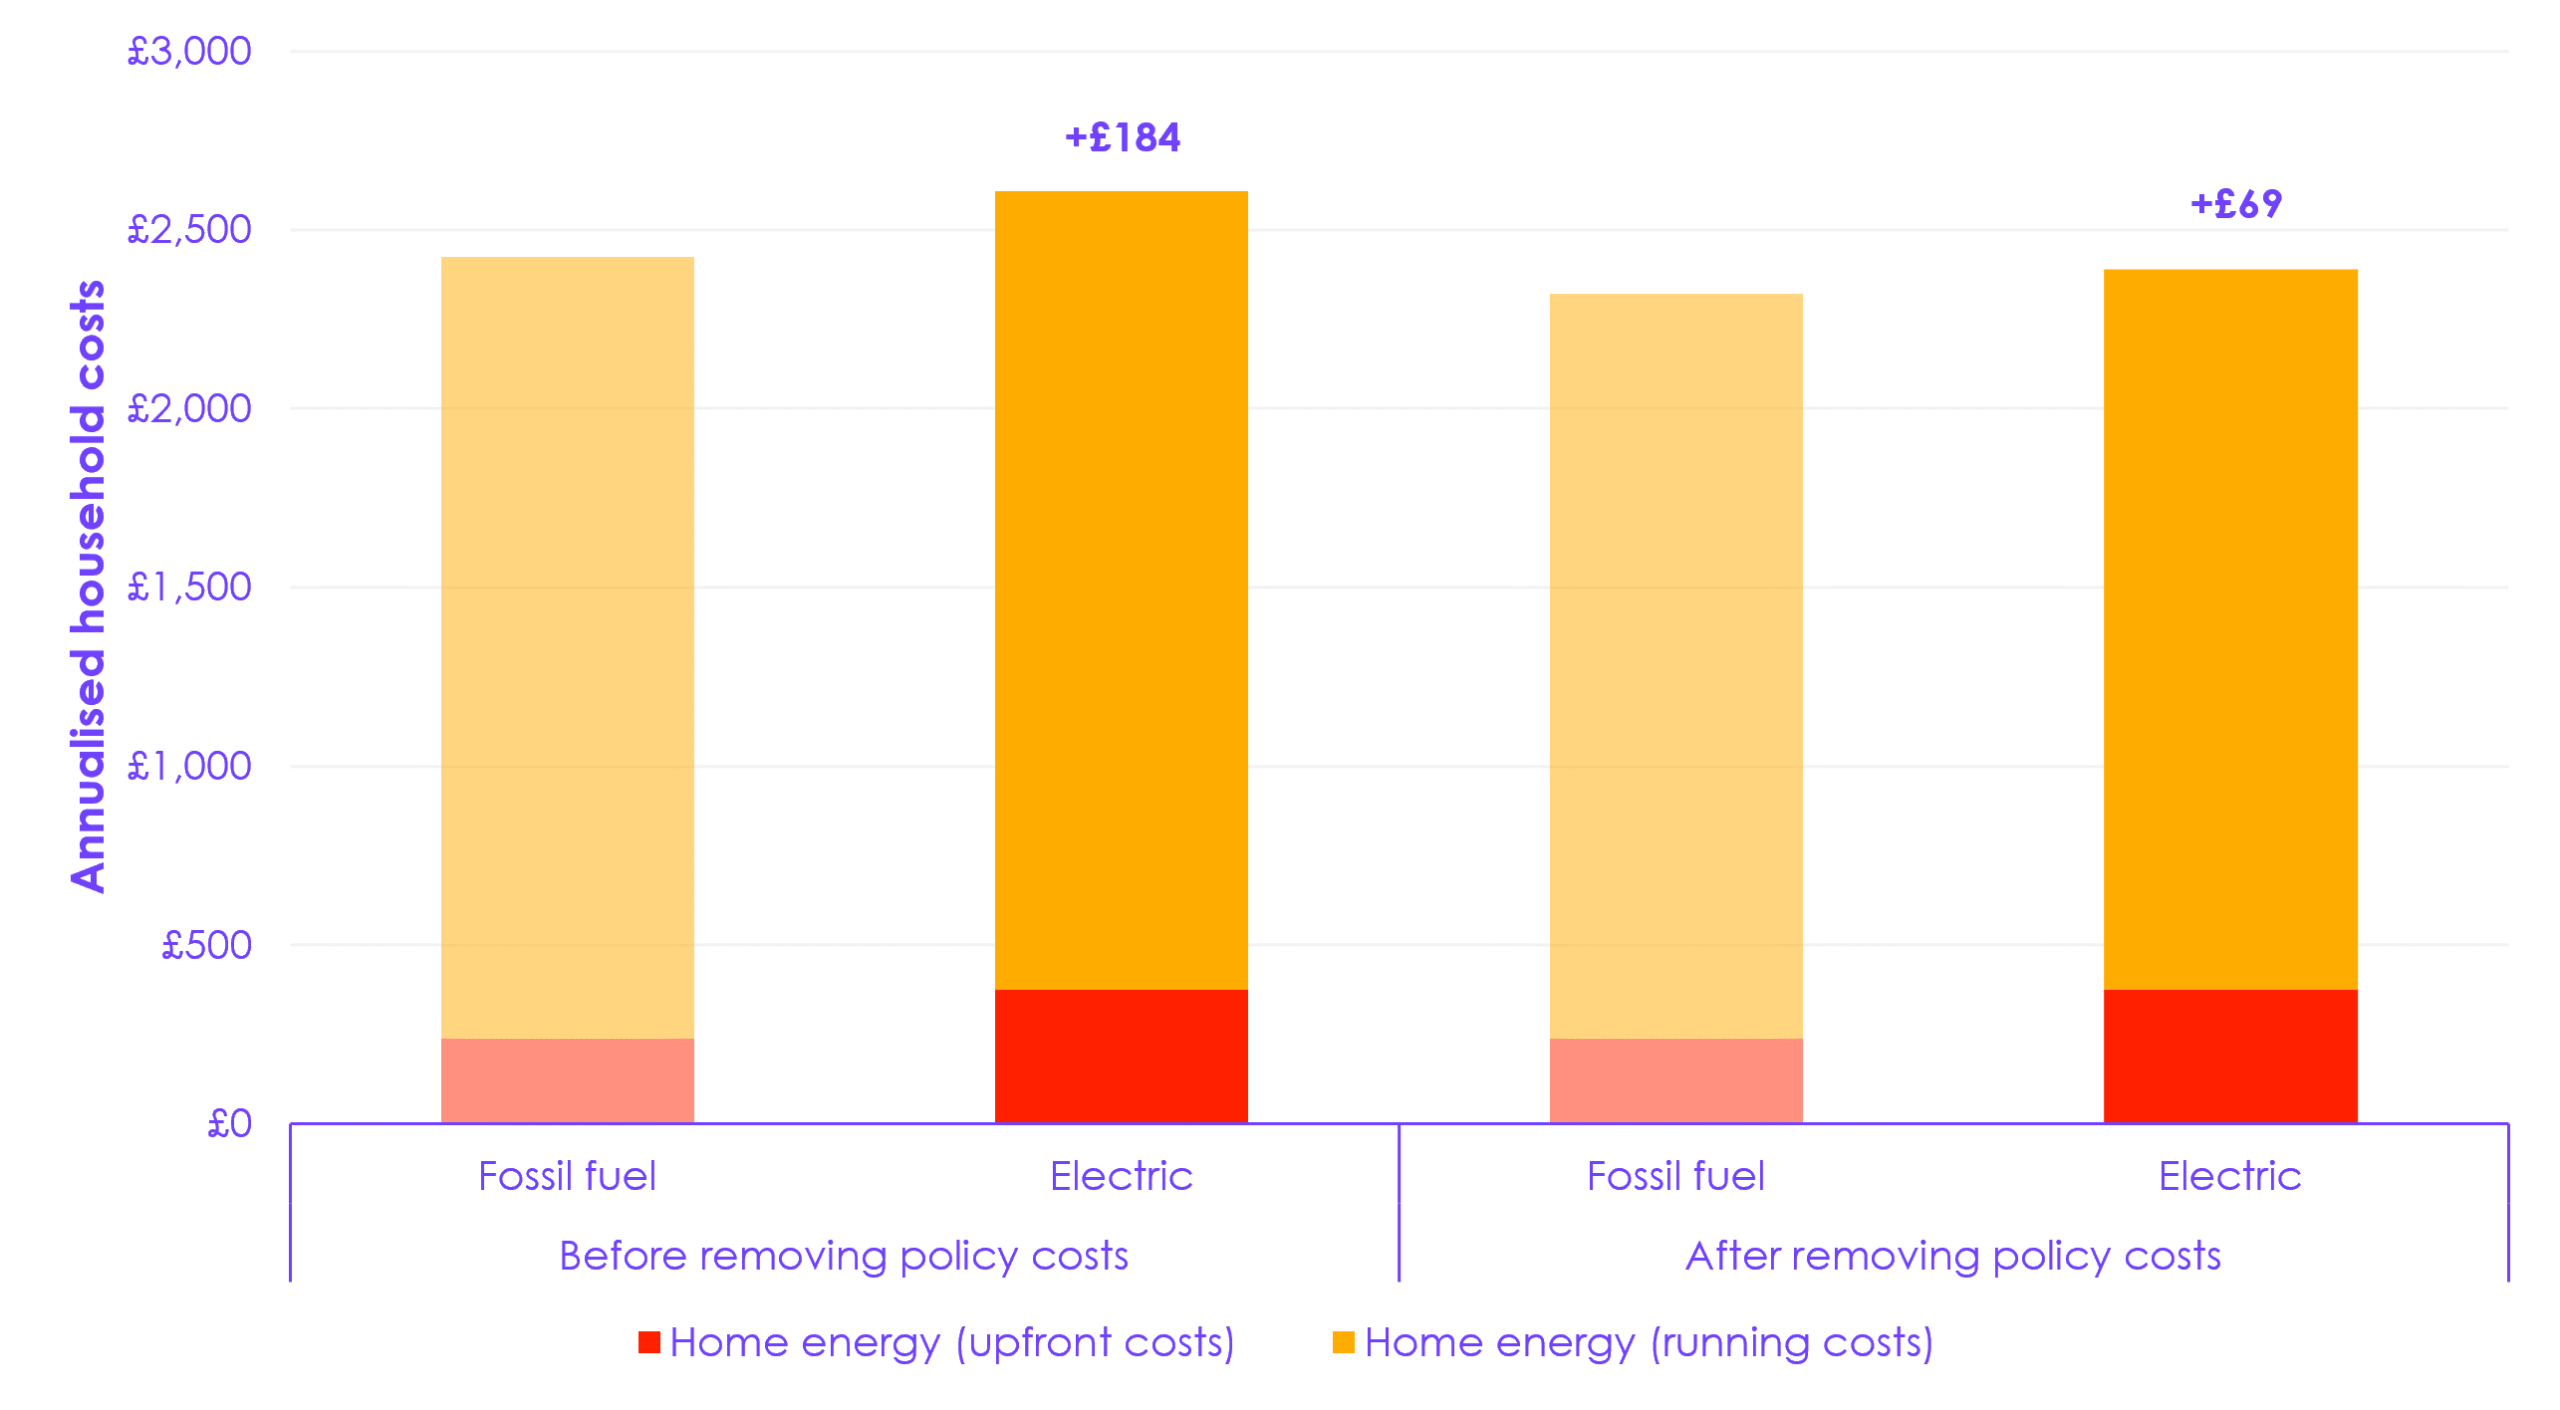 Description: Removing remaining policy costs from electricity bills would significantly reduce the additional lifetime cost, if a typical household switched to a heat pump while on a standard electricity tariff. Source: Ofgem (2026) Energy price cap (default tariff) levels; CCC analysis. Notes: (1) We use Q3 2026 price cap data, which follows the start of the Iran war. We assume Renewables Obligation, Feed-in-Tariff, Warm Homes Discount (unit rate), and legacy Contracts for Difference costs are removed from the electricity unit cost. (2) The bars for fossil fuel homes are given in a slightly lighter shade to highlight the differences. (3) We assume the household is on a standard tariff. |
| Table 5.3 Electricity-to-gas price ratios, under different conditions | ||
| Historical range (Q2 2025–Q2 2026) | 3.9–4.7 | |
| Ratio under different policy options for removing electricity policy costs | ||
| Rebalanced to tax | 3.1 | |
| Rebalanced to gas | 2.7 | |
| Ratio required for a heat pump to break even compared to a gas boiler over its lifetime | ||
| Standard tariff | Time-of-use tariff | |
| Typical household with a £7,500 grant | 2.9 | 5.0 |
| Typical household with a £7,500 grant, and a heat pump with 3.86 efficiency | 3.8 | 7.3 |
| Typical household without a grant | 1.5 | 3.8 |
| Ratio required for a heat pump to bring a £2,000 saving compared to a gas boiler over its lifetime | ||
| Standard tariff | Time-of-use tariff | |
| Typical household with a £7,500 grant | 2.4 | 4.2 |
| Note: A ‘typical household’ has a semi-detached, owner-occupied house with a gas boiler, that could swap their gas boiler for an air source heat pump as well as a time-of-use tariff (as labelled). This household has energy consumption in line with Ofgem’s typical dual fuel household. Unless stated otherwise, we assume a heat pump efficiency of 2.94, in line with our Seventh Carbon Budget advice assumptions. In the case of flexibility, we assume a tri-rate scenario where the household has access to an off-peak tariff for 56% of its heating demand, a peak tariff for 5% of its heating demand, and a standard tariff for 39% of its heating demand. | ||
Annex 1: Priority recommendations
Tables A1.1 to A1.3 present our priority recommendations for the UK Government, Northern Ireland Executive, and Welsh Government. We provided recommendations to the Scottish Government in our annual report Progress in reducing emissions in Scotland – 2025 report to Parliament, and will review these in our 2026 Scotland Progress Report.
| Table A1.1 Priority recommendations for the UK Government |
||
| Sector | Recommendations | |
| Seventh Carbon Budget | R2025-042: Set the Seventh Carbon Budget at 535 MtCO2e for the period from 2038 to 2042. This budget should include the UK’s share of international aviation and shipping emissions and the Government should plan to meet it through domestic action without resorting to international credits.
R2025-044: Produce a draft set of proposals and policies for delivering the Seventh Carbon Budget, to aid parliamentary scrutiny in the setting of the budget level. R2025-045: Develop a contingency framework to support delivery of the Seventh Carbon Budget and other UK targets. This should include a set of indicators that enable early identification of emissions reductions going off track and a collection of contingency measures that could make up any shortfalls. |
|
| Cross-cutting | R2025-046: Make electricity cheaper by removing levies and other policy costs from electricity bills to help incentivise consumers to switch to lower-carbon electric options across sectors including transport and buildings.
R2025-047: Speed up the grid connection process to ensure businesses do not face barriers to moving to electric options, including electrification of industry and heavy goods vehicle (HGV) depots. R2025-049: Develop and implement an engagement strategy to provide clear information to households and businesses about how the UK can meet its emissions targets and the role they can play. It should focus on what actions are most impactful in reducing emissions, the benefits of low-carbon choices, and providing trusted information, signposting to available sources of advice and support. R2025-052: Work with communities, workers, and local businesses in areas of the economy that may be adversely impacted by the Net Zero transition to develop proactive transition plans that enable access to secure employment and business opportunities. These efforts should feed into local or regional plans. R2025-053: Strengthen implementation of the Third National Adaptation Plan and reorganise government adaptation policy to make adaptation a fundamental aspect of policymaking across all departments, including through setting clear objectives and measurable targets. R2026-007: Explore options to make up the shortfall to the 2030 Nationally Determined Contribution (NDC) in the Government’s pathway, including accelerating the deployment of electric vehicles, and heat pumps in homes and the public sector. R2026-019: Establish effective coordination between national and local government in the delivery of Net Zero, clarifying roles and responsibilities, aligning delivery objectives, and ensuring joint working and adequate funding. R2026-020: Identify and address barriers to enable growth of the workforces needed to deliver the Net Zero transition, including in sectors not covered by Clean Energy Jobs Plan. R2026-021: Set out how government will support businesses to make the transition to low-carbon production or operation. R2026-022: Set out how government will support businesses to decarbonise early and take advantage of growing global demand for low-carbon goods and services. R2026-023: Deliver commitments in the Clean Flexibility Roadmap to drive consumer-led flexibility and improve consumers’ awareness of the benefits of flexibility. R2026-027: Strengthen the UK Emissions Trading Scheme (ETS) to ensure that its price is sufficient to incentivise decarbonisation. This could include a higher carbon price floor (Auction Reserve Price) and/or linkages with the EU ETS. |
|
| Surface transport | R2025-055: Improve the availability and reduce the cost of local public charging for drivers who do not have access to private off-street parking, to make local public charging more comparable to charging at home.
R2025-056: Develop further policies and incentives to accelerate zero-emission van uptake, working with major van fleet operators to understand and overcome barriers to uptake such as charging and access to finance. R2025-057: Design and implement a regulatory mechanism requiring sales of zero-emission HGVs to scale up to meet the 2040 end-of-sales date for new diesel HGVs (2035 for smaller HGVs) and provide purchase subsidies where required. Develop a strategy to deliver the required charging infrastructure for heavy duty vehicles. R2025-058: Provide local authorities with powers and access to long-term funding and resources to deliver increases in public transport, walking, and cycling. R2026-011: Remove barriers and maintain a consistent, ambitious policy framework to support the transition to electric cars. This should include increasing access to affordable charging, minimising any hassle factor from electric vehicle excise duty (eVED) and ensuring no further weakening of the zero-emission vehicle (ZEV) mandate. |
|
| Buildings | R2025-059: Confirm that there will be no role for hydrogen in home heating.
R2025-061: Reinstate regulations so that beyond 2035 all heating systems installed are low carbon. R2025-062: Provide long-term certainty that upfront costs will not present a barrier to the ramp-up in roll-out of heat pumps, ensuring that the transition is affordable and accessible to households. R2026-008: Urgently address the gap left by the closure of the Energy Company Obligation. R2026-009: Remove any unnecessary barriers that make a heat pump harder to install than a gas boiler, so that by 2035 low-carbon heating installations are the default choice. This could include reducing regulatory barriers, addressing skills gaps, improving advice to households and businesses, and enabling market conditions which reduce installation costs. R2026-010: Introduce a comprehensive programme to decarbonise public sector buildings. The Government should consider restricting the installation of fossil-fuel boilers in public buildings. |
|
| Agriculture and land use | R2025-069: Provide incentives and address barriers for farmers and land managers to diversify land use and management into woodland creation, peatland restoration, bioenergy crops and renewable energy.
R2025-070: Provide long-term certainty on public funding for farming practices and technologies which reduce emissions from managing crops and livestock. As part of this, ensure low-regret and low-cost measures are taken up through regulations or minimum requirements in agricultural support mechanisms, especially when they can deliver efficiency improvements. |
|
| Industry | R2025-067: Introduce regulations, supported by subsidies if necessary, to drive decarbonisation of non-road mobile machinery. This could include regulatory measures with proven success in reducing road transport emissions.
R2026-012: Provide effective measures to reduce embodied carbon of industrial products and buildings, and ensure a level playing field with imported products. R2026-013: Set out a plan to deliver the Government’s ambition for industrial electrification. This should confirm suitable use cases and establish the conditions necessary to make electrification the economically rational choice, addressing both capital cost and operating cost barriers. |
|
| Aviation | R2025-075: Develop and implement policy – such as the existing sustainable aviation fuel (SAF) mandate and the UK ETS – that ensures the aviation sector takes responsibility for mitigating its emissions and ultimately achieving Net Zero for the sector by 2050. This includes paying for permanent engineered removals to balance out all remaining emissions. Ensure robust contingencies are in place to address any delays in decarbonisation, including through demand management.
R2025-076: Commit, as a minimum, to preventing the additional warming impacts from aviation beyond greenhouse gas emissions (known as non-CO2 effects) increasing after 2050. Begin to monitor these impacts and support investigation, development, and trial of mitigation options that complement rather than substitute for CO2 mitigation. R2025-077: Seek to strengthen the ambition and effectiveness of International Civil Aviation Organisation (ICAO) objectives and the Carbon Offsetting and Reduction Scheme for International Aviation (CORSIA). Form alliances with countries who are aligned with the UK to go further than ICAO on both emissions and non-CO2 effects. |
|
| Energy supply | R2025-072: Reform key processes and rules, including in planning, consenting, and regulatory funding, to enable rapid expansion of the country’s energy infrastructure and clear, consistent resolution of tensions between low cost of infrastructure and sensitivity to local conditions. In most cases, overhead lines should be favoured over more expensive methods such as undergrounding.
R2025-073: Provide clarity around the future of electricity market arrangements and any transition arrangements as soon as possible. R2026-014: Continue work by the National Energy System Operator (NESO), Distribution Network Operators (DNOs) and Ofgem to ensure there are clear, consistent criteria for evaluating the impacts of distributed generation and demand on peak distribution network power flows. R2026-015: Ensure the funding and auction design for future CfD allocation rounds are sufficient to secure the level of renewables capacity required to deliver a decarbonised power system, alongside ensuring strike prices help make electricity cheaper. |
|
| Waste | R2025-078: Ensure policies enabling improved recycling and waste reduction are in place across the UK ahead of the near elimination of biodegradable waste sent to landfill and the inclusion of energy from waste in the UK ETS.
R2025-079: Enable improved monitoring of wastewater emissions and encourage investment in technology development and deployment to reduce emissions from wastewater. R2025-080: Prevent energy from waste capacity expansion unless a viable route to connecting CCS can be established. R2026-018: Develop incentives to increase landfill gas capture rates to replace the RO certificate subsidies which end in 2027. |
|
| Shipping | R2025-081: Include domestic and international shipping emissions in the UK ETS in line with the EU ETS and ensure there are incentives and infrastructure for decarbonisation of all vessel types – from private leisure vessels to large-scale freight ships.
R2025-082: Seek to strengthen and implement the International Maritime Organisation (IMO) objectives. In parallel, collaborate with other parties to establish multilateral partnerships to address international shipping emissions. |
|
| Engineered removals | R2025-083: Publish a common sustainability framework for biomass, along with robust procedures for monitoring, reporting, and verification. This should prioritise domestic supply and should provide clarity on which feedstocks are provably sustainable, both in terms of their climate impact and interactions with wider environmental objectives.
R2026-016: Finalise the Power BECCS Business Model. This should provide clarity on the near-term funding pathway, including setting out the responsibilities of the public and private sectors. R2026-017: Publish an engineered removals strategy to give clarity on the remaining policy gaps, funding mechanisms, and roles of different technologies. |
|
| Table A1.2 Priority recommendations for the Northern Ireland Executive |
|
| Sector | Recommendations |
| Northern Ireland’s Fourth Carbon Budget | R2025-119: Set the Fourth Carbon Budget at an annual average of 77% below the 1990 baseline for the period from 2038 to 2042. The Northern Ireland Executive should plan to meet the budget as much as possible through domestic action without using credits.
R2025-120: Produce a Climate Action Plan and sectoral plans setting out the Northern Ireland Executive’s policies and proposals that will play a role in delivering the Fourth Carbon Budget and Northern Ireland’s other carbon budgets. |
| Cross-cutting | R2025-121: Speed up new grid development and the grid connection process for both distribution and transmission networks to ensure that the grid is ready to accommodate necessary clean power infrastructure, and also to enable electrification for businesses and households.
R2025-122: Work with the UK Government to develop and implement an engagement strategy to provide clear, trusted information about the most effective actions for households and businesses in Northern Ireland to reduce emissions and the benefits of low-carbon choices, signposting to available sources of advice and support. R2025-123: Develop and implement a strategy for working with businesses and communities that may be affected by the Net Zero transition. This should include working with farmers to identify ways to diversify income streams and support farming communities. R2025-136: Produce a strategy for development of carbon capture and storage infrastructure in Northern Ireland, considering both the requirements of industrial and energy from waste plants and its use for engineered removals. This should include assessing the viable approaches for transporting and storing captured CO2. |
| Agriculture and land use | R2025-124: Provide incentives and address barriers for farmers and land managers to diversify land use and management into woodland creation, peatland restoration, bioenergy crops, and renewable energy.
R2025-125: Provide long-term certainty on public funding for farming practices and technologies which reduce emissions from managing crops and livestock. As part of this, ensure low-regret and low-cost measures are taken up through regulations or minimum requirements in agricultural support mechanisms, especially when they can deliver efficiency improvements. R2025-126: Consider how Northern Ireland could take the lead on developing and deploying solutions that can reduce emissions on farms, including methane-suppressing livestock feed additives and anaerobic digestion. |
| Surface transport | R2025-127: Support the deployment of public charge points across Northern Ireland.
R2026-024: Invest strategically to improve Northern Ireland’s public transport and active travel infrastructure, supported by long-term funding. |
| Energy supply | R2025-129: Progress Northern Ireland-specific programmes and devolved policy to encourage investment in low-carbon electricity supply. This could include introducing a contract for difference scheme for renewables. |
| Buildings | R2025-130: Put in place requirements on housing developers ensuring no new properties completed from 2026 use fossil fuel boilers.
R2025-131: Consider regulations so that beyond 2035 all new and replacement heating systems installed are low-carbon. R2025-132: Introduce measures to ensure that upfront costs are not a barrier to the roll-out of heat pumps. This could include providing support for households through government funding, similar to the Boiler Upgrade Scheme in England and Wales, incentivising discounted private finance schemes, such as green mortgages or zero-interest loans, or introducing point-of-sale installation requirements. R2026-026: Introduce a comprehensive programme to decarbonise public sector buildings. The Executive should consider restricting the installation of fossil-fuel boilers in public buildings. |
| Waste | R2025-134: Implement policies enabling improved recycling and waste reduction as part of efforts to eliminate biodegradable waste to landfill and minimising fossil-derived (for example, plastics) waste being sent to energy from waste. |
| Engineered removals | R2025-135: Explore options and develop a strategy for delivery of or access to the volume of removals necessary for Northern Ireland to meet its Net Zero target. This should include considering the role of and options for delivering direct air carbon capture and storage in Northern Ireland and reviewing the evidence on the long-term impacts and potential of enhanced weathering and biochar removals in Northern Ireland. |
| Table A1.3 Priority recommendations for the Welsh Government |
|
| Sector | Recommendations |
| Wales’ Fourth Carbon Budget | R2025-104: As part of the report setting out the Welsh Government’s proposals and policies for meeting the Third Carbon Budget, include an assessment of the longer-term actions that are needed to get Wales on track for the Fourth Carbon Budget and beyond. |
| Cross-cutting | R2025-105: Work with the UK Government to develop and implement an engagement strategy to provide clear, trusted information about the most effective actions for households and businesses in Wales to reduce emissions and the benefits of low-carbon choices, signposting to available sources of advice and support.
R2025-106: Publish a Net Zero skills action plan to identify and address barriers to enable growth of the workforces needed to deliver the Net Zero transition. R2025-107: Work with communities, workers, and businesses in areas of the economy that may be adversely impacted by the Net Zero transition to develop proactive transition plans that enable access to secure employment and business opportunities. |
| Agriculture and land use | R2025-109: Provide incentives and address barriers for farmers and land managers to diversify land use and management into woodland creation, peatland restoration, agroforestry, and renewable energy. These policies need to support and empower rural communities to deliver these changes.
R2025-110: Provide long-term certainty on public funding for farming practices and technologies which reduce emissions from managing crops and livestock. As part of this, ensure low-regret and low-cost measures are taken up through regulations or minimum requirements in agricultural support mechanisms, especially when they can deliver efficiency improvements. |
| Surface transport | R2025-111: Expand provision of charging infrastructure and provide reliable public information to support the successful implementation of the ZEV mandate.
R2025-112: Improve Wales’ public transport and active travel infrastructure through strategic investment in integrated networks enhanced services, and dedicated walking and cycling routes, supported by long-term funding and powers for local councils. |
| Buildings | R2025-113: Put in place requirements on housing developers ensuring no new properties completed from 2026 use fossil fuel heating systems. Deliver changes to Building Regulations with stringent transition arrangements which ensure that, from 2026, all new homes are built with low-carbon heating systems.
R2025-114: Introduce regulations to ensure that, beyond 2035, all new and replacement heating systems installed are low carbon. R2025-115: Support improvements to home energy efficiency, particularly in social housing, and provide targeted support to ensure that poorly insulated homes are not a barrier to uptake of low-carbon heating systems for low-income households. R2026-025: Introduce a comprehensive programme to decarbonise public sector buildings. The Government should consider restricting the installation of fossil-fuel boilers in public buildings. |
| Waste | R2025-117: Introduce policies that deliver ambitious recycling and waste reduction goals, building on Wales’ strong record on recycling.
R2025-118: Prevent energy from waste capacity expansion unless a viable route to connecting CCS can be established. |
Annex 2: Policy assessment criteria
Our policy assessment charts track progress on what needs to be addressed in each subsector or policy area to meet the Government’s targets. For the different sectors of the economy, we have assessed the risks relating to the delivery of the Government’s targets and scored them using the criteria in Table A2.1.
| Table A2.1 Scoring criteria for assessing policies and plans |
|||
| Credible plans | Some risks | Significant risks | Insufficient plans |
| Credible plans with funding, enablers, and timelines in place. | Some adjustment to plans may be needed to mitigate uncertainties and delivery or funding risks. | Plans are under development and/or further work is needed to enact policies and overcome uncertainties and delivery or funding risks. | Plans are either missing, clearly inadequate or lack funding, and new proposals are needed. |
Endnotes
- [1] For the first time, our assessment this year is based on the Government’s new CBGDP pathway. Therefore, it is not meaningful to compare the percentage shares in each score category, as the baseline and pathway that they are based on are different. ↑
- [2] We provided recommendations to the Scottish Government in our Progress in reducing emissions in Scotlan – 2025 report to Parliament, and will review these in our 2026 Scotland Progress Report. ↑
- [3] This percentage reduction compared to 1990 levels is slightly lower than reported based on provisional 2024 emissions in our 2025 progress report. This is predominantly due to the final 2024 emissions statistics having revised down the estimate of 1990 emissions. As a result, it is likely that 2025 will have been the first year in which the UK’s emissions including IAS reached half their 1990 levels, rather than 2024 as was expected in our assessment last year. ↑
- [4] Department for Energy Security and Net Zero (2026) Final UK greenhouse gas emissions national statistics: 1990 to 2024. https://www.gov.uk/government/statistics/final-uk-greenhouse-gas-emissions-statistics-1990-to-2024. ↑
- [5] Department for Energy Security and Net Zero (2026) Provisional UK greenhouse gas emissions statistics 2025. https://www.gov.uk/government/statistics/provisional-uk-greenhouse-gas-emissions-statistics-2025. ↑
- [6] Due to the dominance of non-CO2 emissions in the agriculture and land use sectors, the latest available year of representative data as reported in the GHG Inventory is 2024. ↑
- [7] Deans, D. and Glyn-Jones, T. (2025) Tata promises electric arc by 2027 as work begins. BBC News. https://www.bbc.co.uk/news/articles/crl0176kz6po. ↑
- [8] Office for National Statistics (2026) GDP output approach – low-level aggregates. https://www.ons.gov.uk/economy/grossdomesticproductgdp/datasets/ukgdpolowlevelaggregates. ↑
- [9] Fraser, D (2025) Grangemouth closure and ‘bruised’ business confidence. BBC News. https://www.bbc.co.uk/news/articles/c626lwg7x3yo. ↑
- [10] Sherlock, G. (2025) Sabic confirms closure of plant with jobs to go. BBC News. https://www.bbc.co.uk/news/articles/cjd23eggj7jo. ↑
- [11] Humphries, J. (2025) Jobs to go as UK’s largest fibreglass factory shuts. BBC News. https://www.bbc.co.uk/news/articles/cx2j0l2xzpzo. ↑
- [12] Department for Energy Security and Net Zero (2025) Non-domestic gas prices in the EU for small, medium and large consumers. https://www.gov.uk/government/statistical-data-sets/international-industrial-energy-prices. ↑
- [13] Roland Berger (2025) European chemicals closures and investments radar 2022 – 2025. https://cefic.org//app/uploads/2026/01/European-Chemical-Closures-and-Investments-Radar-2022-2025.pdf. ↑
- [14] Climate Change Committee (2026) Supplementary analysis of the Seventh Carbon Budget. https://www.theccc.org.uk/publication/supplementary-analysis-of-the-seventh-carbon-budget/. ↑
- [15] EDF (2026) UK Nuclear Fleet Stakeholder Update. https://www.edfenergy.com/sites/default/files/2026-01/FM11758-UK-Nuclear-Fleet-Strategy-Update-2026.pdf. ↑
- [16] National Energy System Operator (NESO) (2025) 2025 Annual Balancing Costs Report. https://www.neso.energy/document/362561/download. ↑
- [17] North Sea Transition Authority (2025) Emissions Monitoring Report 2025. https://www.nstauthority.co.uk/news-publications/emissions-monitoring-report-2025/. ↑
- [18] North Sea Transition Authority (2026) NSTA February 2026 production projections plus CCC and DESNZ demand projections. https://www.nstauthority.co.uk/data-and-insights/insights-and-analysis/production-and-expenditure-projections/. (Accessed: 6 May 2026). ↑
- [19] This percentage reduction compared to 1990 levels is slightly lower than reported based on 2023 emissions in our 2025 Scottish progress report. This is predominantly due to the 2024 emissions inventory having revised down the estimate of 1990 emissions. ↑
- [20] Forster, P. et al (2026) Indicators of Global Climate Change 2025: annual update of key indicators of the state of the climate system and human influence. https://essd.copernicus.org/preprints/essd-2026-287/. ↑
- [21] United Nations Environment Programme (2025) Emissions Gap Report 2025. https://www.unep.org/resources/emissions-gap-report-2025. ↑
- [22] In line with standard international accounting, these shares are calculated based on territorial emissions excluding those from international aviation and shipping. ↑
- [23] Forster, P. et al (2026) Indicators of Global Climate Change 2025: annual update of key indicators of the state of the climate system and human influence. https://essd.copernicus.org/preprints/essd-2026-287/. ↑
- [24] Forster, P. et al (2026) Indicators of Global Climate Change 2025: annual update of key indicators of the state of the climate system and human influence. https://essd.copernicus.org/preprints/essd-2026-287/. ↑
- [25] In line with emissions in the rest of the report, this CO2e value is calculated based on methane’s Global Warming Potential over 100 years. ↑
- [26] International Energy Agency (2026) Global Methane Tracker 2026. https://www.iea.org/reports/global-methane-tracker-2026. ↑
- [27] Projections are used for 2024 and 2025 as historic data are not yet available. ↑
- [28] Forster, P. et al (2026) Indicators of Global Climate Change 2025: annual update of key indicators of the state of the climate system and human influence. https://essd.copernicus.org/preprints/essd-2026-287/. ↑
- [29] United Nations, Department of Economic and Social Affairs, Population Division (2024) World Population Prospects 2024. https://population.un.org/wpp/. ↑
- [30] Forster, P. et al (2026) Indicators of Global Climate Change 2025: annual update of key indicators of the state of the climate system and human influence. https://essd.copernicus.org/preprints/essd-2026-287/. ↑
- [31] Forster, P. et al (2026) Indicators of Global Climate Change 2025: annual update of key indicators of the state of the climate system and human influence. https://essd.copernicus.org/preprints/essd-2026-287/. ↑
- [32] Forster, P. et al (2026) Indicators of Global Climate Change 2025: annual update of key indicators of the state of the climate system and human influence. https://essd.copernicus.org/preprints/essd-2026-287/. ↑
- [33] Lowe, J. A., Harrison, M. and Perks, R. J. (2026) CCRA4-IA Technical Report. https://www.ukclimaterisk.org/publications/technical-report-ccra4-ia/. ↑
- [34] Met Office (2026) Record-breaking heat rewrites May temperature records across the UK. https://www.metoffice.gov.uk/blog/2026/record-breaking-heat-rewrites-may-temperature-records-across-the-uk. (Accessed: 1 June 2026). ↑
- [35] The United States submitted a 2035 emissions pledge in December 2024 but has since withdrawn from the Paris Agreement and so is not included in this total. ↑
- [36] United Nations Framework Convention on Climate Change (no date) Nationally Determined Contributions Registry. https://unfccc.int/NDCREG. (Accessed 18 May 2026). ↑
- [37] World Resources Institute (2026) Climate Watch NDC Tracker. https://www.climatewatchdata.org/ndc-tracker. (Accessed 6 May 2026). ↑
- [38] United Nations Framework Convention on Climate Change (2025) Global Mutirão: Uniting humanity in a global mobilization against climate change. https://unfccc.int/sites/default/files/resource/cma2025_L24_adv.pdf. ↑
- [39] Corrêa do Lago, A. (2026) Twelfth Letter from the President. https://cop30.br/en/brazilian-presidency/letters-from-the-president/twelfth-letter-from-the-president. ↑
- [40] Government of Colombia and Government of the Netherlands (2026) Co-host takeaways on the first conference on transitioning away from fossil fuels. https://static1.squarespace.com/static/68dc91a7e566d74a91e8e22d/t/69f2979327f294060a2cb53d/1777506195819/TAFF+Conference_Co-host+Takeaways_DEF.pdf. ↑
- [41] United Nations (2026) United Nations Framework Convention on Climate Change. https://treaties.un.org/Pages/ViewDetailsIII.aspx?src=IND&mtdsg_no=XXVII-7&chapter=27&Temp=mtdsg3&clang=_en. (Accessed 6 May 2026). ↑
- [42] United Nations (2026) Paris Agreement. https://treaties.un.org/Pages/ViewDetails.aspx?src=TREATY&mtdsg_no=XXVII-7-d&chapter=27&clang=_en. (Accessed 6 May 2026). ↑
- [43] BloombergNEF (2026) BloombergNEF Finds Global Energy Transition Investment Reached Record $2.3 Trillion in 2025, Up 8% from 2024. https://about.bnef.com/insights/clean-energy/bloombergnef-finds-global-energy-transition-investment-reached-record-2-3-trillion-in-2025-up-8-from-2024/. ↑
- [44] 国家统计局 [Chinese National Bureau of Statistics] (2026) 中华人民共和国2025年国民经济和社会发展统计公报 [Statistical Bulletin of the People’s Republic of China on National Economic and Social Development in 2025]. https://www.stats.gov.cn/sj/zxfbhjd/202602/t20260228_1962662.html. ↑
- [45] Myllyvirta, L. and Aggarwal, A. (2026) Analysis: India’s CO2 emissions in 2025 grew at slowest rate in two decades. Carbon Brief. https://www.carbonbrief.org/analysis-indias-co2-emissions-in-2025-grew-at-slowest-rate-in-two-decades/. ↑
- [46] Myllyvirta, L. (2026) Analysis: coal power drops in China and India for first time in 52 years after clean-energy records. Centre for Research on Energy and Clean Air. https://energyandcleanair.org/analysis-coal-power-drops-in-china-and-india-for-first-time-in-52-years-after-clean-energy-records/. ↑
- [47] International Energy Agency (2026) Global Energy Review 2026. https://www.iea.org/reports/global-energy-review-2026. ↑
- [48] International Energy Agency (2026) Global Energy Review 2026. https://www.iea.org/reports/global-energy-review-2026. ↑
- [49] International Energy Agency (2026) Global Energy Review 2026. https://www.iea.org/reports/global-energy-review-2026. ↑
- [50] Ember (2026) Global Electricity Review 2026. https://ember-energy.org/latest-insights/global-electricity-review-2026/. ↑
- [51] Global Solar Council (2026) Africa Market Outlook for Solar PV: 2026-2029. https://www.globalsolarcouncil.org/resources/africa-market-outlook-2026-2029/. ↑
- [52] European Automobile Manufacturers’ Association (2026) New car registrations: +1.8% in 2025; battery-electric 17.4% market share. https://www.acea.auto/pc-registrations/new-car-registrations-1-8-in-2025-battery-electric-17-4-market-share/. ↑
- [53] State Council of the People’s Republic of China (2026) China’s auto output, sales reach new highs in 2025. https://english.www.gov.cn/archive/statistics/202601/14/content_WS6967432ec6d00ca5f9a088ff.html. ↑
- [54] Car News China (2025) REPORT China EV market situation in first half of 2025. https://carnewschina.com/2025/07/21/report-china-ev-market-situation-in-first-half-of-2025/. ↑
- [55] Norwegian Electric Vehicle Association (2026) Norwegian EV market. https://elbil.no/english/norwegian-ev-market/. (Accessed 22 April 2026). ↑
- [56] Ethiopian Ministry of Water and Energy (2025) Ethiopian Energy Outlook 2025. https://www.mowe.gov.et/sites/default/files/resource/Ethiopian%20Energy%20Outlook%202025.pdf. ↑
- [57] The Global CCS Institute (2025) Global Status of Carbon Capture and Storage 2025. https://www.globalccsinstitute.com/wp-content/uploads/2025/10/Global-Status-of-CCS-2025-report-9-October.pdf. ↑
- [58] Northern Lights (2025) Northern Lights JV has successfully stored first CO₂. https://norlights.com/news/northern-lights-jv-has-successfully-stored-first-co%E2%82%82/. ↑
- [59] European Heat Pump Association (2026) Heat pump sales testify to government action. https://ehpa.org/news-and-resources/press-releases/heat-pump-sales-testify-to-government-action/. ↑
- [60] International Energy Agency (2026) Global Energy Review 2026. https://www.iea.org/reports/global-energy-review-2026. ↑
- [61] Federal Reserve Bank of S. Louis (no date) Global price of Brent Crude. https://fred.stlouisfed.org/series/POILBREUSDM. ↑
- [62] Federal Reserve Bank of S. Louis (no date) Global price of LNG, Asia. https://fred.stlouisfed.org/series/POILBREUSDM. ↑
- [63] International Energy Agency (2026) 2026 Energy Crisis Policy Response Tracker. https://www.iea.org/data-and-statistics/data-tools/2026-energy-crisis-policy-response-tracker. (Accessed 22 April 2026). ↑
- [64] Gabattis, J. (2026) Iran war analysis: How 60 nations have responded to the global energy crisis. Carbon Brief. https://www.carbonbrief.org/iran-war-analysis-how-60-nations-have-responded-to-the-global-energy-crisis/. ↑
- [65] Myllyvirta, L. (2026) Global fossil power generation fell after the Hormuz closure due to solar and wind growth. Centre for Research on Energy and Clean Air. https://energyandcleanair.org/fossil-power-fell-in-march-after-hormuz-blockade/. ↑
- [66] Gabattis, J. (2026) World ‘will not see significant return to coal’ in 2026 – despite Iran crisis. Carbon Brief. https://www.carbonbrief.org/world-will-not-see-significant-return-to-coal-in-2026-despite-iran-crisis/. ↑
- [67] European Commission (2026) Factsheet – AccelerateEU Communication. https://ec.europa.eu/commission/presscorner/detail/en/fs_26_631. ↑
- [68] Government of France (2026) Électrification: les mesures annoncées par le Gouvernement. https://www.info.gouv.fr/actualite/electrification-les-mesures-annoncees-par-le-gouvernement. ↑
- [69] Myllyvirta, L. (2026) Global fossil power generation fell after the Hormuz closure due to solar and wind growth. Centre for Research on Energy and Clean Air. https://energyandcleanair.org/fossil-power-fell-in-march-after-hormuz-blockade/. ↑
- [70] Government of Chile (2026) Chile Moves Forward Plan: We add two new measures to support Chilean families. https://www.gob.cl/en/news/chile-moves-forward-plan-we-add-two-new-measures-to-support-chilean-families/. ↑
- [71] International Energy Agency (2026) 2026 Energy Crisis Policy Response Tracker. https://www.iea.org/data-and-statistics/data-tools/2026-energy-crisis-policy-response-tracker. (Accessed 22 April 2026). ↑
- [72] Lao News Agency (2026) Laos Signs Agreement to Promote Electric Vehicles Amid Rising Fuel Prices. https://kpl.gov.la/EN/detail.aspx?id=97777. ↑
- [73] International Energy Agency (2025) World Energy Outlook 2025. https://www.iea.org/reports/world-energy-outlook-2025. ↑
- [74] Department for Energy Security and Net Zero and Foreign, Commonwealth and Development Office (2025) Global Clean Power Alliance: supply chains mission vision. https://www.gov.uk/government/publications/global-clean-power-alliance-supply-chains-mission-vision/global-clean-power-alliance-supply-chains-mission-vision. ↑
- [75] The Coalition to Grow Carbon Markets (2025) International coalition launches collective government-backed framework for corporate use of high-integrity carbon credits. https://coalitiontogrowcarbonmarkets.org/international-coalition-launches-collective-government-backed-framework/. ↑
- [76] Climate and Clean Air Coalition Secretariat (2025) United Kingdom Elected as Co-Chair of the Climate and Clean Air Coalition, Highlighting Ambitious Agenda to Tackle Super Pollutants. https://www.ccacoalition.org/news/united-kingdom-elected-co-chair-climate-and-clean-air-coalition-highlighting-ambitious-agenda-tackle-super-pollutants. ↑
- [77] Government of Brazil (2025) Belém Declaration on Global Green Industrialization. https://cop30.br/en/news-about-cop30/cop30-documents/cop30_belem-declaration-on-global-green-industrialization_final-4.pdf/@@download/file. ↑
- [78] UK Parliament (2026) Official Development Assistance (ODA) programme allocations 2026/27 – 2028/29 | Statement made on 19 March 2026. https://questions-statements.parliament.uk/written-statements/detail/2026-03-19/hcws1425. ↑
- [79] Department for Energy Security and Net Zero; Department for Environment, Food and Rural Affairs; and Foreign, Commonwealth and Development Office (2023) UK International Climate Finance Strategy. https://www.gov.uk/government/publications/uk-international-climate-finance-strategy. ↑
- [80] UK Government (2008) Climate Change Act 2008, 2008 c. 27. https://www.legislation.gov.uk/ukpga/2008/27/contents. (Accessed: 23 April 2026). ↑
- [81] United Nations Framework Convention on Climate Change (2015) Paris Agreement. https://unfccc.int/process-and-meetings/the-paris-agreement. (Accessed: 7 May 2026). ↑
- [82] UK Government (2026) The Carbon Budget Order 2026. https://www.legislation.gov.uk/ukdsi/2026/9780348283815/data.pdf. (Accessed: 2 June 2026). ↑
- [83] White, K. (2026) Letter to Baroness Sheehan, 17 April 2026. Department for Energy Security and Net Zero. https://committees.parliament.uk/publications/52843/documents/294776/default/. (Accessed: 14 May 2026). ↑
- [84] Department for Energy Security and Net Zero (DESNZ) (2025) Carbon Budget and Growth Delivery Plan. https://www.gov.uk/government/publications/carbon-budget-and-growth-delivery-plan. (Accessed: 10 April 2026). ↑
- [85] The UK’s GHG emissions inventory is updated every year, and some methodological changes can impact previous emissions estimates. To assess the performance of the CBGDP pathway against the UK’s emissions targets, we have adjusted emissions in the published pathway to use the 2024 final emissions inventory basis. This inventory was released after the CBGDP was published. ↑
- [86] Department for Energy Security and Net Zero (DESNZ) (2026) Final UK greenhouse gas emissions statistics: 1990 to 2024 inventory. https://www.gov.uk/government/statistics/final-uk-greenhouse-gas-emissions-statistics-1990-to-2024. (Accessed 14 May 2026). ↑
- [87] Department for Transport and The Rt Hon Heidi Alexander MP (2026) Written statement to Parliament: Update to forecasts of greenhouse gas emissions from aviation. https://www.gov.uk/government/speeches/update-to-forecasts-of-greenhouse-gas-emissions-from-aviation. (Accessed 14 May 2026). ↑
- [88] The 2035 NDC is aligned with the Sixth Carbon Budget. However, after adjustments to the latest emissions inventory, the 2035 NDC is narrowly missed. This is due to the inventory adjustments reducing the 1990 baseline against which the NDC is calculated. Before these adjustments, the CBGDP pathway achieves the 2035 NDC. ↑
- [89] We exclude IAS emissions from these calculations because the 2030 NDC does not include IAS emissions and to reduce the impact of COVID-19 on the emissions data. ↑
- [90] In addition to the main engineered removals policy, novel or small-scale engineered removals technologies are also included in a list of other early-stage policies, contributing 0.05 MtCO2e per year in the Sixth Carbon Budget period. ↑
- [91] These values refer to the percentage of abatement delivered through each source, out of the total emissions reduction from our adjusted baseline to the CBGDP pathway by the end of the plan period (2037) (see Section 4.2.1). ↑
- [92] For our indicator on price parity, we use Autotrader’s like-for-like price assessment, which compares upfront purchase prices of equivalent electric and internal combustion engine models. In April and May 2026, Autotrader also found that electric cars were on average cheaper when considering all new cars advertised on their site (cars were not assessed on a like-for-like basis). ↑
- [93] Based on a Transport and Environment study of European car prices and supported by UK market data shared with the CCC by Autotrader. ↑
- [94] Transport and Environment (2026) EV progress report: EV sales and affordability are reaching a tipping point. https://www.transportenvironment.org/articles/ev-progress-report-2026. ↑
- [95] Used EV prices are based on CCC analysis. ↑
- [96] The Society of Motor Manufacturers and Traders (2026) EVs power up used car market in three-year growth run. https://www.smmt.co.uk/evs-power-up-used-car-market-in-three-year-growth-run/. ↑
- [97] Autotrader (2026) Sharp rise in EV interest on Autotrader following Middle East bombing. https://plc.autotrader.co.uk/news-views/press-releases/sharp-rise-in-ev-interest-on-autotrader-following-middle-east-bombing/. (Accessed: 21 May 2026). ↑
- [98] Carwow (2026) Electric car enquiries surge 23% as Iran war sends fuel prices soaring. https://www.carwow.co.uk/news/10530/iran-war-fuel-prices-boost-electric-car-interest. (Accessed: 21 May 2026). ↑
- [99] The Society of Motor Manufacturers and Traders (2026) Van market shrinks in 2025 despite EV growth. https://www.smmt.co.uk/van-market-shrinks-in-2025-despite-ev-growth/. ↑
- [100] The Society of Motor Manufacturers and Traders (2025) Electric van demand static in 2024 despite biggest overall market in three years. https://www.smmt.co.uk/electric-van-demand-static-in-2024-despite-biggest-overall-market-in-three-years/. ↑
- [101] The Society of Motor Manufacturers and Traders (2026) Van market shrinks in 2025 despite EV growth. https://www.smmt.co.uk/van-market-shrinks-in-2025-despite-ev-growth/. ↑
- [102] The Society of Motor Manufacturers and Traders (2025) The future of the van: what will change over the next decade?. https://www.smmt.co.uk/the-future-of-the-van-what-will-change-over-the-next-decade/. ↑
- [103] Department for Transport (2021) Final Van Statistics April 2019 – March 2021. https://assets.publishing.service.gov.uk/media/62455bc3e90e075f1088f630/van-statistics-2019-to-2020.pdf. ↑
- [104] EO Charging (2026) EV Adoption and Attitudes in the Commercial Fleet Sector. https://www.eocharging.com/stories/ev-adoption-and-attitudes-in-the-commercial-fleet-sector. ↑
- [105] The Society of Motor Manufacturers and Traders (2025) The future of the van: what will change over the next decade?. https://www.smmt.co.uk/the-future-of-the-van-what-will-change-over-the-next-decade/. ↑
- [106] ZapMap (2026) UK EV Charging Statistics 2025. https://www.zapmap.com/ev-charging-statistics-2025-report. ↑
- [107] ZapMap (2026) How many EV charging points are there in the UK?. https://www.zapmap.com/ev-stats/how-many-charging-points. (Accessed: 13 May 2026). ↑
- [108] UK Parliament Transport Committee (2026) Written evidence SEV0105. https://committees.parliament.uk/writtenevidence/162238/html/. ↑
- [109] Department for Transport (2026) Electric vehicle public charging infrastructure statistics: January 2026. https://www.gov.uk/government/statistics/electric-vehicle-public-charging-infrastructure-statistics-january-2026/electric-vehicle-public-charging-infrastructure-statistics-january-2026. ↑
- [110] ZapMap (2026) UK EV price index. https://www.zapmap.com/ev-stats/charging-price-index. ↑
- [111] Fleet News (2026) Average public EV charging costs now below petrol: ChargeUK. https://www.fleetnews.co.uk/news/public-ev-charging-now-cheaper-than-buying-fuel-chargeuk-says. (Accessed: 13 May 2026). ↑
- [112] ZapMap (2026) How many EV charging points are there in the UK?. https://www.zapmap.com/ev-stats/how-many-charging-points. (Accessed: 13 May 2026). ↑
- [113] The Society of Motor Manufacturers and Traders (2026) Best month ever for new EV registrations as market grows in all-important plate change March. https://www.smmt.co.uk/best-month-ever-for-new-ev-registrations-as-market-grows-in-all-important-plate-change-march/. ↑
- [114] The Society of Motor Manufacturers and Traders (2026) UK new car market breaches two million as almost one in four buyers go electric. https://www.smmt.co.uk/uk-new-car-market-breaches-two-million-as-almost-one-in-four-buyers-go-electric/. ↑
- [115] RAC Drive (2026) Electric car statistics and data 2026: UK insights and global trends. https://www.rac.co.uk/drive/electric-cars/choosing/electric-car-statistics-and-data/. (Accessed: 14 May 2026). ↑
- [116] RAC Drive (2026) Longest range electric cars 2026. https://www.rac.co.uk/drive/electric-cars/best/longest-range-electric-vehicles/. (Accessed: 13 May 2026). ↑
- [117] The Society of Motor Manufacturers and Traders (2026) Two millionth electric car registered as market rebounds strongly from tax changes. https://www.smmt.co.uk/two-millionth-electric-car-registered-as-market-rebounds-strongly-from-tax-changes/. ↑
- [118] New Automotive (2026) BEVs Reach One-Third of the Market in December, Capping a Record-Breaking 2025. https://storage.googleapis.com/public_download_assets/ecc_pdfs/20260106%20ECC%20December%202025.pdf. ↑
- [119] New Automotive (2026) UK Hits 2 Million EV Milestone as Consumers Turn to Electric. https://storage.googleapis.com/public_download_assets/ecc_pdfs/20260505 ECC April 2026.pdf. ↑
- [120] Department for Transport (2025) Phasing out sales of new petrol and diesel cars from 2030 and supporting the ZEV transition: summary of responses and joint government response. https://www.gov.uk/government/consultations/phasing-out-sales-of-new-petrol-and-diesel-cars-from-2030-and-supporting-the-zev-transition/outcome/phasing-out-sales-of-new-petrol-and-diesel-cars-from-2030-and-supporting-the-zev-transition-summary-of-responses-and-joint-government-response#carbon-impacts-analysis. ↑
- [121] Department for Transport (2026) Transport and transport technology: public attitudes tracker. https://www.gov.uk/government/publications/transport-and-transport-technology-public-attitudes-tracker. ↑
- [122] European Alternative Fuels Observatory (2026) Sweden reaches 15% EV car fleet in 2025. https://alternative-fuels-observatory.ec.europa.eu/general-information/news/sweden-reaches-15-ev-car-fleet-2025. ↑
- [123] European Alternative Fuels Observatory (2026) Finland: nearly 60% of Finland’s new car market was rechargeable in 2025. https://alternative-fuels-observatory.ec.europa.eu/general-information/news/finland-nearly-60-finlands-new-car-market-was-rechargeable-2025. ↑
- [124] European Alternative Fuels Observatory (2026) Netherlands Electric Vehicle Market – 2025 Overview (BEV & PHEV). https://alternative-fuels-observatory.ec.europa.eu/general-information/news/netherlands-electric-vehicle-market-2025-overview-bev-phev. ↑
- [125] European Commission (2024) Commission report under Article 12(3) of Regulation (EU) 2019/631 on the evolution of the real-world CO2 emissions gap for passenger cars and light commercial vehicles and containing the anonymised and aggregated real-world datasets referred to in Article 12 of Commission Implementing Regulation (EU) 2021/392. https://eur-lex.europa.eu/legal-content/EN/TXT/?uri=CELEX:52024DC0122. ↑
- [126] Department for Transport (2024) Phasing out the sale of new petrol and diesel cars from 2030 and Support for the Zero Emission Transition. https://assets.publishing.service.gov.uk/media/679382182de28ea2d392f37f/phasing-out-the-sale-of-new-petrol-and-diesel-cars-from-2030-and-support-for-the-zero-emission-transition.pdf. ↑
- [127] Department for Transport (2026) Updating the minimum emission standard for new road vehicles. https://www.gov.uk/government/consultations/updating-the-minimum-emission-standard-for-new-road-vehicles/updating-the-minimum-emission-standard-for-new-road-vehicles. ↑
- [128] European Commission (2024) Commission report under Article 12(3) of Regulation (EU) 2019/631 on the evolution of the real-world CO2 emissions gap for passenger cars and light commercial vehicles and containing the anonymised and aggregated real-world datasets referred to in Article 12 of Commission Implementing Regulation (EU) 2021/392. https://eur-lex.europa.eu/legal-content/EN/TXT/?uri=CELEX:52024DC0122. ↑
- [129] We applied the 2021 fuel consumption differential observed between petrol and PHEV vehicles from the referenced EU study to our household driving cost analysis assumptions about mileage, and electricity and fuel prices (see Table 5.1). We also assumed a 30% share of electrical energy used by PHEVs based on a study by Plötz, P. et al (2026). We assume PHEV drivers charge 100% at home. ↑
- [130] Plötz, P. et al (2026) Regulatory adjustments for plug-in hybrid vehicles in Europe. Report on the project Scientific Support for Climate Policy and Action Program. https://www.ifeu.de/fileadmin/uploads/Publikationen/Mobilit%C3%A4t/Plugin-Hybrid_Dateien/Analyse_PHEV_2025_EN_final.pdf. ↑
- [131] Mądziel, M. and Campisi, T. (2026). Real-World CO2 Emissions of Plug-In Hybrid Vehicles: European Assessment Using On-Board Fuel Consumption Monitoring Data. Energies. https://doi.org/10.3390/en19051165. ↑
- [132] This includes all installations under UK Government schemes, including the Energy Company Obligation, Warm Homes: Social Fund, and Warm Homes: Local Grant (and their predecessors). ↑
- [133] The CBGDP assumes that cumulative heat pump installations reach 2.5 million in 2030. A reasonable trajectory to delivering the heat pump target in the Warm Homes Plan would imply only around 1.9 million cumulative installations by 2030. However, the CBGDP deployment data only includes total cumulative heat pump deployment in five-year increments, which is not sufficient to track annual progress in new build and retrofit heat pump installations. We therefore use the Warm Homes Plan annual installation target to track deployment. ↑
- [134] Which (2025) Warming up to change. Homeowners’ uptake and attitudes towards home energy technology. https://media.product.which.co.uk/prod/files/file/gm-9a52f2fc-5e2b-47b1-a135-a5ec1df042d8-warming-up-to-change-homeowners-uptake-and-attitudes-towards-home-energy-technology-1.pdf. ↑
- [135] Department for Energy Security and Net Zero (2025) English Housing Survey 2023 to 2024: low carbon technologies in English homes. https://www.gov.uk/government/statistics/english-housing-survey-2023-to-2024-low-carbon-technologies-in-english-homes-fact-sheet/english-housing-survey-2023-to-2024-low-carbon-technologies-in-english-homes-fact-sheet. ↑
- [136] End fuel poverty coalition (2026) Suvation – Campaign Collective Data Tables. https://view.officeapps.live.com/op/view.aspx?src=https%3A%2F%2Fwww.endfuelpoverty.org.uk%2Fwp-content%2Fuploads%2FCampaign-Collective-Data-Tables-Survation-April-2026.xlsx&wdOrigin=BROWSELINK. (Accessed: 13 May 2026). ↑
- [137] Octopus (2026) Bright ideas: Solar interest surges 27% as homeowners seek energy independence amid global volatility. https://octopus.energy/press/more-news-press-releases/bright-ideas-solar-interest-surges-27-as-homeowners-seek-energy-independence-amid-global-volatility/. ↑
- [138] Octopus (2026) Solar and heat pump sales surge as Brits ditch fossil fuels. https://octopus.energy/press/solar-and-heat-pump-sales-surge-as-brits-ditch-fossil-fuels/. ↑
- [139] Which (2026) Smart energy: Flexible energy and low carbon technology adoption. https://www.which.co.uk/policy-and-insight/article/smart-energy-flexible-energy-and-low-carbon-technology-adoption-aAqsa8i3qrPV. ↑
- [140] Energy Systems Catapult (2026) What can the Living Lab tell us about home energy technology adoption?. https://es.catapult.org.uk/insight/what-can-the-living-lab-tell-us-about-home-energy-technology-adoption/. ↑
- [141] Electrify Research (2025) Research Snippet #15 – Use network effects to your advantage. https://www.electrifyresearch.co.uk/blog/snippet-12-use-network-effects-to-your-advantage. ↑
- [142] Citizens Advice (2025) Smart timing: making time-of-use tariffs work for consumers. https://assets.ctfassets.net/mfz4nbgura3g/5uQeElFNJsvvIzWL93eP1K/75615a9ed95e4ed9752f3162f42878c1/Smart_timing__making_time-of-use_tariffs_work_for_consumers__2_.pdf. ↑
- [143] Department for Energy Security and Net Zero (2026) DESNZ Public Attitudes Tracker: Energy bills and tariffs, Winter 2025, UK. https://www.gov.uk/government/statistics/desnz-public-attitudes-tracker-winter-2025/desnz-public-attitudes-tracker-energy-bills-and-tariffs-winter-2025-uk. ↑
- [144] Nesta (2023) Heat pumps: a user survey. https://media.nesta.org.uk/documents/Heat_pump_user_survey_report_May_2023.docx.pdf. ↑
- [145] Ofgem (2026) State of the Market Energy Retail Highlights. https://www.ofgem.gov.uk/sites/default/files/2026-01/State-of-the-Market-Energy-Retail-Highlights-January-2026.pdf. ↑
- [146] The wholesale cost of gas refers to the direct fuel costs for gas used by Ofgem in the calculation of the price cap, which were set before the start of the Iran war. ↑
- [147] The Scottish Government has also stated that it will not introduce policy to reduce livestock numbers. ↑
- [148] Scottish Government (2025) Climate Change (Scotland) Act 2009 (Scottish Carbon Budgets) Amendment Regulations 2025: statement. https://www.gov.scot/publications/statement-accompany-climate-change-scotland-act-2009-scottish-carbon-budgets-amendment-regulations-2025/pages/10/. ↑
- [149] House of Commons Library (2026) The impact of import standards on the agricultural sector. https://researchbriefings.files.parliament.uk/documents/CDP-2026-0009/CDP-2026-0009.pdf. ↑
- [150] Agriculture and Horticulture Development Board (2025) UK cattle and sheep populations continue to contract in Defra’s June survey: Beef and lamb market update. https://ahdb.org.uk/news/uk-cattle-and-sheep-populations-continue-to-contract-in-defra-s-june-survey-beef-and-lamb-market-update. (Accessed: 15 May 2026). ↑
- [151] Jones, A.E. et al (2019) Bluetongue risk under future climates. Nature climate change. https://doi.org/10.1038/s41558-018-0376-6. ↑
- [152] Department for Environment, Food and Rural Affairs (2025) Family food statistics. https://www.gov.uk/government/collections/family-food-statistics. ↑
- [153] Forest Research (2025) Forestry Statistics 2025. https://www.forestresearch.gov.uk/tools-and-resources/statistics/publications/forestry-statistics/forestry-statistics-2025/. ↑
- [154] This includes an estimate of the UK Emissions Trading Scheme (ETS) costs of gas use for energy-intensive manufacturers. To date, most of these sector’s emissions have been covered by free allowances, meaning the ETS costs are small and have only a minor impact on the ratio. ↑
- [155] Department for Business and Trade (2025) Energy intensive industries (EIIs): consultation of the proposed uplift to the Network Charging Compensation Scheme for energy intensive industries. https://www.gov.uk/government/consultations/network-charging-compensation-scheme-uplift-for-energy-intensive-industries/energy-intensive-industries-eiis-consultation-on-the-proposed-uplift-to-the-network-charging-compensation-scheme-for-energy-intensive-industries. ↑
- [156] This uses the Government’s 2024 estimate of electricity prices with the Supercharger and uplifted discount on network costs (£86/MWH), and DESNZ data on the average gas price paid by large industrial users in 2024. ↑
- [157] Department for Business and Trade (2025) Energy intensive industries (EIIs): consultation of the proposed uplift to the Network Charging Compensation Scheme for energy intensive industries. https://www.gov.uk/government/consultations/network-charging-compensation-scheme-uplift-for-energy-intensive-industries/energy-intensive-industries-eiis-consultation-on-the-proposed-uplift-to-the-network-charging-compensation-scheme-for-energy-intensive-industries. ↑
- [158] Department for Business and Trade (2026) Government cuts electricity bill for 10,000 manufacturers in boost for UK competitiveness. https://www.gov.uk/government/news/government-cuts-electricity-bill-for-10000-manufacturers-in-boost-for-uk-competitiveness. ↑
- [159] This uses the mid-point of the Government’s 2025 estimate of the discount from BICS (£37.5/MWh), and DESNZ data on electricity and gas prices paid by medium-sized industrial users in 2025. ↑
- [160] Department of Environment, Food and Rural Affairs (2026) Estimates of residual waste and municipal waste in England. https://www.gov.uk/government/statistics/estimates-of-residual-waste-and-municipal-residual-waste-in-england/estimates-of-residual-waste-excluding-major-mineral-wastes-and-municipal-residual-waste-in-england#municipal-residual-waste. ↑
- [161] These figures are based on values for ‘expected start date’ and ‘target commissioning date’ in the Low Carbon Contracts Company’s CfD register, as analysed by the CCC. This reflects the latest publicly available data on the planned development timeline of CfD projects at the time of writing; however, this may change as projects progress. This means a degree of uncertainty remains on the annual profile of future capacity. ↑
- [162] DNV (2026) DNV 2026 UK Energy Transition Outlook. https://www.dnv.com/energy-transition-outlook/uk/. ↑
- [163] Modo (2026) The Battery Buildout Report GB: Q4 2025 closes out a record-breaking year. https://modoenergy.com/research/en/gb-battery-energy-storage-capacity-buildout-q4-2025-projections-2026-clean-power. ↑
- [164] National Energy System Operator (2026) Connections Reform Results. https://www.neso.energy/industry-information/connections-reform/connections-reform-results. ↑
- [165] Office for National Statistics (2026) Low carbon and renewable energy economy, UK: 2024. https://www.ons.gov.uk/economy/environmentalaccounts/bulletins/finalestimates/2024. ↑
- [166] British Standards Institute (2026) Net Zero Barometer Report 2026. https://www.bsigroup.com/siteassets/pdf/en/insights-and-media/insights/white-papers/uk-ks-cross-thght-energy-sus-mpd-mp-netzerobarometerreport2026-0026-report.pdf. ↑
- [167] British Standards Institute (2025) Net Zero Barometer Report 2025. https://www.bsigroup.com/siteassets/pdf/en/insights-and-media/insights/white-papers/bsi-net-zero-barometer-report-2025.pdf. ↑
- [168] Nitrogen oxides (NOx) refers to nitric oxide (NO) and nitrogen dioxide (NO2), both of which are mainly formed during the combustion of fossil fuels. We track NO2 specifically, because it is particularly harmful to health. ↑
- [169] Department for Environment, Food and Rural Affairs, (2025) Environmental Improvement Plan (EIP.) https://www.gov.uk/government/publications/environmental-improvement-plan-2025/environmental-improvement-plan-eip-2025. ↑
- [170] Department for Energy Security and Net Zero (2026) DESNZ Public Attitudes Tracker. https://www.gov.uk/government/collections/public-attitudes-tracking-survey. ↑
- [171] Department for Transport (2026) Transport and transport technology: public attitudes tracker. https://www.gov.uk/government/publications/transport-and-transport-technology-public-attitudes-tracker. ↑
- [172] UK Government (2026) The Carbon Budget Order 2026. https://www.legislation.gov.uk/ukdsi/2026/9780348283815/data.pdf. (Accessed: 2 June 2026). ↑
- [173] White, K. (2026) Letter to Ruth Cadbury, 17 April 2026. Department for Energy Security and Net Zero. https://committees.parliament.uk/publications/52773/documents/294012/default/. ↑
- [174] HM Treasury (2025) Spending Review 2025. https://www.gov.uk/government/publications/spending-review-2025-document/spending-review-2025-html. ↑
- [175] Department for Energy Security and Net Zero (2025) Energising Britain: Your voice in our Clean Energy Superpower Mission. https://www.gov.uk/government/publications/energising-britain-your-voice-in-our-clean-energy-superpower-mission. ↑
- [176] Great British Energy and Department for Energy Security and Net Zero (2026) Local Power Plan. https://www.gov.uk/government/publications/local-power-plan. ↑
- [177] The 2035 NDC is consistent with the level of the Sixth Carbon Budget. However, after adjustments to the latest emissions inventory, the 2035 NDC is narrowly missed. This is due to the inventory adjustments reducing the baseline against which the NDC is calculated. Before these adjustments, the CBGDP pathway meets the 2035 NDC. Our assessment relates to the Sixth Carbon Budget. ↑
- [178] Department for Energy Security and Net Zero (2025) Energy and emissions projections: 2023 to 2050. https://www.gov.uk/government/publications/energy-and-emissions-projections-2023-to-2050. (Accessed: 22 May 2026). ↑
- [179] Department for Transport and The Rt Hon Heidi Alexander MP (2026) Written statement to Parliament: Update to forecasts of greenhouse gas emissions from aviation. https://www.gov.uk/government/speeches/update-to-forecasts-of-greenhouse-gas-emissions-from-aviation. ↑
- [180] Department for Environment, Food and Rural Affairs (2025) Policy paper. Tree canopy and woodland cover Environment Act target delivery plan. https://www.gov.uk/government/publications/tree-canopy-and-woodland-cover-environment-act-target-delivery-plan/tree-canopy-and-woodland-cover-environment-act-target-delivery-plan. ↑
- [181] Department for Energy Security and Net Zero (2025) United Kingdom of Great Britain and Northern Ireland’s 2035 Nationally Determined Contribution. https://www.gov.uk/government/publications/uks-2035-nationally-determined-contribution-ndc-emissions-reduction-target-under-the-paris-agreement/united-kingdom-of-great-britain-and-northern-irelands-2035-nationally-determined-contribution. ↑
- [182] Circular Online (2025) Circular Economy Strategy delayed until 2026. https://www.circularonline.co.uk/news/circular-economy-strategy-delayed-until-2026/. ↑
- [183] Prime Minister’s Office (2026) The King’s Speech 2026 Background Briefing Notes. https://assets.publishing.service.gov.uk/media/6a046665c0cc74b4523e4d3b/The_King_s_Speech_2026_-_background_briefing_notes.pdf. ↑
- [184] Carbon budgets are set as an absolute emissions limit (in MtCO2e). In this section we have converted the carbon budgets to implied percentage reductions using the final 1990 to 2024 greenhouse gas emissions inventory. This inventory was released after the CBGDP was published. ↑
- [185] Emissions savings in the CBGDP are presented as averages across carbon budget periods. To assess progress towards the 2030 NDC, we score the emissions savings for the Fifth Carbon Budget period, which covers the years 2028 to 2032. As the CBGDP pathway is relatively linear at this point, the difference between the projected emissions in 2030 and the average over 2028 to 2032 is minimal, so this should provide an accurate means of assessing this target. ↑
- [186] To compare the levels of emissions covered by each scoring category against our 2025 assessment, we have adjusted the published values to account for changes in the inventory of emissions, so that all values are presented in terms of the final 1990 to 2024 greenhouse gas emissions inventory. As our assessment this year is based on the Government’s new CBGDP pathway for the first time, it is not meaningful to compare the percentage shares in each score category to our 2025 assessment, as the baseline and pathway they are based on are different. ↑
- [187] The 2035 NDC is consistent with the level of the Sixth Carbon Budget. However, after adjustments to the latest emissions inventory, the 2035 NDC is narrowly missed. This is due to the inventory adjustments reducing the baseline against which the NDC is calculated. Before these adjustments, the CBGDP pathway meets the 2035 NDC. Our assessment relates to the Sixth Carbon Budget. ↑
- [188] Autotrader (2025) Consumer interest in EVs surges following launch of Government Electric Car Grant. https://plc.autotrader.co.uk/news-views/press-releases/consumer-interest-in-evs-surges-following-launch-of-government-electric-car-grant/. ↑
- [189] Department for Transport (2026) Zero emission vehicles eligible for a grant. https://www.gov.uk/zero-emission-vehicle-grants/cars. (Accessed: 13 May 2026). ↑
- [190] UK House of Commons Transport Committee (2026) Written evidence SEV0095. https://committees.parliament.uk/writtenevidence/162223/html/. ↑
- [191] HM Revenue and Customs (2025) Plug-in hybrid electric vehicles — benefits in kind easement. https://www.gov.uk/government/publications/benefits-in-kind-easement-for-plug-in-hybrid-electric-vehicles/plug-in-hybrid-electric-vehicles-benefits-in-kind-easement. ↑
- [192] Department for Transport (2025) Phasing out sales of new petrol and diesel cars from 2030 and supporting the ZEV transition: summary of responses and joint government response. https://www.gov.uk/government/consultations/phasing-out-sales-of-new-petrol-and-diesel-cars-from-2030-and-supporting-the-zev-transition/outcome/phasing-out-sales-of-new-petrol-and-diesel-cars-from-2030-and-supporting-the-zev-transition-summary-of-responses-and-joint-government-response. ↑
- [193] Climate Change Committee (2025) Letter: CCC response to Secretary of State for Transport on the VETS Order. https://www.theccc.org.uk/publication/letter-ccc-response-to-secretary-of-state-for-transport-vets-order/. ↑
- [194] Subsidy Advice Unit (2026) Report on the Zero Emission Truck Grant and Zero Emission Van Grant subsidy scheme. https://assets.publishing.service.gov.uk/media/69c145efcfa346b9d4704a82/Commercial_Vehicles_Final_Report.pdf. ↑
- [195] Department for Transport (2025) Zero emission goods vehicles: regulatory flexibility consultation response. https://www.gov.uk/government/consultations/zero-emission-vans-regulatory-flexibility/outcome/zero-emission-goods-vehicles-regulatory-flexibility-consultation-responsehttps://www.gov.uk/government/consultations/zero-emission-vans-regulatory-flexibility/outcome/zero-emission-goods-vehicles-regulatory-flexibility-consultation-response#government-response. ↑
- [196] Department for Transport (2025) Zero emission vans: regulatory flexibility. https://www.gov.uk/government/consultations/zero-emission-vans-regulatory-flexibility/zero-emission-vans-regulatory-flexibility. ↑
- [197] HM Treasury (2026) Referral of the proposed Business Rates Relief for Electric Vehicle (EV) chargepoints and EV-only forecourts by HM Treasury. https://www.gov.uk/cma-cases/referral-of-the-proposed-business-rates-relief-for-electric-vehicle-ev-chargepoints-and-ev-only-forecourts-by-hm-treasury. ↑
- [198] UK House of Commons Transport Committee (2026) Written evidence SEV0101. https://committees.parliament.uk/writtenevidence/162232/html/. ↑
- [199] ChargeUK (2025) Action on high energy costs needed to keep EV transition on track. https://www.chargeuk.org/post/action-on-high-energy-costs-needed-to-keep-ev-transition-on-track. ↑
- [200] HM Revenue and Customs (2026) VAT liability of supplies of electricity from public electric vehicle charge points. https://www.gov.uk/government/publications/revenue-and-customs-brief-4-2026-vat-liability-of-supplies-of-electricity-from-public-electric-vehicle-charge-points/vat-liability-of-supplies-of-electricity-from-public-electric-vehicle-charge-points. ↑
- [201] UK House of Commons Transport Committee (2026) Written evidence SEV0105. https://committees.parliament.uk/writtenevidence/162238/html/. ↑
- [202] UK House of Commons Transport Committee (2026) Written evidence SEV0101. https://committees.parliament.uk/writtenevidence/162232/html/. ↑
- [203] UK House of Commons Transport Committee (2026) Written evidence SEV0105. https://committees.parliament.uk/writtenevidence/162238/html/. ↑
- [204] Bus Services Act (2025) Section 151A. https://www.legislation.gov.uk/ukpga/2025/24. ↑
- [205] Ministry of Housing, Communities and Local Government (2025) English Devolution and Community Empowerment Bill: Guidance. https://www.gov.uk/government/publications/english-devolution-and-community-empowerment-bill-guidance/english-devolution-and-community-empowerment-bill-guidance. ↑
- [206] Department for Energy Security and Net Zero (2026) Warm Homes Plan: Technical Annex. https://www.gov.uk/government/publications/warm-homes-plan/warm-homes-plan-technical-annex. ↑
- [207] The CBGDP assumes that cumulative heat pump installations reach 2.5 million in 2030. A reasonable trajectory to delivering the heat pump target in the Warm Homes Plan would imply only around 1.9 million cumulative installations by 2030. However, the CBGDP deployment data only includes total cumulative heat pump deployment in five-year increments, so this is an indicative comparison based on assumptions about the pace of scale up between 2025 and 2030. ↑
- [208] Department for Energy Security and Net Zero (2026) Consultation outcome: Improving the energy performance of privately rented homes in England and Wales: 2025 update. https://www.gov.uk/government/consultations/improving-the-energy-performance-of-privately-rented-homes-2025-update. ↑
- [209] Department for Energy Security and Net Zero (2026) Consultation outcome: Improving the energy performance of privately rented homes in England and Wales: 2025 update. https://www.gov.uk/government/consultations/improving-the-energy-performance-of-privately-rented-homes-2025-update. ↑
- [210] Department for Energy Security and Net Zero (2026) Improving the energy performance of privately rented homes in England and Wales: Final stage impact assessment. https://assets.publishing.service.gov.uk/media/6980df5b3915f71236580138/prs-homes-energy-performance-impact-assessment.pdf. ↑
- [211] Ministry of Housing, Communities and Local Government (2026) Consultation outcome: Improving the energy efficiency of socially rented homes in England. https://www.gov.uk/government/consultations/improving-the-energy-efficiency-of-socially-rented-homes-in-england. ↑
- [212] Ministry of Housing, Communities and Local Government (2026) Improving the energy efficiency of socially rented homes in England: Final stage impact assessment. https://assets.publishing.service.gov.uk/media/69ccbc3eb5ac47b0874f3fbf/SRS_MEES_final-stage_IA.pdf. ↑
- [213] Consumer-led flexibility (CLF), such as smart electric vehicle charging, smart heat pumps, and use of home batteries, involves the voluntary shifting of electricity use away from peak periods to times when supply is more abundant, cheaper, and cleaner. ↑
- [214] The PSDS also covered public sector buildings in reserved policy areas. ↑
- [215] HM Treasury (2025) Budget 2025. https://www.gov.uk/government/publications/budget-2025-document. ↑
- [216] Department for Energy Security and Net Zero (2026) Warm Homes Plan. https://www.gov.uk/government/publications/warm-homes-plan. ↑
- [217] Department for Business, Energy and Industrial Strategy (2019) Non-domestic Private Rented Sector minimum energy efficiency standards: future trajectory to 2030. https://www.gov.uk/government/consultations/non-domestic-private-rented-sector-minimum-energy-efficiency-standards-future-trajectory-to-2030. ↑
- [218] Department for Environment, Food and rural Affairs (2025) Farming Profitability Review: recommendations published. https://defrafarming.blog.gov.uk/2025/12/18/farming-profitability-review-recommendations-published/. ↑
- [219] UK Government (2025) The UK’s Methane Action Plan. https://assets.publishing.service.gov.uk/media/6901f73a71b575684c3cf7ad/uk-methane-action-plan.pdf. ↑
- [220] Department for Environment, Food and Rural Affairs (2025) Environmental Improvement Plan (EIP) 2025. https://www.gov.uk/government/publications/environmental-improvement-plan-2025/environmental-improvement-plan-eip-2025. ↑
- [221] Scottish Government (2026) Rural Support Plan: 2026-2031. https://www.gov.scot/binaries/content/documents/govscot/publications/strategy-plan/2026/03/rural-support-plan-rsp/documents/rural-support-plan-2026-2030/rural-support-plan-2026-2030/govscot%3Adocument/rural-support-plan-2026-2030.pdf. ↑
- [222] Welsh Government (2025) Sustainable Farming Scheme 2026: scheme description. https://www.gov.wales/sustainable-farming-scheme-2026-scheme-description-html. ↑
- [223] Department for Agriculture, Environment and Rural Affairs (2026) Farm Sustainability Standards (FSS). https://www.daera-ni.gov.uk/articles/farm-sustainability-standards-fss. ↑
- [224] National Audit Office (2026) The Nature for Climate Fund. https://www.nao.org.uk/wp-content/uploads/2026/03/the-nature-for-climate-fund-summary.pdf. ↑
- [225] Department for Environment, Food and Rural Affairs (2025) Environmental Improvement Plan (EIP) 2025. https://www.gov.uk/government/publications/environmental-improvement-plan-2025/environmental-improvement-plan-eip-2025. ↑
- [226] Scottish Government (2025) Peatland ACTION five year partnership plan 2025 – 2030. https://www.gov.scot/publications/peatland-action-five-year-partnership-plan-2025-2030/. ↑
- [227] Natural Resources Wales (2025) Wales Peatland Action through the National Peatland Action Programme 2025-2030. https://cdn.cyfoethnaturiol.cymru/av3hhxjt/npap-5-year-plan-v7-eng.pdf. ↑
- [228] Department of Agriculture, Environment and Rural Affairs (2025) Northern Ireland Peatland Strategy to 2040. https://www.daera-ni.gov.uk/publications/northern-ireland-peatland-strategy-2040. ↑
- [229] Hood, A. S. C., et al (2025) Identifying knowledge barriers to agroforestry adoption and co-designing solutions to them. BES People and Nature. https://besjournals.onlinelibrary.wiley.com/doi/10.1002/pan3.70219. ↑
- [230] HM Government (2024) Tata Steel / Port Talbot steelworks Q&A. https://www.gov.uk/government/news/tata-steel-port-talbot-steelworks-qa. ↑
- [231] Department for Business and Trade (2026) New legislation gives Government power to bring British Steel into public ownership. https://www.gov.uk/government/news/new-legislation-gives-government-power-to-bring-british-steel-into-public-ownership. ↑
- [232] Department for Business and Trade (2025) The UK’s Modern Industrial Strategy. https://www.gov.uk/government/publications/industrial-strategy. ↑
- [233] Department for Business and Trade (2025) Energy intensive industries (EIIs): consultation on the proposed uplift to the Network Charging Compensation Scheme for energy intensive industries. https://www.gov.uk/government/consultations/network-charging-compensation-scheme-uplift-for-energy-intensive-industries/energy-intensive-industries-eiis-consultation-on-the-proposed-uplift-to-the-network-charging-compensation-scheme-for-energy-intensive-industries. ↑
- [234] This is based on the Government’s estimates of the average size of the discounts, compared to average electricity prices reported by industrial users. ↑
- [235] Department for Business and Trade (2026) British Industrial Competitiveness Scheme: consultation on scheme eligibility and approach. https://www.gov.uk/government/consultations/british-industrial-competitiveness-scheme-consultation-on-scheme-eligibility-and-approach/british-industrial-competitiveness-scheme-consultation-on-scheme-eligibility-and-approach. ↑
- [236] Tomlinson, D. (2026) Carbon price support. HCWS1519. 16 April 2026. https://questions-statements.parliament.uk/written-statements/detail/2026-04-16/hcws1519. ↑
- [237] Department for Energy Security and Net Zero (2026) Industrial Energy Transformation Fund. https://www.gov.uk/government/collections/industrial-energy-transformation-fund. ↑
- [238] Scottish Government (no date) Scottish Industrial Energy Transformation Fund (SIETF). https://www.gov.scot/policies/energy-efficiency/scottish-industrial-energy-transformation-fund/. ↑
- [239] Department for Energy Security and Net Zero (2026) Government steps in to back long-term resilience of UK’s chemicals and ceramics industry. https://www.gov.uk/government/news/government-steps-in-to-back-long-term-resilience-of-uks-chemicals-and-ceramics-industries ↑
- [240] Department for Energy Security and Net Zero (2026) Accelerating electricity network connections for strategic demand. https://www.gov.uk/government/consultations/accelerating-electricity-network-connections-for-strategic-demand/accelerating-electricity-network-connections-for-strategic-demand-accessible-webpage. ↑
- [241] Systemiq (2025) Cleantech reality check: electrification. https://www.systemiq.earth/resource-category/cleantech-reality-check-electrification/. ↑
- [242] Molson Coors (2026) Molson Coors installs a new heat pump system at Burton Brewery following multi-million pound investment. https://www.molsoncoors.com/UKandIreland/news/molson-coors-installs-new-heat-pump-system-burton-brewery-following-multi-million. ↑
- [243] Heat Pumps Today (2026) How a new type of heat pump is helping Hepworth Brewery cut energy and emissions. https://www.acrjournal.uk/heat-pumps/how-a-new-type-of-heat-pump-is-helping-hepworth-brewery-cut-energy-and/ https://www.acrjournal.uk/heat-pumps/how-a-new-type-of-heat-pump-is-helping-hepworth-brewery-cut-energy-and/. ↑
- [244] Heatcatcher (2025) Heatcatcher commissions the UK’s first waste heat to high temperature heat pump at weinerberger Warnham. https://heatcatcher.com/case-studies. ↑
- [245] Baker, S. (2025) BASF begins installation of industrial heat pump to deliver net-zero steam at Ludwigshafen. The Chemical Engineer. https://www.thechemicalengineer.com/news/basf-begins-installation-of-industrial-heat-pump-to-deliver-net-zero-steam-at-ludwigshafen/. ↑
- [246] UPM (2023) UPM electrified heat and steam production at its mills in Finland and Germany. https://www.upm.com/news-and-stories/releases/2023/04/upm-electrifies-heat-and-steam-production-at-its-mills-in-finland-and-germany/. ↑
- [247] International Energy Agency (2026) Renewables for Industry: Electrification of low-temperature heat and steam. https://iea.blob.core.windows.net/assets/7629a238-e862-47c9-b2d4-2cbd408ad171/RenewablesforIndustryElectrificationoflow-temperatureheatandsteam.pdf. ↑
- [248] Systemiq (2025) A lightning moment for industry: how to reach positive tipping points in electrification of industrial heat. https://www.systemiq.earth/wp-content/uploads/2024/11/Decarbonizing-low-to-medium-industrial-heat.pdf. ↑
- [249] BASF (2024) BASF, SABIC and Linde celebrate the start-up of the world’s first large-scale electrically heated steam cracking furnace. https://www.basf.com/global/en/media/news-releases/2024/04/p-24-177. ↑
- [250] Verallia (2024) Verallia inaugurates its first 100% electric furnace. https://www.verallia.com/en/communique-de-presse/cognac-electric-furnace-inauguration/. ↑
- [251] Brick and Tile Industry International (2026) One year in Uttendorf: 7,000 tonnes of carbon dioxide saved thanks to Wienergerger’s ‘greenest’ brick production. https://www.zi-online.info/en/news/one-year-in-uttendorf-7000-tonnes-of-carbon-dioxide-saved-thanks-to-wienerbergers-greenest-brick-production-4339140.html. ↑
- [252] Rondo (2050) Rondo Energy to deploy 100 MWh heat battery for Heineken, powered by solar from EDP. https://www.rondo.com/news-press/rondo-and-edp-to-deploy-heat-battery-for-heineken. ↑
- [253] Keane, K. (2026) Distillery claims ‘world first’ in bid to produce low-carbon whisky. BBC News. https://www.bbc.co.uk/news/articles/cg54npv62r3o. ↑
- [254] HM Treasury (2025) Spending Review 2025. https://www.gov.uk/government/publications/spending-review-2025-document/spending-review-2025-html. ↑
- [255] HyNet (2025) HyNet gets green light to power ahead into construction, marking a major milestone for UK industry across the North West and North Wales. https://hynet.co.uk/wp-content/uploads/2025/04/24052025-HyNet-gets-green-light.pdf. ↑
- [256] East Coast Cluster (no date) Northern Endurance Partnership greenlights UK’s first CO2 transportation and storage infrastructure project. https://eastcoastcluster.co.uk/press-release/northern-endurance-partnership-greenlights-uks-first-co2-transportation-and-storage-infrastructure-project/. (Accessed: 21 May 2026). ↑
- [257] Heidelberg Materials (2025) Heidelberg Materials takes Final Investment Decision for CCS project in UK – construction will start this year. https://www.heidelbergmaterials.com/en/pr-2025-09-25. https://www.heidelbergmaterials.com/en/pr-2025-09-25. ↑
- [258] HM Treasury (2025) Chancellor’s National Wealth Fund investment in major carbon capture project to boost 3,500 jobs. https://www.gov.uk/government/news/chancellors-national-wealth-fund-investment-in-major-carbon-capture-project-to-boost-3500-jobs. ↑
- [259] Department for Energy Security and Net Zero (2026) Carbon capture, usage and storage: non-pipeline transport. https://www.gov.uk/government/consultations/carbon-capture-usage-and-storage-ccus-non-pipeline-transport. ↑
- [260] Department for Energy Security and Net Zero (2026) CCUS East Coast Cluster: NPT Pathfinder selection process. https://www.gov.uk/government/publications/ccus-east-coast-cluster-npt-pathfinder-selection-process. ↑
- [261] Department for Energy Security and Net Zero (2025) Growing the market for low carbon industrial products: policy framework. https://www.gov.uk/government/consultations/growing-the-market-for-low-carbon-industrial-products-policy-framework. ↑
- [262] HM Government (2025) Government response to the Climate Change Committee: Progress in reducing emissions – 2025 report to Parliament. https://assets.publishing.service.gov.uk/media/69010a44afec1781f77994fb/climate-change-committee-progress-report-2025-government-response.pdf. ↑
- [263] HM Revenue and Customs (2026) Carbon border adjustment mechanism: Policy summary. https://www.gov.uk/government/publications/carbon-border-adjustment-mechanism-cbam-policy-summary/carbon-border-adjustment-mechanism-cbam-policy-summary#background. ↑
- [264] European Commission (no date) Carbon Border Adjustment Mechanism. https://taxation-customs.ec.europa.eu/carbon-border-adjustment-mechanism_en. (Accessed 21 May 2026). ↑
- [265] Department for Energy Security and Net Zero (2026) UK Emissions Trading Scheme (UK ETS): a policy overview. https://www.gov.uk/government/publications/uk-emissions-trading-scheme-uk-ets-policy-overview/uk-emissions-trading-scheme-uk-ets-a-policy-overview#linking-to-other-emissions-trading-schemes. ↑
- [266] UK Government (2026) Sustainable Aviation Fuel Act 2026. https://www.legislation.gov.uk/ukpga/2026/9/contents/enacted. ↑
- [267] International Aviation Transport Association (2025) Reviving the Commercial Aircraft Supply Chain. https://www.iata.org/contentassets/85b59d951fc04c1c83fa2aab47824300/reviving-the-commercial-aircraft-supply-chain.pdf. ↑
- [268] Department for Energy Security and Net Zero (2026) Decisive action to break influence of gas on electricity prices. https://www.gov.uk/government/news/decisive-action-to-break-influence-of-gas-on-electricity-prices. ↑
- [269] Ofgem (2026) Renewables Obligation Annual Report: Scheme Year 23 from 1 April 2024 to 31 March 2025. https://www.ofgem.gov.uk/transparency-document/renewables-obligation-annual-report-scheme-year-23-1-april-2024-31-march-2025. ↑
- [270] Ember (2026) British power prices are increasingly independent from gas. https://ember-energy.org/latest-insights/british-power-prices-are-increasingly-independent-from-gas/. ↑
- [271] Tomlinson, D. (2026) Carbon price support. HCWS1519. 16 April 2026. https://questions-statements.parliament.uk/written-statements/detail/2026-04-16/hcws1519. ↑
- [272] Aurora (2026) Losing Support: The implications of the retirement of the Carbon Price Support (CPS) for Aurora’s Q2’26 Central scenario for Great Britain. https://eos.auroraer.com/dragonfly/home/content-explorer/content/4090. ↑
- [273] Climate Change Committee (2023) Delivering a reliable decarbonised power system. https://www.theccc.org.uk/wp-content/uploads/2023/03/Delivering-a-reliable-decarbonised-power-system.pdf. ↑
- [274] Department for Energy Security and Net Zero (2025) Sizewell C: Regulated Asset Base (RAB). https://www.gov.uk/government/publications/sizewell-c-regulated-asset-base-rab. ↑
- [275] Department for Energy Security and Net Zero (2026) Sizewell C Project Summary Business Case. https://assets.publishing.service.gov.uk/media/699c31f48eef11b95e49bfed/summary-business-case-sizewell-c.pdf. ↑
- [276] Department for Energy Security and Net Zero (2026) North Wales to pioneer UK’s first small modular reactors. https://www.gov.uk/government/news/north-wales-to-pioneer-uks-first-small-modular-reactors. ↑
- [277] Department for Energy Security and Net Zero (2026) Building our nuclear nation: government response to the Nuclear Regulatory Review 2025. https://www.gov.uk/government/publications/building-our-nuclear-nation-government-response-to-the-nuclear-regulatory-review-2025/building-our-nuclear-nation-government-response-to-the-nuclear-regulatory-review-2025-accessible-webpage. ↑
- [278] Prime Minister’s Office (2026) The King’s Speech 2026 Background Briefing Notes. https://assets.publishing.service.gov.uk/media/6a046665c0cc74b4523e4d3b/The_King_s_Speech_2026_-_background_briefing_notes.pdf. ↑
- [279] Department for Energy Security and Net Zero (2026) Lynemouth Power Station: agreement between DESNZ and EP Lynemouth Ltd. https://www.gov.uk/government/publications/lynemouth-power-station-agreement-between-desnz-and-ep-lynemouth-ltd. ↑
- [280] Department for Energy Security and Net Zero (2025) HyNet expansion: project negotiation list. https://www.gov.uk/government/publications/hynet-track-1-expansion-selected-projects/hynet-expansion-project-negotiation-list. ↑
- [281] Ofgem (2025) LDES Eligibility Assessment Outcome. https://www.ofgem.gov.uk/sites/default/files/2025-09/LDES%20Eligibility%20Assessment%20Outcome.pdf. ↑
- [282] Ofgem (2025) RIIO-3 Final Determinations: electricity transmission. https://www.ofgem.gov.uk/sites/default/files/2025-12/RIIO-3-Final-Determinations-ET.pdf. ↑
- [283] Ofgem (2026) Sector specific methodology consultation: electricity distribution price control (ED3). https://www.ofgem.gov.uk/consultation/sector-specific-methodology-consultation-electricity-distribution-price-control-ed3. ↑
- [284] Department for Energy Security and Net Zero (2026) Reformed National Pricing Delivery Plan: Chapter 3: Constraints Management Action Plan. https://www.gov.uk/government/publications/reformed-national-pricing-rnp-delivery-plan. ↑
- [285] National Energy System Operator (2025) Connections Reform Results. https://www.neso.energy/industry-information/connections-reform/connections-reform-results. ↑
- [286] Department for Energy Security and Net Zero (2025) Clean Flexibility Roadmap. https://www.gov.uk/government/publications/clean-flexibility-roadmap. ↑
- [287] Department for Energy Security and Net Zero (2025) Review of electricity market arrangements (REMA): Summer update, 2025. https://www.gov.uk/government/publications/review-of-electricity-market-arrangements-rema-summer-update-2025. ↑
- [288] Department for Energy Security and Net Zero (2026) Reformed National Pricing Delivery Plan. https://www.gov.uk/government/publications/reformed-national-pricing-rnp-delivery-plan. ↑
- [289] UK Parliament (2025) Planning and Infrastructure Act 2025 (c. 34).
https://www.legislation.gov.uk/ukpga/2025/34. ↑ - [290] Department for Energy Security and Net Zero (2026) Electricity Network Infrastructure: Consents, Land Access and Rights. https://assets.publishing.service.gov.uk/media/69eb8974ed93f72cf81633be/electricity-network-infrastructure-consultation-government-response.pdf. ↑
- [291] HM Treasury (2026) Getting Britain Building: Reforming Judicial Review for Infrastructure. https://www.gov.uk/government/publications/getting-britain-building-reforming-judicial-review-for-infrastructure. ↑
- [292] Department for Environment, Food and Rural Affairs (2026) Extended producer responsibility for packaging: who is affected and what to do. https://www.gov.uk/guidance/extended-producer-responsibility-for-packaging-who-is-affected-and-what-to-do. ↑
- [293] Department for Environment, Food and Rural Affairs (2025) Simpler recycling: household recycling in England. https://www.gov.uk/guidance/simpler-recycling-household-recycling-in-england. ↑
- [294] Department for Environment, Food and Rural Affairs (2025) Deposit Return Scheme: drinks producer and retailer responsibilities. https://www.gov.uk/guidance/deposit-return-scheme-drinks-producer-and-retailer-responsibilities. ↑
- [295] Encyclis (no date) Encyclis and UK Government sign landmark agreement on UK’s first full-scale carbon capture project for Energy-from-Waste. https://www.encyclis.com/news/encyclis-and-uk-government-sign-landmark-agreement-for-uks-first-full-scale-carbon-capture-project-for-energy-from-waste/. (Accessed 22 May 2026). ↑
- [296] Department for Energy Security and Net Zero (2025) HyNet expansion: project negotiation list. https://www.gov.uk/government/publications/hynet-track-1-expansion-selected-projects/hynet-expansion-project-negotiation-list. ↑
- [297] Environment Agency (2026) Decarbonisation readiness in environmental permit applications. https://www.gov.uk/government/publications/decarbonisation-readiness-in-environmental-permit-applications/decarbonisation-readiness-in-environmental-permit-applications. ↑
- [298] Department for Energy Security and Net Zero (2026) UK Emissions Trading Scheme (UK ETS): a policy overview. https://www.gov.uk/government/publications/uk-emissions-trading-scheme-uk-ets-policy-overview/uk-emissions-trading-scheme-uk-ets-a-policy-overview#expanding-the-coverage-of-the-uk-ets. ↑
- [299] Climate Change Committee (2024) Letter: Advice on implementing the expansion of the UK ETS. https://www.theccc.org.uk/publication/letter-advice-on-implementing-the-expansion-of-the-uk-ets/. ↑
- [300] House of Commons Library (2025) Renewables Obligation Certification Scheme. https://researchbriefings.files.parliament.uk/documents/CDP-2025-0055/CDP-2025-0055.pdf. ↑
- [301] Climate Change Committee (2024) COP28: Key outcomes and next steps for the UK. https://www.theccc.org.uk/publication/cop28-key-outcomes-and-next-steps-for-the-uk/. ↑
- [302] North Sea Transition Authority (2025) Emissions Monitoring Report 2025. https://www.nstauthority.co.uk/news-publications/emissions-monitoring-report-2025/. ↑
- [303] CBGDP emissions reductions are based on the NSTA’s EMR 2024 scenarios, which assumed higher levels of likely abatement from electrification of platforms than EMR 2025 scenarios. ↑
- [304] Department for Energy Security and Net Zero (2025) North Sea Future Plan: Government response to the “Building the North Sea’s Energy Future” consultation. https://www.gov.uk/government/news/north-sea-future-plan-for-fair-managed-and-prosperous-transition. ↑
- [305] Department for Energy Security and Net Zero and Department for Business, Energy and Industrial Strategy (2022) Notice – Cluster sequencing Phase-2: eligible projects (power CCUS, hydrogen and ICC), March 2022. https://www.gov.uk/government/publications/cluster-sequencing-phase-2-eligible-projects-power-ccus-hydrogen-and-icc/cluster-sequencing-phase-2-eligible-projects-power-ccus-hydrogen-and-icc. ↑
- [306] Essar (2025) Essar Energy Transition’s Hydrogen-Ready Furnace now Powering EET Fuels’ Stanlow Site. https://www.essar.com/inthenews/essar-energy-transitions-hydrogen-ready-furnace-now-powering-eet-fuels-stanlow-site/. ↑
- [307] Green hydrogen, or electrolytic hydrogen, is hydrogen produced by splitting water into hydrogen and oxygen using renewable electricity through electrolysis. ↑
- [308] Low Carbon Contracts Company (no date) Register Data Archive. https://register.lowcarboncontracts.uk/downloadfiles. (Accessed: 6 May 2026). ↑
- [309] Burgess, J. (2025) ScottishPower halts hydrogen project developments in ‘challenging market’. S&P Global. https://www.spglobal.com/energy/en/news-research/latest-news/energy-transition/090225-scottishpower-halts-hydrogen-project-developments-in-challenging-market. (Accessed: 6 May 2026). ↑
- [310] Low Carbon Contracts Company (no date) Register Data Archive. https://register.lowcarboncontracts.uk/downloadfiles. (Accessed: 6 May 2026). ↑
- [311] Department for Energy Security and Net Zero (2025) Hydrogen update to the market: July 2025. https://www.gov.uk/government/publications/hydrogen-update-to-the-market-july-2025. ↑
- [312] Blue hydrogen is produced from natural gas through steam methane reforming, using CCS to capture and store the resulting CO2. ↑
- [313] Department for Energy Security and Net Zero (2025) HyNet expansion: project negotiation list. https://www.gov.uk/government/publications/hynet-track-1-expansion-selected-projects/hynet-expansion-project-negotiation-list. ↑
- [314] Currie, C. (2026) CHP anchors offtake for EET’s 350MW blue hydrogen project targeting 2026 FID. Gas World. https://www.gasworld.com/story/chp-anchors-offtake-for-eets-350mw-blue-hydrogen-project-targeting-2026-fid/2244340.article/. (Accessed: 6 May 2026). ↑
- [315] Murugesu, J. A. (2025) Pulled hydrogen plant ‘discouraging’ for net zero. BBC News. https://www.bbc.co.uk/news/articles/cn09zg32g3lo. ↑
- [316] Whitfield, G. (2025) BP pulls out of Teesside hydrogen scheme over clash with data centre plan. Teesside Live. https://www.gazettelive.co.uk/news/teesside-news/bp-teesside-hydrogen-data-centre-32980567. ↑
- [317] Department for Energy Security and Net Zero (2025) Hydrogen update to the market: July 2025. https://www.gov.uk/government/publications/hydrogen-update-to-the-market-july-2025. ↑
- [318] Department for Energy Security and Net Zero (2025) UK ETS scope expansion: domestic maritime – main Authority response. https://www.gov.uk/government/consultations/uk-ets-scope-expansion-maritime-sector/outcome/uk-ets-scope-expansion-domestic-maritime-main-authority-response-accessible-webpage. ↑
- [319] International Maritime Organization (2025) IMO net-zero shipping talks to resume in 2026. www.imo.org/en/mediacentre/pressbriefings/pages/imo-net-zero-shipping-talks-to-resume-in-2026.aspx. ↑
- [320] Department for Energy Security and Net Zero (2025) UK ETS: Scope expansion – emissions from international maritime voyages consultation. https://www.gov.uk/government/consultations/uk-ets-scope-expansion-emissions-from-international-maritime-voyages/uk-ets-scope-expansion-emissions-from-international-maritime-voyages-consultation-accessible-webpage. ↑
- [321] Whitehead, A. (2025) Independent Review of Greenhouse Gas Removals. https://www.gov.uk/government/publications/greenhouse-gas-removals-ggrs-independent-review. ↑
- [322] Department for Energy Security and Net Zero (2025) Greenhouse Gas Removals (GGR): business model. https://www.gov.uk/government/publications/greenhouse-gas-removals-ggr-business-model. (Accessed: 23 April 2026). ↑
- [323] Department for Energy Security and Net Zero (2023) Greenhouse Gas Removals – Update on the design of the Greenhouse Gas Removals (GGR) Business Model and Power Bioenergy with Carbon Capture and Storage (Power BECCS) Business Model. https://www.gov.uk/government/publications/greenhouse-gas-removals-ggr-business-model. ↑
- [324] UK Government, Scottish Government, Welsh Government and Department of Agriculture, Environment and Rural Affairs for Northern Ireland (2025) Consultation outcome | Integrating greenhouse gas removals in the UK Emissions Trading Scheme. https://www.gov.uk/government/consultations/integrating-greenhouse-gas-removals-in-the-uk-emissions-trading-scheme. ↑
- [325] Encyclis (2025) Encyclis and UK Government sign landmark agreement on UK’s first full-scale carbon capture project for Energy-from-Waste. https://www.encyclis.com/news/encyclis-and-uk-government-sign-landmark-agreement-for-uks-first-full-scale-carbon-capture-project-for-energy-from-waste/. ↑
- [326] Department for Energy Security and Net Zero (2025) HyNet expansion: project negotiation list. https://www.gov.uk/government/publications/hynet-track-1-expansion-selected-projects/hynet-expansion-project-negotiation-list. ↑
- [327] Whitehead, A. (2025) Independent Review of Greenhouse Gas Removals. https://www.gov.uk/government/publications/greenhouse-gas-removals-ggrs-independent-review. ↑
- [328] British Standards Institute (2025) BSI Flex 2007: v1.0:2025-07. Direct air carbon capture and storage (DACCS). Quantification of greenhouse gas (GHG) emissions and removals. Specification. https://knowledge.bsigroup.com/products/direct-air-carbon-capture-and-storage-daccs-quantification-of-greenhouse-gas-ghg-emissions-and-removals-specification. ↑
- [329] British Standards Institute (2025) BSI Flex 2006: v1.0:2025-07. Bioenergy with carbon capture and storage (BECCS). Quantification of greenhouse gas emissions (GHG) and removals. Specification. https://knowledge.bsigroup.com/products/bioenergy-with-carbon-capture-and-storage-beccs-quantification-of-greenhouse-gas-emissions-ghg-and-removals-specification. ↑
- [330] Department for Energy Security and Net Zero (2025) Common biomass sustainability framework: consultation document. https://www.gov.uk/government/consultations/common-biomass-sustainability-framework/common-biomass-sustainability-framework-consultation-document-accessible-webpage. ↑
- [331] Department for Energy Security and Net Zero (2025) Energising Britain: Your voice in our Clean Energy Superpower Mission. https://www.gov.uk/government/publications/energising-britain-your-voice-in-our-clean-energy-superpower-mission. ↑
- [332] Great British Energy and Department for Energy Security and Net Zero (2026) Local Power Plan. https://www.gov.uk/government/publications/local-power-plan. ↑
- [333] House of Commons (2025) State of Climate and Nature. https://commonsbusiness.parliament.uk/Document/96618/Pdf?subType=Standard. ↑
- [334] Great British Energy and Department for Energy Security and Net Zero (2026) Local Power Plan. https://www.gov.uk/government/publications/local-power-plan. ↑
- [335] Department for Energy Security and Net Zero (2025) Energising Britain: Your voice in our Clean Energy Superpower Mission. https://www.gov.uk/government/publications/energising-britain-your-voice-in-our-clean-energy-superpower-mission. ↑
- [336] Department for Energy Security and Net Zero (2026) Warm Homes Plan. https://www.gov.uk/government/publications/warm-homes-plan. ↑
- [337] Department for Environment, Food and Rural Affairs (2026) Land Use Framework. https://www.gov.uk/government/publications/land-use-framework. ↑
- [338] Department for Energy Security and Net Zero (2025) Clean Energy Jobs Plan. https://assets.publishing.service.gov.uk/media/68f762b324fc2bb7eed11a45/clean-energy-jobs-plan.pdf. ↑
- [339] Department for Energy Security and Net Zero (2025) Clean Energy Jobs Plan. https://assets.publishing.service.gov.uk/media/68f762b324fc2bb7eed11a45/clean-energy-jobs-plan.pdf. ↑
- [340] Department for Business and Trade (2025) Industrial Strategy. https://assets.publishing.service.gov.uk/media/69256e16367485ea116a56de/industrial_strategy_policy_paper.pdf. ↑
- [341] Skills England (2025) Guidance for developing a Local Skills Improvement Plan (LSIP). https://www.gov.uk/government/publications/local-skills-improvement-plans/guidance-for-developing-a-local-skills-improvement-plan-lsip. ↑
- [342] Skills England (2025) Guidance for developing a Local Skills Improvement Plan (LSIP). https://www.gov.uk/government/publications/local-skills-improvement-plans/guidance-for-developing-a-local-skills-improvement-plan-lsip. ↑
- [343] Department for Energy Security and Net Zero (2025) Clean Energy Jobs Plan. https://assets.publishing.service.gov.uk/media/68f762b324fc2bb7eed11a45/clean-energy-jobs-plan.pdf. ↑
- [344] Department for Energy Security and Net Zero (2025) North Sea Future Plan for fair, managed and prosperous transition. https://www.gov.uk/government/news/north-sea-future-plan-for-fair-managed-and-prosperous-transition. ↑
- [345] Institute For Public Policy Research (2025) Skills passport: an essential part of a fair transition. https://www.ippr.org/articles/skills-passports-fair-transition. ↑
- [346] Scottish Government (2025) Renewable UK and Offshore Energies UK correspondence regarding the Energy Skills Passport project: EIR release. https://www.gov.scot/publications/foi-202500476207/. ↑
- [347] The Press and Journal (2025) Fewer than 500 oil and gas workers sign up to £3.7m renewables jobs passport scheme. https://www.pressandjournal.co.uk/fp/news/aberdeen-aberdeenshire/6923653/oil-gas-workers-transition-aberdeen/. ↑
- [348] Thomas, H. (2026) Port Talbot to become offshore wind hub for Celtic Sea. BBC News. https://www.bbc.co.uk/news/articles/ckger01gxkno. ↑
- [349] Ceramics UK (2025) Ceramics sector calls for support to meet challenge of net zero. https://www.ceramics-uk.org/news/ceramics-sector-calls-for-support-to-meet-challenge-of-net-zero. ↑
- [350] Glass International (2025) British Glass International highlights challenges. https://www.glass-international.com/news/british-glass-president-highlights-challenges. ↑
- [351] Cullen, L. (2026) Climate change scrutiny body to be set up. BBC News. https://www.bbc.co.uk/news/articles/cjen2lx3nnpo. (Accessed: 6 May 2026). ↑
- [352] Climate Change Committee (2025) Letter: Advice on the Northern Ireland Just Transition Commission. https://www.theccc.org.uk/wp-content/uploads/2025/05/Letter-to-Director-of-Climate-Change-Policy-Division-2-June-2025-1.pdf. ↑
- [353] Department for Business and Trade (2026) UK Sustainability Reporting Standards: UK SRS S1 and UK SRS S2. https://www.gov.uk/government/publications/uk-sustainability-reporting-standards-uk-srs-s1-and-uk-srs-s2. ↑
- [354] Prudential Regulation Authority (2025) SS5/25 – Enhancing banks’ and insurers’ approaches to managing climate-related risks. https://www.bankofengland.co.uk/prudential-regulation/publication/2025/december/enhancing-banks-and-insurers-approaches-to-managing-climate-related-risks-ss. ↑
- [355] Net Zero Council and Transition Finance Council (2025) Sector Transition Plan Guidance. https://irp.cdn-website.com/ba38e7c3/files/uploaded/Final+Net+Zero+Council+Sector+Transition+Plan+Guidance+October+2025+.pdf. ↑
- [356] Confederation of British Industry (2026) Cutting business energy costs. https://www.cbi.org.uk/media/3idjn55v/cutting-business-energy-costs-cbi-euk.pdf. ↑
- [357] Confederation of British Industry (2026) Cutting business energy costs. https://www.cbi.org.uk/media/3idjn55v/cutting-business-energy-costs-cbi-euk.pdf. ↑
- [358] Small Business Britain, Barclays, and BT Group (2025) The Willow Review. https://willowreview.com/downloads/report/The-Willow-Review-Report-June-2025.pdf. ↑
- [359] Department for Business and Trade, Department for Energy Security and Net Zero (2025) UK government response to the Willow Review recommendations. https://www.gov.uk/government/publications/government-response-to-the-willow-review/uk-government-response-to-the-willow-review-recommendations-web-version. ↑
- [360] Department for Business and Trade and Department for Energy Security and Net Zero (2025) New funding to help small businesses cut their costs [press release]. https://www.gov.uk/government/news/new-funding-to-help-small-businesses-cut-their-costs. ↑
- [361] National Wealth Fund (2026) Unlocking the UK’s future: our Five-Year Strategic Plan to 30/31. https://www.nationalwealthfund.org.uk/media/ca1pvtjp/national-wealth-fund-five-year-strategic-plan.pdf. ↑
- [362] National Wealth Fund (2026) Unpublished. ↑
- [363] National Wealth Fund (2025) Financing growth, powering change: National Wealth Fund impact report 2025. https://www.nationalwealthfund.org.uk/media/eh4cn5pq/nwf-impact-report-oct-25-c4697ca8e4da4615acfd5700e9759cf4.pdf. ↑
- [364] The Coalition to Grow Carbon Markets (2025) Shared Principles for Growing High-Integrity Use of Carbon Credits by Companies and Other Buyers. https://coalitiontogrowcarbonmarkets.org/wp-content/uploads/2025/11/The-Coalition-to-Grow-Carbon-Markets_Shared-Principles.pdf. ↑
- [365] Department for Energy and Net Zero (2026) Voluntary carbon and nature markets: raising integrity – summary of responses. https://www.gov.uk/government/consultations/voluntary-carbon-and-nature-markets-raising-integrity/public-feedback/voluntary-carbon-and-nature-markets-raising-integrity-summary-of-responses-accessible-webpage. ↑
- [366] The CBGDP assumed that cumulative heat pump installations reach 2.5 million in 2030. A reasonable trajectory to delivering the heat pump target in the Warm Homes Plan would imply only around 1.9 million cumulative installations by 2030. However, the CBGDP deployment data only includes total cumulative heat pump deployment in five-year increments, which is not sufficient to track annual progress in new build and retrofit heat pump installations. We therefore use the Warm Homes Plan annual installation target to track deployment. ↑
- [367] These equate to savings in gross energy demand of 130 TWh and 44 TWh for oil and gas respectively, based on the reductions in oil and gas consumption from roll-out of heat pumps and EVs in our Balanced Pathway in 2030. ↑
- [368] In our Balanced Pathway we assume heating systems are only installed when a fossil fuel heating system is due to be replaced. For this analysis, we model what costs and savings would be for different households, if their heating system was due to be replaced this year. ↑
- [369] Ofgem (no date) Energy price cap and standing charges explained. https://www.ofgem.gov.uk/information-consumers/energy-advice-households/energy-price-cap-and-standing-charges-explained. (Accessed: 21 May 2026). ↑
- [370] Climate Change Committee (2025) Methodology Report – UK, Northern Ireland, Wales, and Scotland carbon budget advice. https://www.theccc.org.uk/publication/methodology-report-uk-northern-ireland-wales-and-scotland-carbon-budget-advice/. ↑
- [371] Climate Change Committee (2026) Supplementary Analysis of the Seventh Carbon Budget. https://www.theccc.org.uk/publication/supplementary-analysis-of-the-seventh-carbon-budget/. ↑
- [372] Zapmap (2026) Zapmap Price Index. https://www.zapmap.com/ev-stats/charging-price-index. (Accessed: 21 May 2026). ↑
- [373] Zapmap (2026) Zapmap Annual Charging Insights Report 2025. https://www.zapmap.com/ev-stats/ev-charging-survey. (Accessed: 21 May 2026). ↑
- [374] The household has access to an off-peak tariff for 56% of its heating demand, a peak tariff for 5% of its heating demand, and a standard tariff for 39% of its heating demand. In practice, households vary in the degree to which they can make use of time-of-use tariffs. ↑
- [375] Centre for Net Zero (2024) Decarbonising Heat: The Impact of Heat pumps and a time of use tariff on energy demand. https://www.centrefornetzero.org/papers/decarbonising-heat-the-impact-of-heat-pumps-and-a-time-of-use-heat-pump-tariff-on-energy-demand. ↑
- [376] Microgeneration Certification Scheme (no date). MCS Data Dashboard. https://mcscertified.com/low-carbon-landscapes/mcs-data-dashboard/. (Accessed 21 May 2026). ↑
- [377] As noted above, we model electricity consumption for households with a heat pump and a time-of-use tariff based on published data. For households with solar panels, a heat pump, and a time-of-use tariff, we assume the same electricity consumption profile, due to limited data. We assume solar generation varies seasonally and consider the average monthly daylight hours. We assume energy generated from solar is first used for home energy, and any remaining generated energy is exported. We do not take account of differences in solar generation across daylight hours each day. ↑
- [378] Climate Change Committee (2025) The Seventh Carbon Budget. https://www.theccc.org.uk/publication/the-seventh-carbon-budget/. ↑
- [379] Climate Change Committee (2026) Supplementary analysis of the Seventh Carbon Budget. https://www.theccc.org.uk/publication/supplementary-analysis-of-the-seventh-carbon-budget/. ↑
- [380] Energy System Catapult (2021) Electric Vehicles: What will persuade the 30% of households without off-street parking to adopt electric vehicles?. https://es.catapult.org.uk/report/on-street-parking-and-electric-vehicles/. ↑
- [381] Driving and home energy bills here include fuel costs for driving, and electricity and gas costs for home energy use. ↑
- [382] We assume the rural household does not receive the financial support for households heating their homes with oil announced in March 2026, as this was targeted towards low-income households. ↑
- [383] We model eVED as applying now. It is due to apply from 2028; by this point we would expect the upfront cost of a new electric car and equivalent petrol car to be the same. So today, many households with this profile may already see a saving over upfront and running costs. ↑
- [384] This refers to the direct gas fuel costs used by Ofgem in the calculation of the Q2 2026 price cap, which was set before the start of the Iran war. ↑