
Presented to the Secretary of State pursuant to Section 34 of the Climate Change Act 2008.
Footnotes have been removed from the HTML version of this report. For the footnoted version of this report, please download the PDF.
Acknowledgements
The Committee would like to thank:
The team that prepared this report and its analysis. This was led by Emma Pinchbeck, James Richardson, Emily Nurse, and Eoin Devane, and included Sasha Abraham, Rose Armitage, Florence Bates, Simona Battipaglia, Owen Bellamy, George Blake, Sandra Bogelein, Marili Boufounou, Marta Calore, Christian Calvillo Munoz, Rachel Carr-Whitworth, Lidice Cruz-Rodriguez, Selina Dagless, Bianca de Farias Letti, Victoria de la Cruz, Ramesh Deonarine, Joshua Deru, Tom Dooks, Caitlin Douglas, Kim Dowsett, Kieron Driscoll, Ahmed Gailani, Francesco Maria Giacomini, Ruth Gregg, Esther Harris, Cara Hawkins, Rachel Hay, Cilla Hellgren, Robbie Herring, Gemma Holmes, Daisy Jameson, Ariana Jessa, Luke Jones, Sam Karslake, Emma Kearney, Miriam Kennedy, Michael Lord, Grace Macready, Luke Maxfield, Moryse McInniss, Aaron McMahon, Richard Millar, Bea Natzler, Chloe Nemo, Chris Parker, Finna Parkinson, Emma Patterson, Lois Player, Simon Rayner, Andrew Romang, Elena Saggioro, Miranda Schroder, Viv Scott, Penny Seera, Olivia Shears, Marcus Shepheard, Bryony Sheridan, Joris Simaitis, Thomas Smith, Rachael Steller, James Tarlton, Felicity Taylor, Seán Taylor, Indra Thillainathan, Sam Van Stroud, Emma Vause, Sophie Vipond, Zelna Weich, Chloe Welsh, Eveline White, Hannah Williams, Kate Williamson, Louis Worthington, Charley Wright, Ken Wright, and Susie Wright.
Our previous Committee member, Professor Michael Davies.
Our expert advisor on the role of households and the public in the Net Zero transition, Professor Rebecca Willis.
Organisations and individuals who carried out research or chaired advisory groups to support this advice. These included AFRY, Arup, the Association for Decentralised Energy, Tim Benton (formerly Chatham House), Hannah Bloomfield (Newcastle University), the Centre for Climate Change and Social Transformation, City Science, CO₂RE, the Energy Demand Research Centre, ERM, Eunomia, Frontier Economics, the Good Food Institute, Shevaun Haviland (British Chambers of Commerce), the Industrial Decarbonisation Research and Innovation Centre, Ipsos, the John Innes Centre, Ceris Jones (National Farmers Union), the Just Transition Commission, Kamma, Lancaster University, the London School of Hygiene and Tropical Medicine, the National Farmers Union, the National Physical Laboratory, Octopus Energy, PricewaterhouseCoopers, Dave Reay (University of Edinburgh), Ricardo, Rothamsted Research, Sciencewise, the Scottish Rural College, SYSTRA, the UK Centre for Ecology and Hydrology, University College London, the University of Aberdeen, the University of East Anglia, URSUS, and WSP.
The citizens who participated in our citizens’ panel and the experts who participated in our advisory groups.
A wide range of organisations and individuals who participated in workshops, engaged with us, submitted evidence, or met with the Committee bilaterally.
Executive summary
The climate is changing. Greenhouse gas levels in the atmosphere are outside the range that our species has ever previously experienced. Heatwaves and floods have become regular fixtures instead of ‘once in a lifetime’ events for many around the world, including in the UK. Global warming has unequivocally been caused by greenhouse gas emissions, with 100% of the observed long-term temperature change attributable to human causes.
The UK’s Climate Change Act (2008) sets the framework for domestic action to address climate change mitigation and adaptation. The Act requires the Government to propose regular, legally binding milestones on the way to achieving Net Zero greenhouse gas emissions, known as carbon budgets. The Committee is required to advise the Government on the level of these. Parliament must then agree each carbon budget for it to be set into law. Investors, businesses, households, and government can then act with a shared understanding of the path as well as the end goal.
Our recommended level for the Seventh Carbon Budget, a limit on the UK’s greenhouse gas emissions over the five-year period 2038 to 2042, is 535 MtCO2e, including emissions from international aviation and shipping.
This would be an ambitious target, reflecting the importance of the task. But it is deliverable, provided action is taken rapidly. Our advice is based on the latest technological, social, and economic evidence; extensive sector modelling; engagement with stakeholders including businesses, trade unions, and farmers; and a citizens’ panel testing what would make changes accessible and affordable to households.
In many key areas, the best way forward is now clear. Electrification and low-carbon electricity supply make up the largest share of emissions reductions in our pathway, 60% by 2040. Once the market has locked into a decarbonisation solution, it needs to be delivered. The roll-out rates required for the uptake of electric vehicles (EVs), heat pumps, and renewables are similar to those previously achieved for mass-market roll-outs of mobile phones, refrigerators, and internet connections.
The private sector has a proven record of innovating and delivering rapid transitions in technologies and consumer choices, provided the right incentives are in place. As technologies such as renewable electricity and EVs become cheaper than fossil fuel-based alternatives, global markets for many of the technologies needed to decarbonise economies are growing.
Alongside markets, policy is needed to provide confidence to investors and consumers; manage risks in new markets; remove barriers to delivery; and offer financial incentives where necessary. Policy should include clear long-term signals and decisive choices to narrow options as it becomes increasingly clear which technologies markets are locking into.
The UK must also step up actions to adapt to the climate change that is already happening. The investments, infrastructure, and land use changes required to deliver the Seventh Carbon Budget must be designed to be well-adapted to current and future climate change.
We estimate that the net costs of Net Zero will be around 0.2% of UK GDP per year on average in our pathway, with investment upfront leading to net savings during the Seventh Carbon Budget period. Much of this investment is expected to come from the private sector.
Net Zero will increase economic security against fossil fuel price shocks, which have caused around half of the UK’s recessions since 1970. There are also opportunities for new jobs in areas such as heat pump installation, and growing markets such as green finance. Clean, efficient, electric technologies will mean reduced air pollution and should mean lower energy bills than continued reliance on fossil fuel technologies.
Large parts of the UK’s service-based economy will see little impact, but for some, for example in oil and gas and some parts of farming, there will be significant change. Government needs to engage with affected communities to develop proactive, funded plans to support those affected.
Targets support actions, but targets alone are not enough. This report therefore sets out our recommendations for how to hit the proposed Seventh Carbon Budget. We set out a pathway, and associated actions, and have considered economic and social factors to ensure our advice is practical.
The UK’s Balanced Pathway
The UK has committed to reach Net Zero greenhouse gas emissions by 2050, with any residual greenhouse gas emissions balanced by removals. Our advice on the level of the Seventh Carbon Budget is based on our Balanced Pathway: an emissions reduction pathway from 2025 to Net Zero by 2050 (Figure 1). Our pathway is in line with all of the UK’s legislated carbon budgets and stated Nationally Determined Contributions (NDCs). It achieves the recommended Seventh Carbon Budget via domestic action, without resorting to international credits.
Emissions in the UK in 2023 were around half the levels they were in 1990. The pace of emissions reduction has more than doubled since the introduction of carbon budgets in 2008, driven by the phase-out of coal and the ramp-up of renewable electricity generation. By the middle of the Seventh Carbon Budget, on our pathway, emissions in the UK will be only a quarter of the level they are today, and 87% lower than levels in 1990 (90% lower excluding emissions from international aviation and shipping). Achieving this will require a significant reduction in emissions across sectors including surface transport, buildings, industry, and agriculture (Figure 2).
Five routes
The Seventh Carbon Budget is delivered through: electricity, low-carbon fuels and carbon capture and storage (CCS), nature, engineered removals, and demand. Many of the solutions are available today and could be rapidly deployed, provided the right incentives are put in place. Other solutions, particularly within low-carbon fuels and engineered removals, are less certain and industry and government should continue to pursue multiple options for now.
1. Electricity
UK-based renewable energy provides the bulk of generation in a larger, future electricity system. Electricity then replaces oil and gas across most of the economy, including EVs, buildings, and much of industry. This requires twice as much electricity as today by 2040. As well as being low carbon, electric technologies are highly efficient. Ending the combustion of fossil fuels in boilers and cars leads to cleaner air in homes and neighbourhoods.
- Low-carbon supply: by 2040, our Balanced Pathway sees offshore wind grow six-fold from 15 GW of capacity in 2023 to 88 GW by 2040. Onshore wind capacity doubles to 32 GW by 2040 and solar capacity increases to 82 GW. Alongside renewables, storable forms of energy including nuclear, low-carbon dispatchable generation (either gas CCS or hydrogen), and batteries, as well as interconnection to neighbouring markets, ensure a reliable supply of electricity even in adverse weather years. These technologies need to be accompanied by rapidly expanding the transmission grid, upgrading the distribution network, and speeding up the grid connection process.
- EVs: by 2040, our Balanced Pathway sees three-quarters of cars and vans and nearly two-thirds of heavy goods vehicles (HGVs) on the road being electric, up from only 2.8% of cars and 1.4% of vans in 2023. The share of new car and van sales that are electric grows quickly, ahead of the zero-emission vehicle mandate, reaching around 95% by 2030 and 100% by 2035. This is propelled by the falling cost of batteries, which allows electric cars to reach price parity with comparable petrol and diesel cars between 2026 and 2028. Our pathway assumes battery-electric vehicles are chosen to decarbonise all HGVs.
- Heat pumps: by 2040, our Balanced Pathway sees around half of homes in the UK heated using a heat pump, compared to around 1% in 2023. This requires the annual rate of heat pump installations in existing residential properties to rise from 60,000 in 2023 to nearly 450,000 by 2030 and around 1.5 million by 2035, a rate of increase in line with that seen in other European countries such as Ireland and the Netherlands. But installation rates do not exceed natural replacement cycles; heating systems are only replaced at the end of their life. All new and replacement heating systems become low carbon after 2035 to ensure a fully decarbonised housing stock by 2050.
- Industrial electrification: by 2040, our Balanced Pathway sees electricity meet 61% of industrial energy demand, up from around 26% today. The major sources of heat in industry are replaced with electric options including electric boilers, electric ovens, electric furnaces in the glass sector, and, most significantly, electric heat pumps. Electrifying industry allows UK manufacturers to benefit from global demand for low-carbon goods.
2. Low-carbon fuels and CCS
A range of low-carbon fuels contribute to the pathway in areas that are less suited to electrification. While they are less efficient than electric technologies, these fuels play a key role in aviation and shipping as well as some roles in industry. Low-carbon fuels are produced from a range of sources, including hydrogen produced from electrolysis or by methane reformation with CCS; synthetic fuels that use carbon captured from the atmosphere combined with hydrogen to produce a low-carbon fuel with similar properties to today’s fossil fuels; and biofuels. Bioenergy supply is constrained by the availability of sustainable sources, so is reserved for areas with the highest carbon abatement potential. CCS allows continued use of fossil fuels in limited circumstances, but plays a key role in capturing process emissions, as well as contributing to electricity generation, hydrogen production, and engineered removals.
- Sustainable aviation fuel (SAF) and shipping fuels: by 2040, our Balanced Pathway sees SAF meet 17% of aviation fuel demand, providing an alternative to kerosene in planes. SAF is a mix of biofuel and domestically produced synthetic fuel. We assume that the aviation sector bears the costs of meeting Net Zero for flying and makes use of both SAF and engineered removals. By 2040, our Balanced Pathway sees ammonia meet 22% of shipping energy use and synthetic fuels meet a further 17% of shipping energy use, predominantly from synthetic methanol. These technologies are at an early stage of development and the balance between SAF, removals, and demand in aviation, and between ammonia and methanol in shipping, remains unclear.
- Hydrogen: by 2040, our Balanced Pathway sees hydrogen play a small but important role, particularly in industrial sectors such as ceramics and chemical production which may find it hard to electrify. Hydrogen also has an important role within the electricity supply sector as a source of long-term storable energy that can be dispatched when needed and as a feedstock for synthetic fuels. However, we see no role for hydrogen in buildings heating and only a very niche, if any, role in surface transport.
- CCS: by 2040, our Balanced Pathway sees CCS used in industrial subsectors with process emissions for which alternatives are unlikely to be available. This results in CCS being deployed in the chemicals and cement and lime industries. CCS is also used, alongside hydrogen, to enable long-term storable, dispatchable power in the electricity supply sector, in manufacturing low-carbon hydrogen, and to underpin engineered removals. Achieving the CCS trajectory in our industry pathway relies on the establishment of CO2 storage and rapid construction of pipelines to connect sites. While its role is limited to sectors where there are few, or no, alternatives, we cannot see a route to Net Zero that does not include CCS.
3. Nature
Nature-based measures, including planting new woodland and restoring peatlands, are integral in growing land-based carbon sequestration. They provide opportunities for farmers to diversify their income streams away from livestock farming, as do income from renewables and energy crops. Appropriately sited, sustainable UK bioenergy supply provides emissions savings in engineered removals. The net carbon benefits retained on site in vegetation and soils are counted within nature. By 2050, nature-based sequestration offsets the residual emissions from the agriculture and land use sectors.
- New woodland creation: by 2040, our Balanced Pathway sees more than 16% of the UK covered in woodland, an increase from 13% today, as new diverse woodlands deliver carbon sequestration in vegetation and soils. It is vital that tree planting rates more than double to 37,000 hectares per year, by 2030.
- Peatland restoration: by 2040, our Balanced Pathway sees the proportion of UK peatlands in natural or rewetted conditions rise from 26% in 2023 to 55%. Most of this scale-up needs to take place this decade. This measure delivers over half the land use emissions reductions by 2040.
4. Engineered removals
Removals are needed to balance residual emissions, principally from aviation. By 2040, both bioenergy with CCS and direct air capture are deployed. There are also small amounts of removals from enhanced weathering and biochar. Delivering removals will require CO2 transport and storage infrastructure to be developed in good time, alongside finalising business models and setting out a common sustainability framework for biomass.
5. Demand
The deployment of low-carbon technologies needs to be done in parallel with a shift away from high-carbon goods and services. This is particularly true where no major lower-carbon technology exists or where these shifts are required to reduce emissions in the near term due to technologies taking longer to develop. Our assumptions here are informed by evidence on what is deliverable, as well as by the views of our citizens’ panel on what needs to be done to make changes accessible and affordable. Key areas include:
- Increased efficiency: by 2040, our Balanced Pathway sees cost effective resource and/or energy efficiency measures deployed across most sectors. This includes home insulation, more efficient use of resources in industry, reductions in commercial, household, and food waste, and more efficient technologies in aviation and shipping.
- Low-carbon choices: by 2040, our Balanced Pathway sees people make some shifts towards lower-carbon choices. Better infrastructure enables more people to choose public transport, cycling, or walking, instead of driving, bringing the UK closer in line with countries such as Germany, Switzerland, and the Netherlands. A continuation of existing trends, together with greater choice and availability of plant-based foods, sees a reduction in meat (especially beef and lamb) and dairy consumption, within overall healthier diets. With the aviation sector bearing the costs of meeting Net Zero for flying, demand growth is lower than in the baseline of no further decarbonisation action.
The path to Net Zero has become clearer in many areas. However, substantial uncertainty inevitably remains around aspects of a pathway modelled over a 25-year time horizon. We have undertaken an assessment allowing us to identify key sources of uncertainty, understand their potential impact, and consider options to address deviations from the pathway. The largest uncertainty impact in 2040 comes from the sum of uncertainties around costs.
Development of contingency options by government would ensure a robust and adaptive approach to achieving Net Zero. For the Seventh Carbon Budget, the most important contingencies we have identified are accelerated roll-out of EVs and heat pumps, including scrappage schemes. Early scrappage in these areas is not included in the Balanced Pathway but could provide an option to go faster or to catch up if emissions reductions fall off track.
The cost of the transition
In our Balanced Pathway, the UK should start saving compared to a high-carbon economy during the Seventh Carbon Budget period. An initial investment is required for the UK’s transition to a low-carbon economy. This upfront investment will lead to significant savings in the future as inefficient fossil fuel technologies are replaced by more efficient, low-carbon alternatives.
- Renewable energy and electric technologies are more energy efficient than their fossil fuel alternatives, meaning less wasted energy throughout the system. Energy losses are reduced from around 1,000 TWh today to around 500 TWh in 2050.
- We estimate that a low-carbon electricity supply system will be cheaper per unit of electricity than the high-carbon alternative. Investment is needed now to both decarbonise and expand the system.
- EVs will lead to a significant cost saving. Electric cars and vans are already generally cheaper to run and maintain, and will soon be cheaper to buy, than their fossil fuel-based alternatives. Households will see a significant reduction in the cost of driving.
- Heat pumps are around three-to-four times more efficient than gas boilers, which should lead to lower household energy bills, provided policy costs are removed from electricity bills. However, UK homes are predominantly designed around gas heating and will need a one-off improvement to be suitable for heat pumps in many cases. This is a sizeable element of the total cost of Net Zero, and households will need policy support with these one-off costs.
Our costing estimates are lower than those from our Sixth Carbon Budget advice. This reflects different time periods, with costs and benefits between 2020 and 2024 now in the past, and updates to our underlying assumptions and methodology to align with the latest evidence. Updates have influenced our cost profile, both upwards and downwards.
Households
Household low-carbon choices contribute to one-third of emissions reduction in 2040. From an emissions perspective, the most impactful decisions most households will make are purchasing an electric car and a heat pump. Choices such as meat and dairy consumption and flying make smaller, but important contributions.
To understand what would make these kinds of choices accessible and affordable for households, we convened a citizens’ panel. The citizens were on board with the key choices households will need to make, provided the right policies are put in place.
- Different policies were acceptable for choices seen as ‘necessities’ as opposed to ‘luxuries’. For heating and driving, public spending to support households was viewed as more acceptable than increases in price (such as fuel prices). For flying, which was seen as more optional, an increase in ticket prices was seen as more acceptable.
- The panel wanted government support for upfront costs and trustworthy public information to explain what is needed and to address misconceptions.
- People wanted to protect those with limited choice and/or on a low income, but also generally accepted the idea that higher-income households may make bigger savings by switching to low-carbon technologies first. Policies which penalise those that cannot afford to switch were seen as unacceptable. People were also concerned about protecting farmers’ livelihoods.
We used our Net Zero Distributional Model to assess the impact of our buildings and transport pathways on costs for households and the Exchequer, under illustrative policy packages. Alongside this, we undertook a more qualitative analysis of the potential impacts on protected and vulnerable groups and an assessment of non-monetary costs and benefits, such as health impacts.
- For most types of household, savings on driving will support household budgets and be similar in magnitude to any additional costs from home energy over the period from 2025 to 2050 as a whole. However, policy support will be needed to ensure low-carbon technologies are accessible and affordable, especially for lower-income households, and to ensure that those who make the transition gain by doing so.
- The transition can benefit people who are disadvantaged by reducing fuel poverty, improving air quality in disadvantaged areas, and improving workforce diversity in growing sectors. Net Zero policies should be accessible, with targeted outreach and support for home heating measures and improved accessibility of public transport and active travel.
- We expect the transition to Net Zero to deliver improved health outcomes, through improved air quality, better insulated homes, increased active travel, and healthier diets. There will be some costs of time lost for home retrofit and on public transport.
The economy
The transition will make the UK economy more resilient, by reducing dependence on volatile international fossil fuel markets. Beyond this, most businesses will not be significantly affected by Net Zero in the long term, particularly those in the UK’s service sectors.
- The UK’s energy will be predominantly home grown, reducing our reliance on imported fossil fuels. This will shield households and businesses from damaging price shocks. In the Balanced Pathway, total net energy imports fall from 867 TWh in 2025 to 202 TWh in 2050.
- The costs of key low-carbon technologies, such as EVs, renewables, and batteries have fallen substantially over the period of the first three carbon budgets, as past investment has led to learning-by-doing benefits. The UK and other countries can start to reap these benefits in the years ahead, as well as helping to drive other, more nascent technologies down the cost curve. Continued improvements in technologies to produce electricity and power vehicles will lower costs over time, increasing productivity. Investments into renewables, batteries, and electrification technologies are now greater than fossil fuel investment internationally, adding momentum to these changes.
- Some traded sectors where the UK has strengths could grow, such as green finance, while new industries could develop. Seizing these benefits will require rapid action and an environment conducive to investment, as other countries will also be looking to capture opportunities.
- Some industrial sectors, such as cement, will face extra costs to eliminate emissions. Government should support these sectors to transition, which might include carbon border adjustment mechanisms. With the right policies in place, UK manufacturers could decarbonise early and take advantage of growing global demand for low-carbon goods, rather than being stranded in shrinking markets for high-carbon goods and services. Economic growth will not come from trying to sell goods other countries no longer want to buy.
- Output of oil and gas and associated industries such as refineries will reduce, with impacts concentrated in a few regions and communities. Government needs to develop funded transition plans, working with those affected, to enable access to secure alternative employment and business opportunities.
- Farmers will need to be supported to diversify their income streams away from livestock agriculture, with opportunities in areas such as woodland creation, peatland restoration, energy crops, and renewable energy.
Key actions
We have 43 priority recommendations to put the country on track to deliver the Seventh Carbon Budget. The full set can be found in Annex 1. There are seven core themes that underpin most of these recommendations:
- Making electricity cheaper. The largest share of emissions reduction in our pathway comes from switching to low-carbon electric technologies across sectors including transport, buildings, and industry. Households and businesses need to be better incentivised to make these choices through the impacts they will see on their bills. This can be done through rebalancing prices to remove policy levies from electricity bills.
- Removing barriers. People need to be able to install heat pumps and EV charge points in their homes and businesses. Industries require timely grid connections to allow them to move to electrified production processes. Grid infrastructure is essential to enable everyone to make use of domestically produced low-carbon electricity, reduce energy bills, and improve our energy security. Key processes and rules, including in planning, consenting, and regulatory funding, need to enable rapid deployment of low-carbon technologies.
- Providing certainty. In many key areas, the best way forward to decarbonise is now clear. Once the market has locked into a solution, it needs to be delivered. Government should support markets to do this by setting out clear, timely decisions on support for new technology choices, and dates for phasing out old technology. Certainty will provide confidence to consumers and investors. This should include confirming that there will be no role for hydrogen in home heating.
- Supporting households to install low-carbon heating. While the Net Zero transition should lead to lower energy bills for consumers, support is needed to address barriers in upfront costs, especially for low-income households. Addressing barriers such as the price of electricity, lack of awareness, and misconceptions about heat pumps will also be crucial.
- Setting out how government will support businesses. Businesses need clarity on the balance between government support and market mechanisms such as the UK Emissions Trading Scheme and carbon border adjustment mechanisms, so that they can make the transition to low-carbon operations. With the right support, UK businesses could decarbonise early and take advantage of growing global demand for low-carbon goods and services. Farmers and land managers need support to diversify land use into woodland creation, peatland restoration, energy crops, and renewable energy.
- Enabling the growth of skilled workforces and supporting workers in the transition. Growing workforces will be a critical enabler of some of the system-wide changes that are needed (for example, switching from gas to electric heating or expanding the electricity grid). We need a plan for how to do this. A small number of industries will change substantially, which could adversely impact communities if not managed well. Government, business, workers, and communities should proactively plan for how to address this and ensure that new opportunities are available in affected areas.
- Implementing an engagement strategy. Government should provide clear information to households and businesses. It should focus on what actions are most impactful in reducing emissions, the benefits of low-carbon choices, and providing trusted information.
Next steps
This report sets out our recommendation for the level of the Seventh Carbon Budget. We also set out our Balanced Pathway for how to achieve it, so that the Government and Parliament can be assured that the recommended level is feasible and deliverable. This is based on extensive sector modelling and data analysis, but also on insights from a wide range of stakeholders, including businesses, trade unions, and farmers, and from our citizens’ panel. The Committee is very grateful for all the support we have received in the process.
It is now for the Government to propose a level for the Seventh Carbon Budget to Parliament, and for Parliament to approve or reject that level. This must take place by 30 June 2026. The Government must also bring forward its proposals and policies to enable the carbon budgets set under the Climate Change Act to be met. The Committee supports the suggestion made by the previous Government that these proposals and policies should be published ahead of the vote on the level of the carbon budget. Alongside this, action needs to accelerate to meet existing targets.
Setting carbon budgets 12 years in the future provides certainty to investors, businesses, and households, allowing the time for technologies to be adopted and businesses and households to adjust. The Committee is required to advise Parliament every year on progress, allowing Parliament to hold the Government to account. Our next mitigation Progress Report is scheduled for June 2025.
The UK’s approach has influenced climate legislation around the world. Nearly 60 countries now have their own climate legislation. There are 25 independent advisory climate councils working to support national governments on delivering their climate commitments.
The mechanisms in the Climate Change Act provide an institutional framework for long-term decision-making and a counterbalance to short-term political pressures. The Committee provides advice, but we do not set policy. Decisions remain with the Government and Parliament.
Above all, to meet our Seventh Carbon Budget pathway, what is needed is action, continuing the momentum built up since the introduction of the Climate Change Act. Action by businesses, governments, and households can drive a rapid shift away from fossil fuels, boost investment, support good new jobs, and enhance the UK’s energy security.
Chapter 1: Climate change and emissions
Introduction and key messages
This chapter sets out the background to our Seventh Carbon Budget advice, summarising the latest scientific understanding of climate change, global emissions, and progress in reducing emissions in the UK.
Our key messages are:
- The Earth’s climate is changing rapidly as human-induced warming is increasing at an unprecedented rate. Risks are increasing – extreme weather events show the impact that climate change is already having, both globally and in the UK. Every 0.1°C of additional warming creates increasing threats from climate change.
- The science is clear that human activities have driven increases in greenhouse gases (GHGs) in the atmosphere to levels not previously experienced by our species. Long-term human-induced warming now reaches around 1.3ºC above pre-industrial levels and is rising at over 0.2ºC per decade.
- Net Zero CO2 emissions as well as deep reductions in other GHG emissions globally are required to halt further global warming. While it is now almost inevitable that warming levels will exceed 1.5ºC in the next ten years, it may still be possible to limit warming to 1.5ºC in the longer term, provided deep global emissions cuts begin immediately.
- Global action must speed up. The UN Framework Convention on Climate Change (UNFCCC) process, the Paris Agreement, government policies, action from non-state actors, and market initiatives are driving progress. Global GHG emissions are likely near their peak, and on a per-capita basis have begun to fall. But much more action is needed.
- All three of the UK’s carbon budgets have so far been achieved, with GHG emissions having roughly halved since 1990, driven largely by progress from expanding renewable power and phasing out coal in the electricity sector. Progress needs to extend to a broader range of sectors, alongside building resilience and supporting global decarbonisation.
- The UK has a legally binding target to reach Net Zero GHG emissions by 2050, requiring sources of GHG emissions to be balanced by sinks. Warming is primarily determined by cumulative CO2 emissions. Rapid action is crucial, and delays could have detrimental consequences such as stranded assets and rising costs. The other chapters of this report cover what the UK will need to do to achieve this target, which will involve urgent action this decade, as some areas of the economy will take a long time to fully decarbonise.
1.1 Climate change and emissions globally
1.1.1 Global climate change
Global temperatures are rising (Figure 1.1). Since we published our Sixth Carbon Budget advice in 2020, climate and weather records have continued to be broken around the world.
- Global temperatures have continued to increase. 2024 was the warmest year on record, at 1.6ºC above pre-industrial average levels.[1] Long-term human-induced global warming in 2023 is estimated to have risen to 1.3ºC (1.1 to 1.7ºC 5th to 95th percentile range) above pre-industrial average levels.[2] The rate of increase is unprecedented, reaching 0.26°C per decade over 2014 to 2023.[3];[4]
- Records for climate and weather extremes continue to be broken. In 2023, ocean heat content reached its highest level in the 65-year observational record and global mean sea level reached a record high. Extreme weather events, such as wildfires and flooding, led to widespread loss of life and property destruction.[5]
- Warming will inevitably continue in the near term. Global temperatures will continue to rise until the point when the world reaches Net Zero CO2 emissions, with deep reductions in other GHGs also needed to limit warming.[6] This continued warming means that the world is rapidly approaching the lower end of the Paris Agreement long-term temperature goal (Box 1.1).
| Figure 1.1 Global average temperature rise |
 Description: Since 1850, global average temperatures have been increasing, with a particular acceleration beginning around 1970. Observed annual temperatures fluctuate around long-term human-induced warming. |
| Box 1.1 Global warming of 1.5ºC |
| Long-term warming
The 2015 Paris Agreement has a single long-term temperature goal: ‘holding the increase in the global average temperature to well below 2°C above pre-industrial levels and pursuing efforts to limit the temperature increase to 1.5°C above pre-industrial levels’. While not formally defined in the Agreement itself, the warming levels referenced in this goal are widely interpreted as referring to multi-decadal human-induced average warming, excluding short-term natural variability.[7] For simplicity, this is often referred to as ‘long-term warming’. Since 2015, advancing climate science has further highlighted risks of exceeding 1.5ºC of long-term warming. The UNFCCC Conference of the Parties (COP) has recognised these risks and put a greater focus on pursuing efforts to keep to 1.5°C above pre-industrial levels – such as in the agreed conclusions on the first Global Stocktake under the Paris Agreement which concluded in 2023. Long-term global warming, as measured according to this interpretation, has not yet exceeded 1.5ºC above pre-industrial levels, but it is rapidly approaching it. Estimates of current human-induced long-term warming are around 1.31ºC above pre-industrial levels and are rising at 0.26ºC per decade.[8] Short-term variability The Earth’s temperature also experiences short-term fluctuations on both annual and monthly timescales which can temporarily increase or lower global temperatures from the human-induced long-term average. A major contributor to this is the El Niño cycle – which occurs in the Pacific but has a large impact on global temperature. The large and persistent El Niño occurring over late 2023 and 2024 was one of the reasons that global average temperature anomalies have repeatedly, but temporarily, reached 1.5ºC or higher above pre-industrial levels. February 2023 to January 2024 was the first 12-month period where the mean global average temperature exceeded 1.5ºC above pre-industrial levels, and June 2024 marked the twelfth consecutive month to reach or surpass 1.5ºC warming.[9] 2024 was the warmest calendar year on record, surpassing 1.5ºC warming for the first time.[10] This does not mean that the long-term temperature goal of the Paris Agreement has been breached; limiting long-term warming to 1.5ºC remains a central goal in the UNFCCC process. Looking ahead While it is theoretically possible to return long-term warming to below 1.5ºC following a limited overshoot, every increment of global warming brings additional risks, both in terms of climate impacts and to the chances of bringing warming back down over time.[11]
|
1.1.2 Global emissions
There is a near-linear relationship between cumulative anthropogenic CO2 emissions and the global warming they cause. Continued emissions of CO2 and other long-lived GHGs therefore imply continued warming.[18]
Global GHG emissions grew steeply throughout the second half of the 20th century and have continued to grow over recent years, albeit at a slowing rate.
- Annual net global CO2 emissions from fossil fuels and land use, land use change, and forestry (‘land use’) in 2023 were around 41 GtCO2.[19] This makes 2023 emissions approximately joint highest in the modern record, with 2019.
- Global emissions fell in 2020 as a result of restrictions put in place in response to the COVID-19 pandemic, but emissions have since rebounded. Preliminary estimates for 2024 suggest that CO2 emissions from fossil fuels grew 0.8% in 2024, reaching 2.6% above 2019 levels. CO2 emissions from land use have more short-term variability due to weather conditions but appear to be on a long-term downward trajectory.[20]
- Global emissions of methane contributed around one-third of the total GHG-driven global warming seen by 2010 to 2019.[21] Recent estimates show methane emissions continue to rise, implying a growing contribution to warming, and in 2023 were 2–4% above 2019 levels.[22];[23]
- The rate of increase has slowed over the past decade. The rate of growth in global fossil CO2 emissions peaked at nearly 3% per year during the 2000s but has slowed in the last decade to less than 1% per year on average.[24]
- As of 2022, 36 countries have sustained emissions reductions for longer than 10 years. Among the largest emitters, compared to 2010 levels, emissions were approximately 30% higher in China, 9% lower in the United States, 54% higher in India and 18% lower in the European Union.[25];[26]
- Global GHG emissions per capita (excluding emissions from land use, for which uncertainty is larger) broadly plateaued in the 2010s and in 2023 were 1% below peak levels, which occurred in 2012.[27];[28]
- Various sources expect global emissions to peak this decade.
- The International Energy Agency and Bloomberg New Energy Finance both project an immediate or mid-2020s peak for energy sector CO2 emissions under current policy settings.[29];[30]
- The UNFCCC assesses that if countries implement their 2030 emissions targets in full, global GHG emissions will peak in the 2020s.[31]
1.1.3 Latest scientific understanding
The Intergovernmental Panel on Climate Change (IPCC) completed its Sixth Assessment Report (AR6) cycle in 2023. This brings together the last five years of scientific studies and provides the scientific basis for this report. It concluded that human activities have ‘unequivocally caused global warming’, and that limiting human-induced global warming to 1.5ºC requires deep, rapid, and sustained reductions in GHG emissions.
- Global temperatures are increasing as a result of human activities. The increase in average global surface temperatures has been driven by increases in GHG concentrations, which have unequivocally been caused by GHG emissions from fossil fuels and other human activities.
- Human-caused climate change is already affecting weather extremes across the globe. Evidence has strengthened linking human influence to observed changes in extremes such as heatwaves, heavy rainfall, droughts, and tropical storms. Human influence has also likely increased the chance of these events occurring simultaneously. Vulnerable communities are disproportionately affected by these extreme events.
- Risks increase as warming increases. Changes in extreme climate events become larger with every additional increment of warming. Concurrent extreme weather and sea level events are projected to become more frequent, storms to become more intense, and arid conditions to become more widespread. Abrupt and irreversible changes, including those triggered when tipping points are reached, become more likely and more impactful with further warming. For any given level of warming, many climate-related risks are assessed to be higher than in the IPCC’s previous assessments.
- Limiting human-caused warming requires deep and immediate emissions cuts. Modelled IPCC pathways that limit warming to 1.5°C (with low or no overshoot) reach global Net Zero CO2 in the early 2050s. These pathways see global GHG emissions peak by 2025 and assume deep and immediate cuts in emissions are made across most sectors this decade.
- Net Zero refers to a state in which GHG emissions entering the atmosphere are balanced by removals out of the atmosphere. Reaching Net Zero CO2 emissions globally is necessary for limiting global warming to any level. In most modelled scenarios, Net Zero global GHG emissions is associated with net negative global CO2 emissions (needed to balance residual non-CO2 emissions) and falling temperatures.[32]
- Limiting warming requires both limiting cumulative CO2 emissions and strong reductions in other GHGs. The IPCC has high confidence that the level of emissions reduction by 2030 will be key to determining whether warming can be limited to 1.5°C or 2°C.
- Global warming will continue to increase in the near term, as cumulative CO2 emissions continue to rise in all of the IPCC’s modelled scenarios. Even under the IPCC’s very low emissions scenario, global warming is more likely than not to reach 1.5°C before 2040.
- Rapid action on mitigation and adaptation can reduce projected losses and damage. Actions this decade are crucial to reducing emissions quickly and adapting to the changing climate, since there are often long implementation times. Delaying action could also have other detrimental consequences, including risking lock-in to high-emissions infrastructure, stranded assets, and rising costs for people and businesses.
- The IPCC reports a 10–23% climate change-caused decline in annual global GDP by 2100 under a high warming scenario, though statistical approaches point towards the upper end of this range.[33];[34] Recent actuarial assessments emphasise the risk that losses could be considerably higher than currently considered in decision-making.[35];[36]
- Integrated responses that address both mitigation and adaptation objectives can take advantage of synergies and reduce trade-offs.
- Feasible and low-cost mitigation and adaptation options are already available. Systemic changes are needed to address the above risks, including roll-out of low-carbon technologies, reducing demand for high-carbon activities, and protecting and restoring ecosystems. Feasible, effective, and low-cost solutions to achieve these goals already exist and, in many cases, are ready to deploy at scale. The global economic benefit of limiting warming to below 2ºC exceeds the cost, even before considering co-impacts (such as effects on human health) and climate damages.
1.1.4 Global agreements on climate change
The UNFCCC process
The UNFCCC is the UN process for negotiating a global approach to address climate change. 197 countries plus the European Union are currently party to this process. Negotiations take place through the annual Conference of the Parties (COP). COP21 in 2015 negotiated the Paris Agreement, which is the latest global agreement on climate change mitigation.
- The Paris Agreement: this set several goals and objectives extending across mitigation, adaptation, and finance, and including:
- A long-term temperature goal of limiting global warming to ‘well below 2ºC above pre-industrial levels’ and to ‘pursue efforts to’ limit warming to 1.5ºC above pre-industrial levels.
- On mitigation, setting three high-level milestones for global GHG emissions: global peaking as soon as possible, rapid reductions thereafter, and achieving a balance between emissions sources and sinks in the second half of this century (Net Zero GHGs).
- On adaptation, establishing a ‘global goal for adaptation’, with a view to enhancing adaptive capacity, strengthening resilience, and reducing vulnerability to climate change. This was further developed through the UAE Framework for Global Climate Resilience into a set of sectoral and process targets that was agreed at COP28.
- On finance, setting out the need to make finance flows consistent with these mitigation and adaptation objectives.
- COP26: in 2021, COP26 took place in Glasgow with the UK as host and president of the negotiations. Participating nations agreed the Glasgow Climate Pact, which built on the Paris Agreement by calling on signatories to strengthen commitments to keep 1.5ºC in reach, finalising many of the rules underpinning the Agreement’s operation and promoting an unprecedented mobilisation of non-state actors (which has continued and grown in the years since).
- Nationally Determined Contributions: under the Paris Agreement, countries are required to submit Nationally Determined Contributions (NDCs). NDCs should set out ambitious targets and plans to reduce emissions in line with the aims of the Agreement.
- The UK set its first NDC to require a reduction in GHG emissions (excluding emissions from international aviation and shipping) of at least 68% by 2030, compared to 1990 levels.
- In November 2024, the Prime Minister announced that the UK’s second NDC would require an at least 81% reduction in GHG emissions by 2035, compared to 1990 levels. Both NDCs have been set in line with the Committee’s advice.
- The Global Stocktake: the Paris Agreement established a five-yearly Global Stocktake to assess progress towards achieving its objectives. The first Global Stocktake concluded at COP28 in 2023 and highlighted significant gaps between current action and that needed to achieve the Agreement’s goals, notably (in the context of this advice) on mitigation.
- Reacting to the latest scientific evidence and political momentum built at COP26 and since, the Global Stocktake placed particular emphasis on the importance of 1.5ºC, underscoring that climate impacts would be much less severe than at 2ºC, and noting the gap between existing commitments and a 1.5ºC-consistent trajectory.
- The Global Stocktake set out several global objectives, including:
- A tripling of global renewable energy capacity and a doubling of the global average annual rate of energy efficiency improvements by 2030.
- Accelerating the phase-down of unabated coal power and transitioning away from fossil fuels, with particular focus on accelerated action this decade.
- Accelerating reductions in non-CO2 GHG emissions, including in particular methane by 2030.
- Accelerating deployment of low- and zero-emission technologies including zero-emission vehicles, renewables, nuclear, removals, and carbon capture technologies.
- Phasing out inefficient fossil fuel subsidies.
- COP29: in 2024, COP29 took place in Baku, Azerbaijan and produced important agreements on a new climate finance goal and carbon markets.
- A new climate finance goal was agreed, with developed countries committing to take the lead in providing $300 billion per year to developing countries by 2035 as part of wider efforts to mobilise $1.3 trillion per year by 2035 from all public and private sources.
- Rules were agreed to operationalise carbon market provisions under the Paris Agreement, paving the way for trading to begin in the coming years.
Global ambition and delivery
National Net Zero targets and ambitions now cover approximately 90% of present global GHG emissions. Many of these targets are assessed as lacking detail and credibility, with short-term ambitions out of step with long-term goals.[37]
These targets are increasingly accompanied by policy packages designed to incentivise take-up of low-carbon technologies and boost domestic energy security and low-carbon competitiveness, albeit still falling short of alignment with NDC targets. Major low-carbon transition programmes (often with a notable electrification focus) are underway in the world’s largest economies.
- In China (which accounts for around a quarter of global GHG emissions), emissions reached an all-time high in 2023, but rapid deployment of renewables and electric vehicles have led independent analysts to suggest the country could be at or near peak emissions.[38];[39] Its 2030 target for wind and solar capacity has been reached six years ahead of schedule, while the total of electric and hybrid vehicles surpassed 50% of monthly new car sales in mid-2024.[40];[41]
- In the United States (which accounts for around 10% of global GHG emissions), legislation including the Inflation Reduction Act has begun to have a material impact on clean energy sectors, notably through clean electricity, vehicle, and manufacturing tax credits.[42] Clean energy and transportation investment has grown strongly in recent years.[43]
- The European Union (which accounts for slightly over 5% of global GHG emissions) adopted key policy packages in 2023 in the form of the ‘Fit for 55’ programme and RePowerEU plan. These were followed by a strengthening of the EU Emissions Trading System and updated Energy Efficiency and Renewable Energy Directives (aiming for renewables to achieve a 45% share of final energy consumption). These measures must in turn be implemented at the Member State level.[44];[45]
Progress is being driven by improving economics of low-carbon technologies interacting with policy support. The global average cost for new electricity generation has fallen by 88% for solar PV, 60% for wind, and nearly 90% for battery storage since 2010.[46] Globally, the world now invests almost twice as much in clean energy as it does in fossil fuels, with clean energy investment expected to reach $2 trillion in 2024.[47]
Globally, however, efforts remain significantly off track to achieve the Paris Agreement temperature goal (Figure 1.2).[48]
- The latest assessments found that the remaining global carbon budget to retain a 50% chance of limiting global warming to 1.5ºC has fallen from 500 GtCO2 at the time of our advice on the Sixth Carbon Budget (2020) to 235 GtCO2 from the start of 2025.[49];[50]
- Global GHG emissions implied by NDCs are consistent with warming of around 2.5ºC by 2100 and would need to be 19–22 GtCO2e lower in 2030 than those implied by current NDCs to align with a 1.5ºC scenario. Current policies in turn fall short of what would be needed to deliver NDCs, implying warming of around 3ºC by 2100 and indicating an implementation gap on top of the ambition gap.[51];[52]
- Nonetheless, significant progress has been made in recent years. When major emitters’ Net Zero pledges are considered alongside NDCs, latest commitments imply warming below 2ºC if implemented in full (which countries are not currently on track to do), compared to the 3–4ºC projected before the Paris Agreement was adopted.[53]
| Figure 1.2 Global GHG emissions under current ambition, compared to Paris-aligned trajectories |
 Description: Current policies and commitments imply flat or falling future global emissions, above scenarios consistent with limiting warming to 1.5ºC or well below 2ºC. |
1.2 Climate change and emissions in the UK
1.2.1 Climate change in the UK
Evidence of climate change is clear here in the UK – the changes that are being seen are consistent with what would be expected due to human-induced global climate change.[54]
- Average temperatures are increasing. The UK is warming at a rate similar to global land temperatures. 2023 was the second warmest year on record for the UK, with only 2022 being warmer. The UK’s 10 warmest years on record have all been in the 21st century.[55]
- Temperature extremes are changing faster than average temperatures. 2022 included the hottest day on record, the first time temperatures somewhere in the UK have exceeded 40°C. Averaged across the UK, the typical warmest temperature of the year has increased by around 2.8°C from the 1960s, 1970s, and 1980s to the most recent decade, with much more rapid rates of increase in South East England.[56];[57]
- Sea levels are rising. The rate of UK sea-level rise is increasing. The annual increase has risen to 2.4 mm/year, which is above the long-term average of 1.5 mm/year since the 1900s.[58]
- Other weather extremes are also changing. Heavy rainfall metrics generally show an increase in very wet days across the UK, but the expected signal from climate change remains hard to distinguish from the large interannual variability in the observational record. The 18 months to March 2024 was the wettest 18-month period on record in England.
These changes are leading to damaging impacts on people, ecosystems, and infrastructure for which the UK is insufficiently prepared. This is emphasised by impacts of extreme weather in the UK over the last five years – most clearly in the summer 2022 heatwave.[59]
- Health and economy: the July 2022 heatwave, and the subsequent heatwaves in August 2022, led to a record number of additional heat-related deaths with over 3,000 reported. These occurred mostly among the elderly and those with existing ill-health. Heat exposure is estimated to cost the UK economy £260–£300 million per year.[60]
- Infrastructure and communities: infrastructure impacts from the July 2022 heatwave were extensive, with flights suspended and disruption to rail and road networks. The heatwave caused power cuts due to conductors sagging and transformers overheating. Increased electricity demand presented challenges for system security and operability. There were large spikes in 999 calls and fire services declared major incidents due to multiple wildfires.
- Agriculture and ecosystems: the wettest 18-month period on record (from October 2022 to March 2024) resulted in thousands of acres of farmland being submerged for extended periods, leading to the loss of crops and animals. This followed a period of significant drought in 2022, where the combination of the lack of rainfall with the summer heat meant soils were very dry. This stressed ecosystems and agriculture and led to record numbers of large wildfires.[61]
We expect these observed trends in UK weather to continue. As detailed in the Third UK Climate Change Risk Assessment, we can expect warmer and wetter winters, drier and hotter summers, and continued sea level rise over the coming decades.[62] The evidence base for the next UK Climate Change Risk Assessment – which the Committee will publish in 2026 – will provide an updated assessment of both the risks and adaptation actions that will be needed to prepare the UK for the expected effects of climate change.
1.2.2 The UK contribution to global emissions
UK GHG emissions were 423.3 MtCO2e in 2023, including the UK’s share of international aviation and shipping, based on provisional data. This is 49.5% lower than in 1990. UK emissions excluding those from international aviation and shipping have now fallen by over half.
The UK’s share of global emissions has fallen from 2.3% to below 1% over this period.
- Despite these reductions, the UK’s emissions are still important. Over a quarter of global emissions are produced by countries with a share of global emissions less than 1%.[63]
- UK cumulative CO2 emissions since 1750 are estimated to be around 79 GtCO2.[64] This represents around 4.4% of estimated global emissions to date.
1.2.3 The Climate Change Act and UK carbon budgets
The Climate Change Act
The Climate Change Act (2008) is the UK’s legal framework for tackling and responding to climate change. The Act sets in law a long-term goal of reaching Net Zero UK GHG emissions by 2050 as well as intermediate steps defined by the level of carbon budgets, which set legally binding caps on UK GHG emissions over five-year periods. These make clear the required level of emissions reduction in the short and medium term to ensure the UK is on track to decarbonise by 2050.
Under the Act, the Committee is required to advise the UK Government on the level of each carbon budget. The Government must set in law the level of each carbon budget no later than 30 June in the twelfth year before the beginning of the period in question. This is done after first considering the Committee’s advice and any representations made by the Scottish and Welsh Governments and the Northern Ireland Executive.
- The Committee has previously advised on the levels of the first six carbon budgets, and the Government has chosen to follow this advice in each instance.[65];[66];[67];[68];[69];[70];[71];[72]
- Prior to setting it in law, the UK Government’s proposed level of each carbon budget is laid before and agreed by Parliament. The Sixth Carbon Budget was supported across political parties in the House of Commons. The Committee’s detailed reports on Net Zero and the Sixth Carbon Budget were available to aid their scrutiny.
- The UK Government must prepare the policies and proposals required to achieve the target.
This report provides the Committee’s advice on the level of the Seventh Carbon Budget, covering the period from 2038 to 2042. Scotland, Wales, and Northern Ireland all have their own legal frameworks and their own decarbonisation targets. The Committee will provide separate advice to each of the devolved administrations on their carbon budgets later this year.
Performance against UK carbon budgets to date
The UK’s First, Second, and Third Carbon Budgets, covering the periods 2008 to 2012, 2013 to 2017 and 2018 to 2022 were 3,018 MtCO2e, 2,782 MtCO2e and 2,544 MtCO2e respectively. These targets were set based on the old 2050 target of an 80% reduction in emissions. The UK has met all of these targets, with GHG emissions having roughly halved since 1990 (Figure 1.3).
- The UK outperformed these first three carbon budgets by 36 MtCO2e, 384 MtCO2e, and 391 MtCO2e respectively. In percentage terms, these budgets were outperformed by 1%, 14% and 15% respectively.
- Emissions savings from electricity and fuel supply, due to the phase-out of coal generation and roll-out of renewables, contributed more than half of the reductions seen over this period. Reductions in industry, waste, surface transport, and buildings also played a role.
| Figure 1.3 UK historical emissions and existing targets |
 Description: The UK’s greenhouse gas emissions have roughly halved since 1990 and the first three carbon budgets have been achieved. |
Active legislated UK carbon budgets
The UK’s emissions target for 2050 is Net Zero. This was legislated in 2019 and was a step up from the previous target of an 80% reduction. It remains an appropriate long-term target for the UK.
- The latest science indicates that in global pathways temperature increases stabilise after Net Zero CO2 is reached globally. At Net Zero GHGs, temperatures start to reduce, as short-lived residual methane emissions are being balanced by long-lived CO2 removal.
- Achieving Net Zero GHG emissions (with Net Zero CO2 reached sooner) will therefore halt and begin to reverse the UK’s contribution to global warming. The UK should aim to achieve this as soon as possible, to show leadership in reducing global temperatures.
- The UK’s target of Net Zero by 2050 is consistent with IPCC scenarios that limit warming to 1.5ºC. NDCs and carbon budgets are set to define a feasible pathway to achieve this that is both ambitious in its pace and deliverable.
The next three steps on the way to Net Zero are the Fourth, Fifth and Sixth Carbon Budgets, covering the periods 2023 to 2027, 2028 to 2032, and 2033 to 2037, which are legislated at 1,950 MtCO2e, 1,725 MtCO2e, and 965 MtCO2e respectively (Figure 1.3).
- The Fourth and Fifth Carbon Budgets do not include international aviation and shipping emissions. The Sixth Carbon Budget is the first UK target to include emissions from the UK’s share of emissions from international aviation and shipping, but this is not yet in legislation.
- The steep reduction between the Fifth and Sixth Carbon Budgets is due to the fact that the Sixth Carbon Budget is the first set in line with Net Zero. The Fourth and Fifth Carbon Budgets were set on a trajectory to the previous 80% target. These carbon budgets will therefore need to be overperformed in order to be on a sensible path to Net Zero.
- The UK’s 2030 NDC provides a target for this time period that is consistent with a pathway to Net Zero by 2050. The UK has also recently confirmed its 2035 NDC, which requires a similar level of emissions reduction to the Sixth Carbon Budget.
1.2.4 UK emissions by sector
The UK’s emissions reductions since 1990 have been driven by strong progress in decarbonising electricity supply (Figure 1.4). In some important sectors, including surface transport (outside the effects of the COVID-19 pandemic) and agriculture, emissions trends have been broadly flat. The carbon sequestered in land use sinks has decreased over this period.
- In 1990, electricity supply was the UK’s highest-emitting sector. Since then, emissions from this sector have fallen by 81%, with most of this reduction coming since 2008. These trends have been driven by the ramp-up in renewable generation and the complete phase-out of coal.
- The UK’s last coal-fired power station, Ratcliffe-on-Soar, closed in September 2024. This was a historic moment – the UK becoming the first major economy to phase-out coal received worldwide attention.
- The UK also has a high share of renewables relative to most other OECD countries.
- There have been falls in emissions from industry, fuel supply, waste, and buildings.
- In industry, emissions have fallen by 63% since 1990. Much of this has been due to a fall in the output of emissions-intensive industrial sectors, in particular steel and chemicals, due to a structural shift towards less carbon-intensive but higher-value industrial output.
- Fuel supply emissions have fallen by 60% since 1990, primarily driven by a reduction in coal mining and the associated methane emissions.
- Waste emissions have fallen by 66% since 1990.[73] The main cause of this has been reductions in methane emissions from landfill because of the introduction of a tax.
- There has been a gradual reduction in emissions from buildings. This has been driven by policies to improve the efficiency of heating appliances and deliver investments in building fabric efficiency, along with more recent reductions in heating demand due to recent warmer-than-average temperatures and high gas prices.
- Emissions in surface transport, aviation, agriculture, land use, and F-gases have shown limited or no reductions overall. However, strong recent progress in electric car sales has started to have a small positive contribution towards emissions reduction in surface transport.
| Figure 1.4 UK emissions by sector since 1990 |
  Description: Reductions in emissions since 1990 have been predominantly driven by the electricity supply and industry sectors. Emissions in many other sectors have shown limited or no reductions overall. |
Chapter 2: Developing a pathway to Net Zero and the Seventh Carbon Budget
Introduction and key messages
This chapter sets out our approach to developing our Balanced Pathway, which provides the basis for our recommendation on the level of the Seventh Carbon Budget.
Our key messages are:
- The Balanced Pathway is an ambitious, deliverable pathway for the UK to reach Net Zero by 2050, based on detailed modelling of cost-effective, feasible decarbonisation options.
- The pathway is made up of the roll-out of low-carbon technologies and land-based measures, and reductions in demand for high-carbon activities. Our analysis is based on a broad range of evidence and data and has been validated through consideration of historical and international comparisons, stakeholder engagement, and a citizens’ panel.
- Most emissions can be eliminated through cost-effective and feasible options to almost completely decarbonise the majority of sectors. Some emissions are expected to remain in sectors with no credible way to completely decarbonise by 2050. Our pathway explores the best balance between credible emissions reduction options and greenhouse gas (GHG) removals to counteract unavoidable residual emissions.
Our Methodology Report contains further details of our analytical approach.
2.1 Baseline emissions with no further decarbonisation action
2.1.1 The role of a baseline in our analysis
We compare our modelled pathway to Net Zero with a hypothetical baseline pathway that does not include further climate action, enabling us to calculate the required abatement, investment needs, costs, and savings associated with the future actions to reduce UK GHG emissions.
In our baseline, low-carbon technologies generally remain at today’s stock levels and today’s efficiencies.[74] Projections for baseline emissions over time are based on projected changes to factors such as population, GDP, the warming climate, and fuel prices. Overall, this generally leads to a gradual increase in baseline emissions over time, although there are differences in each sector. There is also considerable uncertainty associated with the impact of many of these factors, which we address in Chapter 6. As our baseline reflects the latest evidence on the current stock share of low-carbon technologies and demand for high-carbon activities, it includes progress that has been made over recent years and therefore differs from that used in previous carbon budget advice.
Our approach to constructing a baseline allows us to demonstrate the full range of actions needed to reduce emissions, without taking a view as to whether they are driven by policy or markets. As a result, the full range of abatement actions that are required to move from today’s world to Net Zero can be quantified and costed within our pathway. Our baseline is not intended as a projection of what may happen based on current trends or markets. This differs from other baseline definitions:
- The Government’s Carbon Budget Delivery Plan uses a baseline derived from their Energy and Emissions Projections (EEP), which includes estimated emissions reductions from existing and some planned policies.[75]
- Some baseline definitions (including those used in government policy appraisal) include a projected uptake of low-carbon technologies in the absence of new policy.[76] For example, they would predict a rise in sales of electric vehicles (EVs).
2.1.2 Emissions in our baseline
In our baseline, emissions grow steadily to 16% above 2023 levels by 2050. This is driven mainly by the baselines for surface transport and aviation, which rise in line with population and GDP.
- In most sectors, our baseline assessment is based on either published government scenarios or government modelling. This provides a common basis for interpreting our advice.
- This includes the industry, agriculture, fuel supply, waste, and non-residential buildings sectors, for which we use EEP scenarios excluding emissions savings associated with any policies that go beyond those already being realised today.
- In surface transport, we assume the vehicle fleet remains split among powertrains as it is today and use the core forecast from the Department for Transport’s (DfT) National Road Traffic Projections – adjusted to match the latest actual data – to give the levels of traffic demand.[77]
- Our aviation and shipping baselines are based on bespoke runs of DfT models, assuming no change in fleet makeups and demand primarily driven by GDP growth.[78]
- For electricity supply, our baseline comes from modelling undertaken for us by AFRY, using their BID3 model which is also used by the Department for Energy Security and Net Zero (DESNZ).[79] It uses the level of electricity demand modelled in our baselines across sectors and assumes that new low-carbon generation is only deployed to replace existing low-carbon assets at end-of-life.
- In the other sectors, we developed our baseline using in-house or commissioned models.
- In residential buildings, we commissioned Kamma to produce a baseline dataset representing today’s building stock. The fabric of, and types of heating system used by, these existing buildings are assumed to remain the same over time, with demand for heating slightly declining as the climate warms. The housing stock grows in line with projected future housebuilding rates, with new builds using gas heating.
- Our land use baseline is based on modelling by the UK Centre for Ecology and Hydrology. This is calibrated against the most recent inventory estimates of land use sources and sinks and projects forward recent trends in what land is being used for.
- For F-gases, our baseline was produced by Ricardo, considering population changes and European legislation which is already affecting component design.
- The baseline includes no engineered removals as these have not yet been deployed in the UK.
2.2 Developing our Balanced Pathway
2.2.1 Approach to pathway analysis
Our advice on the level of the Seventh Carbon Budget is informed by an updated Balanced Pathway. This is an ambitious, deliverable pathway that represents our assessment of the UK’s best path to reach Net Zero by 2050, based on the latest evidence and data.
- The pathway is developed by dividing the UK’s emissions into sectors of the economy and determining credible emissions reductions for each from 2025 to 2050. In each sector, we start from the baseline and consider which emissions reduction options would be most suitable.
- In many of the sectors that currently dominate the UK’s emissions, including surface transport, buildings, industry, and electricity supply, cost-effective options are expected to be available to almost completely decarbonise the sector. The pathway therefore explores options to achieve this.
- Some emissions are expected to remain in sectors with no credible way to completely decarbonise, including agriculture, aviation, waste, and land use sources. Our pathway explores the best balance between credible options to reduce emissions and balancing these with greenhouse gas removals, both in ‘nature’ (via carbon sequestration in land use sinks) and ‘engineered removals’ (such as approaches utilising carbon capture and storage (CCS)).
- Interactions between sectors are captured through modelling of the energy system required to supply the energy used in each sector. This includes consideration of the roll-out of low-carbon electricity generation, the role of flexibility in supply and end-use sectors, and other low-carbon energy carriers (for example, low-carbon hydrogen).
- In forming judgements on feasible actions for inclusion in our pathway, we consider a range of evidence, including the projected pace of technology development, possible shifts in societal attitudes, data on costs and choices, current and historical trends, and examples of progress in other countries. We have engaged with a broad range of stakeholders from across government, industry, and wider society to validate assumptions, and we convened a citizens’ panel to explore the question of what an accessible and affordable vision of Net Zero would be for households.[80]
2.2.2 Key drivers and constraints in our modelling
We consider two broad types of emissions reduction action in our pathway:[81]
- Roll-out of low-carbon technologies and land-based actions. This includes the roll-out of electric and other low-carbon technologies and greenhouse gas removals, enabled by building a system that meets the required energy demand using a resilient mix of low-carbon sources. Credible roll-out rates depend on both the available supply of low-carbon technologies and the demand for them. Similar roll-out considerations also apply to actions within nature that can store carbon in land-based sinks or reduce emissions from land.
- Reducing demand for high-carbon activities. This depends on sustained household and business choices to reduce high-carbon activities. We include measures to improve the efficiency with which high-carbon technologies are used within this area.[82]
When determining whether or when an option is suitable for inclusion in our pathway, we take an evidence-driven approach to assess an ambitious but deliverable level and pace of uptake. For both low-carbon technologies and reducing demand, we base our assessment on what has been achieved or evidenced to date. For low-carbon technologies, this involves relying on technologies that we can confidently assume will be ready to operate at scale before 2050 and assessing credible rates of uptake; for reducing demand, this involves considering successful case studies as well as current and historical trends and social research to assess what sustained shifts in choices could feasibly be achieved by 2050. Our approaches in each area are outlined in Section 2.3 and Section 2.4.
2.2.3 Factors that we consider in developing an emissions pathway
Under the Climate Change Act, carbon budgets must take account of a range of matters. We have considered all of these in our analysis:
- Scientific knowledge about climate change. The latest scientific understanding is summarised in Section 1.1. The 2050 Net Zero target, the UK’s NDCs, and the Sixth Carbon Budget remain consistent with this – our analysis determines an ambitious, deliverable pathway to meet these in a cost-effective manner.
- Technology relevant to climate change. Our approach to modelling technology roll-out and the constraints that determine this is outlined in the following section, Section 2.3, as well as in the sectoral sections in Chapter 7.
- Economic circumstances. The costs and cost savings of the pathway are set out in Chapter 4, while the investment opportunities arising from these and the impact on the economy, businesses, and workers are assessed in Chapter 9.
- Fiscal circumstances. Fiscal impacts, including impacts on public spending, are assessed in Section 4.3. Some possible uses of taxation are discussed in Chapter 8.
- Social circumstances. Chapter 8 explores the impacts of the pathway on households. This includes impacts on groups with protected characteristics and wider distributional impacts, while we consider impacts on fuel poverty in Section 7.2. Section 2.3, Section 2.4, and the sectoral sections in Chapter 7 discuss the role household and business choices play in our modelling.
- Energy policy. Our analysis of the electricity and fuel supply sectors is set out in Section 7.5 and Section 7.7, respectively. In addition, what the pathway means for overall demand for different energy carriers and its implications for energy security are explored in Section 10.2.
- Differences in circumstances between England, Wales, Scotland, and Northern Ireland. We summarise how the different circumstances in each nation are reflected in our analysis in Section 3.4. Emissions pathways for Scotland, Wales, and Northern Ireland will be published in separate advice reports to the devolved administrations later in 2025.
- Circumstances at European and international level. Section 1.1 outlines the current international context, while Section 10.1 assesses how our pathway fits within this context.
- International aviation and shipping. The contribution of international aviation and shipping emissions to the recommended budget level is discussed in Section 3.1, while our analytical approach to these sectors is set out in Section 7.6 and Section 7.10.
There is clearly considerable uncertainty around how factors such as costs and feasibility will develop over a 25-year timeframe. We explore this in Chapter 6.
2.3 Roll-out of low-carbon technologies and land-based actions
Our pathway depends on the rate of roll-out of a range of low-carbon technologies and land-based actions. It will be important to monitor indicators of technology development and uptake, as well as leading indicators (where available) of supply and demand. We discuss this in Chapter 5.
2.3.1 Low-carbon technologies
All of the technologies that we need already exist in some form: many are commercially viable and can be deployed at scale today; others are commercially viable but yet to be deployed at scale; and some novel technologies have been prototyped and demonstrated but require further support and refinement to commercialise. We also expect developments to result in improvements to existing technological solutions and to offer new options. We avoid relying heavily on speculative future technological advances lacking a firm evidence base.
There are two key components to our analysis of technology roll-out: cost effectiveness (both as a snapshot and from a dynamic perspective) and feasibility constraints on the pace of investment and delivery (both supply-side and demand-side). There have been substantial cost reductions in many low-carbon technologies over recent years. As a result, it is often feasibility constraints that are binding in determining the shape of the deployment pathways for many technologies.
Cost effectiveness
When constructing our sectoral pathways, consideration is given to the most cost-effective choice between alternative credible low- or zero-carbon technologies and emissions reduction measures, and to the timing of roll-out.
- Snapshot cost effectiveness: in general, we consider technologies for inclusion in the pathway only once they become cost effective compared to the UK Government’s ‘target-consistent’ carbon values.[83]
- We assess this by comparing the abatement cost of a new unit of technology (see Section 4.2.1) with the Government’s carbon values, which represent the value that UK society places on avoiding emitting 1 tCO2e. They were developed by the UK Government to be consistent with the 2050 Net Zero target and to take a least-cost approach to minimising cumulative emissions over the period to 2050.
- A measure can be cost effective despite being more expensive than its high-carbon alternative if the cost difference is lower than the implied cost saving from reducing emissions. This will happen in the early stages of many technology roll-outs, and provides justification for incentives/regulations to enable uptake sooner than might occur if relying on financial costs alone. In many cases, this will help to drive costs down, resulting in low-carbon technologies eventually becoming cost saving. We do not directly calculate this spillover benefit in our cost effectiveness assessment, but we take it into account in our assessment of dynamic cost effectiveness (see below).
- For many technologies (including solar, wind turbines, and batteries), consistent and rapid cost reductions have been seen over the past 20 years.[84];[85] We project how costs could develop in our pathway based on observed learning rates and expectations about how these may continue. Recent research found that the potential scale of cost reductions could be greater than considered in most energy-economy models.[86]
- Many key measures (including EVs and heat pumps in new homes) have already reached snapshot cost effectiveness for at least some parts of the market. By the Seventh Carbon Budget period, this will be true in even more cases. At that point, feasibility constraints often play a more binding role in determining roll-out rates.
- In cases where multiple competing low-carbon technologies are credible, we consider the costs and feasibility of each and generally select the most cost-effective feasible mix (for instance choosing electrification, hydrogen, or CCS across different industrial sites). Where one technology is already being deployed at scale and is clearly expected to dominate the market (as is the case with EVs), we focus on this in preference to more niche options, while in some cases where technologies are at an earlier stage of development (such as solid versus liquid direct air carbon capture and storage (DACCS)), we impose a split choice in our modelling to maintain optionality, reflecting current uncertainty.
- Dynamic cost effectiveness: while the carbon values provide a snapshot view of cost effectiveness, taking this approach alone can miss the benefits of early action in opening up additional opportunities for emissions reductions later on or cost reductions that could reduce the overall cost of reaching Net Zero. Therefore, where key early actions are not cost effective in a given year but result in lower costs in future years, they may be included.
- Examples in our pathway include early action to decarbonise public buildings, which can help build supply chains to lower costs for commercial and domestic premises, and deployment of DACCS, which begins before snapshot cost effectiveness to enable operation at scale by the time it is cost effective.
There are a small number of cases where we include in our pathway things that do not individually achieve cost effectiveness or are less cost effective than other feasible options. These are justified either by considering beneficial co-impacts on the wider system or to maintain optionality in an uncertain aspect of the decarbonisation path (for example, sustainable aviation fuel (SAF)).
When considering the trade-offs between alternative technologies we are mindful that projected costs are uncertain, and the cost of currently expensive technologies may fall significantly in the future. However, if cost-effective alternatives are unlikely to be available in the near future, we develop our pathway on the basis of a more limited set of feasible technologies.
Feasible roll-out rates
The cost of abatement is taken together with a range of other considerations to determine a feasible, deliverable roll-out rate for each technology in our pathway. These include both supply-and demand-side factors. The importance of each factor varies depending on the sector and is based on the latest available evidence.
Supply of low-carbon technologies
Supply-side factors could constrain or enable the roll-out of low-carbon technologies. They include:
- Maturity of technology: this means how well-established a given technology is and how this is likely to change in the future. We only include technologies that are expected to become sufficiently established to reach large-scale operation or adoption in the UK before 2050.
- We base this judgement on the internationally recognised system of technology readiness levels (TRLs).[87] We apply a guiding threshold of TRL 6 – generally only including technologies that we assess as being already at or above this level.[88] This represents those that have reached the stage of being demonstrated in a relevant environment.
- Typical timescales for different technologies to progress from low readiness levels to deployment at scale mean we cannot reliably expect those currently below this threshold to play a significant role before 2050.[89] In practice, this is dependent on the specific type of technology and market conditions, so it is possible some early-stage technologies may progress more or less quickly than we have assumed in our modelling.
- For emerging technologies in our pathway (those at TRL 6–7, including synthetic SAF and DACCS), we generally seek to minimise reliance on them as a sole solution and leave scope for optionality, for example, by including a mix of technologies and options to reduce demand for high-carbon activities in our pathway.
- By contrast, in many cases where a technology has progressed to the highest TRLs and is being deployed at scale (for example, EVs and heat pumps), there is value in narrowing down the option space and ensuring that policy enables rapid roll-out of what is now becoming the clear best choice.
- Construction timelines: where the measure requires substantial new construction (of either the measure itself or facilities to produce it), we consider the lead-times associated with this construction. This is particularly relevant for more complex infrastructure projects.
- Availability of energy and other resources: we consider dependency on energy supply for energy-intensive processes, as well as whether the materials required to manufacture the technology are sufficiently available globally and whether supply chains for the UK will be able to scale up sufficiently quickly.
- Efficient, low-carbon, electric technologies play a key role in our pathway. In our analysis, the electricity supply sector must decarbonise the existing system; increase supply of low-carbon electricity to meet new demands; and ensure resilience to the effects of climate change and extreme weather.[90]
- We discuss overall demands for energy (including lower dependence on volatile global fuel markets) and for critical minerals in Section 10.2.
- Availability of skilled workers and supply chains: even when there is sufficient production capacity, trained workers need to be available to install or maintain new technologies. Depending on the technology, businesses may need to set up new supply chains, develop training materials, deliver new training to existing workforces, or build new capacity. The rate at which these can scale up is a key factor in determining the roll-out of heat pumps: these are a well-established technology for home heating, but their installation at scale will require the installer base to be retrained from primarily focussing on gas heating.[91] This is also an important factor in determining industrial decarbonisation rates.
- Availability of supporting infrastructure: in several areas, new technologies depend on wider supporting infrastructure to be able to deliver emissions reductions.
- This is true for all technologies that rely on low-carbon energy, as the energy system must be able to support this. It is particularly acute for renewables and industrial sites, for which grid connections and expanded transmission capacity will be needed.[92];[93]
- Technologies that rely on storing carbon are dependent on the pace at which geological stores and a network for transporting captured carbon to them can be established. Supply of low-carbon hydrogen, including to provide storable energy and as a feedstock for synthetic fuel, is similarly dependent on pipeline infrastructure.
- Planning and regulatory timescales: in some cases, the regulatory landscape will need to evolve to accommodate new technologies and enable markets to grow. In others, planning requirements can limit the pace of change. We generally try to ensure that planning and regulations do not constrain roll-out rates in the pathway if government could reasonably be expected to take timely actions to address these barriers.
- Regulatory approval and clear business models are a prerequisite for some technologies that have not yet entered the market.
- Delivering Net Zero will require rapid deployment of a range of new infrastructure and assets. How these interact with the communities in which they will be located is an important consideration, but it is also important that the planning system gives appropriate priority to the national importance of cutting emissions, adapting to climate change, and enhancing biodiversity.
Demand for low-carbon technologies
Feasible roll-out rates are also determined based on factors that could affect the pace at which consumers and businesses purchase and use low-carbon technologies effectively.[94] They include:
- Household and business costs: whether a technology will present a cost or a cost saving for a household or a business is important if take-up relies on private decisions between low- and high-carbon assets.
- Many of the low-carbon technologies in our pathway incur an upfront purchase price premium but benefit from running cost savings. This is particularly significant for modelling EV uptake, where the running cost savings already outweigh the upfront price premium for some drivers.[95] Our analysis of EV uptake considers the role of both the upfront price and the total cost of ownership in determining purchase decisions.
- Purchase prices of many technologies (including EVs) are falling quickly. While some do remain considerably more expensive today, a key determining factor is the point at which purchase price parity is reached. At this point, the low-carbon option will clearly be the cheaper option, given the running cost savings described above. As households tend to focus more on upfront costs, they may be reluctant to purchase the technology until this parity is reached.[96];[97]
- For technologies where this does not occur quickly (such as heat pumps), regulation and market mechanisms can accelerate cost reductions and purchase incentives from government can help close the gap (see Chapter 5 on delivery). For some technologies, purchase price parity may not be reached before 2050. In that case, there may be an ongoing role for incentives, price-based levers (such as the UK Emissions Trading Scheme (UK ETS)), or mechanisms to distribute upfront costs across asset lifetimes (for instance, heat as a service). In such cases, we consider different options for government or households/businesses to pay, taking account of distributional and fiscal impacts (see Chapter 4 on costs and Chapter 8 on household impacts).
- Social acceptability and consumer preferences: in addition to purchase price and running costs, cultural and social norms and perceptions of technologies, as well as individual attitudes, play a role in determining the pace at which new technologies are adopted.
- Most new technologies follow an ‘S-curve’ adoption profile, whereby roll-out begins with a slow ramp-up among innovators and early adopters, followed by a rapid acceleration as the technology hits mass market and then a slowdown as the final groups, more resistant or less able to adopt new technologies, are reached.[98];[99] This typically reflects both changes in purchase price of new technologies as well as changing social norms and attitudes towards those technologies.
- Consumers are also likely to consider wider benefits and impacts of low-carbon technologies. In many cases, these offer additional advantages (for example, a better driving experience in EVs or improved indoor air quality from heat pumps). However, some technologies (for example, low-carbon heating systems) may present additional barriers to consumers such as a more complex installation process.
- To reach mass market adoption, consumers and businesses need to have familiarity with a low-carbon technology, and then confidence that low-carbon technologies can meet their needs.[100] Familiarity and confidence can take time to develop, and then accelerate through spillover effects and increased exposure.[101]
- There is already strong public awareness of climate change and Net Zero in the UK.[102] It is possible that societal norms and consumer preferences will increasingly shift towards low-carbon choices, accelerating the roll-out of certain technologies (as with the increasing acceptance of LED light bulbs over the past decade or increasing consumer preference for EVs in Norway).[103];[104] Effective consumer and business advice will be needed to enable this to happen consistently.
- Natural stock turnover and early scrappage: in many cases, low-carbon technologies are replacing existing high-carbon alternatives. In general, our modelling assumes this occurs only at the end of their physical lifetime.
- This is the case for key consumer technologies such as cars and heat pumps – our pathway does not require people’s current cars or boilers to be replaced earlier than their natural replacement cycles.
- We include limited early scrappage in the non-residential buildings and industry sectors. Many of these premises are significant users of energy, so replacing high-carbon systems early can deliver large emissions savings. Mechanisms such as the UK ETS and low-carbon heating policies will be needed to ensure businesses are properly incentivised to do this when required. We also explore potential additional benefits of limited early scrappage in surface transport and residential buildings in our contingency options in Chapter 6.
In addition, existing or expected policy commitments (including government targets, regulations, and mandates) can set expectations for suppliers and consumers, affecting the pace at which roll-out occurs. Clear, consistent targets and messaging provide clarity to industry on timelines for scaling up supply and to consumers on expected technology availability. This builds confidence in the direction-of-travel and can help speed up roll-out.[105] Examples include existing targets on zero-emission vehicles and SAF and phase-out dates for new fossil fuel vehicles and boilers.
Key low-carbon technology roll-outs in the Balanced Pathway
The key constraints and enablers that determine the roll-out of some key technologies in our Balanced Pathway are set out in Table 2.1. Further discussion of the technologies assumed and the main factors determining roll-out rates can be found in Chapter 7.
| Table 2.1 Factors that determine roll-out rates of key technologies in the Balanced Pathway |
||||||||||||
| Supply-side | Demand-side | Existing policy commitments |
||||||||||
| Maturity of technology |
Construction timescales |
Energy and other resources |
Skilled workers and supply chains |
Supporting infrastructure |
Planning and regulatory timescales |
Social cost effectiveness |
Household/ business cost |
Consumer preferences |
Natural stock turnover |
Early scrappage* |
||
| Renewables and grid storage |
Near-term pipeline |
Grid and connections |
Infrastructure planning |
|||||||||
| EVs | Charging network |
Until price parity reached |
Observed preferences for EVs/ICEs |
Phase-out date |
||||||||
| Heat pumps – residential |
Installer availability |
International demand comparisons |
Suitability for homes; level of demand |
Phase-out date |
||||||||
| Heat pumps – non-residential |
Installer availability |
Suitability for premises |
Public sector emissions targets |
|||||||||
| Industrial heat |
Installer availability |
Hydrogen pipelines |
Costs to industries |
|||||||||
| SAF | Feedstock supply |
Balance of SAF and DACCS |
SAF mandate† | |||||||||
| Low-carbon hydrogen supply |
Surplus low-carbon power |
Networks and storage |
||||||||||
| CCS | Networks and storage |
Infrastructure planning |
Costs to industries |
|||||||||
| Alternative proteins |
Regulatory approval |
Price parity | Taste; nutrition; reception |
|||||||||
| DACCS | Electricity grid constraints |
Networks and storage |
Net Zero | |||||||||
Legend:
Factors included within our roll-out modelling.
Key factors that determine the pathway in our roll-out modelling.
Factors that are not explicitly constraints in our roll-out modelling, but we do assume that these develop at the rates required.
Notes: *In general, our modelling assumes that existing assets are replaced only at end-of-life. We include limited early scrappage in the non-residential buildings and industry sectors but constrain this to happen only when cost effective and feasible. †Our pathway does not meet the SAF mandate targets, but these are used to inform our assessment of the credible pace of scale-up of SAF production. In all cases shown, multiple factors play a key role in our modelling – the relative importance of these factors and how they combine to determine roll-out rates vary over the pathway and often between different settings in which the technology is being deployed.
2.3.2 Nature
Woodland creation, peatland restoration, and other land use changes can build the UK’s land use sinks by enabling them to sequester more CO2 and reducing emissions that come from land use. We follow a similar approach to that described for technology roll-outs above to determine feasible planting and restoration rates.
- Our analysis is based on an assessment of the existing and credible future availability of land for each purpose, which provides a starting point for assessing what changes can be achieved. As part of this, we consider differences in land type between the four nations of the UK. This allows for a more resilient mix of measures that are suitable for the land types available.
- Skilled workers and supply chains are key constraining factors in many cases. For example, for woodland creation, nursery and contractor capacity constrain the pace at which trees can be planted.[106]
- We also ensure that the actions included are consistent with wider environmental objectives, as land-based actions, if planned and delivered appropriately, can offer wider benefits to nature alongside delivering emissions reduction and carbon sequestration.
- This includes following regulatory principles in assessing credible land-based actions, where these are available and considered robust (see Section 5.3, Box 5.1).
- We discuss the interaction of our pathway with wider nature objectives further in Section 7.4.3.
2.4 Reducing demand for high-carbon activities
Our sectoral pathways include feasible reductions in demand for high-carbon activities, through both sustained low-carbon choices and increasing efficiencies. Just as with technology roll-out, it will be important to monitor delivery progress – this is considered in Chapter 5.
2.4.1 Sustained low-carbon choices
Our assessment of feasible sustained shifts away from high-carbon activities is based on relevant comparable evidence, considering observed shifts and necessary enabling conditions.
- Reducing demand for high-carbon activities can constitute a switch to a low-carbon alternative (for example, from car to public transport), a reduction in a high-carbon activity (for example, reducing flying), or a combination of the two. When considering a switch, we consider what conditions would need to be in place for the low-carbon choice to be easy, attractive, and affordable to enable people to shift and sustain habits.
- These sustained low-carbon choices can be enabled by technological and market-driven shifts in consumer preferences, changing societal norms, public information, regulation, and price incentivisation.[107] We consider sustained low-carbon choices as an option to reduce emissions where there is a technological solution, but more efficient alternative approaches help reduce emissions along the path to Net Zero (for example, reducing waste or switching from car to public transport) or where there is no technological solution in our pathway to completely eliminate emissions (as in aviation and meat and dairy production).
For many demand-side measures, costs and cost savings accrue less directly, can be spread across the system (as with network benefits from public transport), and are difficult to quantify.[108];[109] We typically do not attempt to quantify cost effectiveness of these measures directly. Instead, we draw on a range of evidence such as trends, case studies, behavioural science, and wider evidence.
Observed shifts and wider impacts
To inform our assessment, we consider relevant comparable evidence that shows what shifts can be delivered and their impacts. These include:
- International and domestic case studies: we consider case studies where strong performance is already being seen as well as comparable shifts that have been observed historically. In each case, we consider how comparable these are to the present UK context and the actions that would be needed to enable similar outcomes to be achieved.
- Current trends and consumer preferences: as for technology choice, societal norms and public attitudes towards low- and high-carbon options play a role in how choices develop.
- Where consumer attitudes are already moving towards lower-carbon alternatives, there are opportunities to build on these. This is the case, for example, with recent trends around increased focus on sustainability in consumer food choices.[110]
- In some cases, there is latent potential for people wanting to adopt low-carbon choices, but other barriers (such as affordability or availability) currently hinder this.[111]
- Geographical variation: we also consider how factors driving demand reduction might vary by devolved administration and region. This includes considering, for example, how potential for modal shift varies in rural and urban areas.[112]
- Co-impacts and distributional impacts: we consider how shifts away from high-carbon activities and the levers used to achieve them impact household options and costs. Often, low-carbon choices also offer positive wider impacts, for example on public health and wellbeing.[113];[114] Co-impacts and household impacts are discussed in Chapter 8.
Impact of policy levers
We consider the factors that influence people’s decision-making and the potential effectiveness of actions to enable low-carbon choices. In doing this, we focus mainly on behavioural science evidence on people’s actual behaviour and choices, with less emphasis on studies that assess people’s intentions and attitudes towards these choices. Our citizens’ panel explored how policies could make some of the low-carbon choices considered in our pathway accessible and affordable for all households. Relevant levers include:
- Public information and awareness: increased information about the emissions impact of different goods and services can be an important prerequisite and support a shift, but is unlikely to lead to substantial changes on its own.[115]
- Choice environment: ensuring that low-carbon options are readily and widely available or that the barriers to choosing these are lower than for their high-carbon alternatives will allow more people access to the opportunity to make these choices.
- Provision of, for example, improvements to active travel infrastructure can encourage a shift away from private cars, while increased availability of plant-based products has been shown to increase sustained choices of plant-based foods.[116];[117]
- Nudges, such as changing where and how products are displayed, have also been shown to increase low-carbon choices.[118];[119]
- We focus primarily on options that enable more people to make low-carbon choices through increasing the availability of attractive options for consumers, but measures to discourage high-carbon options can also help deliver shifts.
- Relative price signals: we consider the effect that reducing the price of low-carbon alternatives or, where required, increasing the price of high-carbon activities can have on consumers’ willingness to select and sustain a low-carbon choice.
- Shifts are more likely to be successful if the incentives to consumers are aligned to the required shift. For example, reducing the costs of plant-based alternatives to meat that are comparable in taste, texture, and preparation method could enable more people to choose these options for some of their meals.
- There is potential for innovation to make some low-carbon alternatives (for example, alternative proteins) more substitutable for high-carbon choices and to bring down prices.
Key sustained low-carbon choices in the Balanced Pathway
The key factors that determine the assumed level of key demand shifts in our pathway are set out in Table 2.2. Further discussion of the low-carbon choices assumed and the main factors determining the level of the resulting shifts can be found in Chapter 7.
| Table 2.2 Evidence and factors that inform the level of key sustained low-carbon choices in the Balanced Pathway |
|||||||
|
Evidence on observed shifts and wider impacts |
Evidence on impact of policy levers |
||||||
| International and domestic case studies |
Current trends and preferences |
Geographical variation |
Distributional and co-impacts |
Information and awareness |
Choice environment |
Relative price signals |
|
| Meat and dairy consumption |
|||||||
|
|||||||
| Aviation demand | |||||||
|
|||||||
| Recycling | |||||||
|
|||||||
| Modal shift | |||||||
|
|||||||
| Industrial resource efficiency | |||||||
|
|||||||
Legend:
Orange = Factors that were reviewed but did not inform the final level.
Pink = Key factors that informed the final level of demand shift assumed.
White = Factors that were not explicitly considered in our evidence review.
Notes: In all cases shown, multiple factors informed the level of sustained low-carbon choices deemed appropriate for inclusion in our pathway.
2.4.2 Efficiency improvements
Measures to improve the efficiency with which high-carbon activities are undertaken can include a mix of physical and process changes (for example, energy efficiency measures in homes) and sustained low-carbon choices (for example, more efficient driving styles). These are particularly important in sectors where low-carbon technologies do not become available until later (or not at all). In such cases, the increased length of time for which the high-carbon assets are in operation increases the amount of emissions reduction that efficiency improvements can deliver.
- Uptake rates of physical and process changes that improve efficiency are, in many cases, determined by similar factors to those described for low-carbon technologies in Section 2.3, balancing cost effectiveness and feasibility.
- In many cases (including improvements to aircraft performance, industrial processes, and HGV fuel consumption), the efficiency improvements in our pathway build upon trends that already make financial sense for businesses operating these assets.[121]
- Many efficiency measures are mature and well-established, which means that supply-side constraints on deployment are typically less binding.[122] This includes both improvements in the performance of high-carbon technologies (for instance, through growing hybridisation and light-weighting in vehicles) and measures that reduce end-use energy consumption (for example, insulation in homes, businesses, and industrial processes).
- Improvements to operating efficiencies through sustained choices are assessed through similar considerations to those described above for other sustained low-carbon choices.
Chapter 3: The Balanced Pathway
Introduction and key messages
This chapter details how emissions reduce in the Balanced Pathway and provides our recommended level for the Seventh Carbon Budget.
Our key messages are:
- The Seventh Carbon Budget should be set at 535 MtCO2e for the period 2038-2042, which will require UK emissions to fall to 87% below their 1990 levels.
- It should cover all greenhouse gases (GHGs) and include the UK’s share of international aviation and shipping emissions.[123]
- Excluding international aviation and shipping, this equates to a 90% reduction compared to 1990 levels.
- Emissions fall quickly in the Balanced Pathway, continuing the momentum built up since the introduction of the Climate Change Act in 2008.
- Multiple sectors will need to deliver rapid emissions reductions for the Seventh Carbon Budget, particularly surface transport, buildings, and agriculture, as well as continuing progress in the electricity sector.
- By 2040, surface transport emissions will need to have fallen by 86% from 2023 levels, and residential buildings emissions by 66%. At this point, aviation and agriculture will be the dominant sources of UK emissions.
- By 2050, remaining emissions, predominantly from agriculture and aviation, are offset by removals. In our pathway, agriculture and land use emissions are balanced by the carbon sequestered by land-based measures. Emissions from aviation are balanced by permanent engineered removals, for which the aviation industry is responsible.
- The Seventh Carbon Budget is delivered through five key routes: electricity, low-carbon fuels and carbon capture and storage (CCS), nature, engineered removals, and demand. Electrification, including the supply of low-carbon electricity and its use in electric vehicles (EVs), heat pumps, and industrial processes, delivers 60% of the emissions reduction needed.
- Many of the solutions within these routes are available today and are now much clearer compared to our 2020 Sixth Carbon Budget analysis, with fewer options remaining. These solutions could be rapidly deployed, provided the right incentives are put in place. We have therefore based this advice on a single modelled pathway, supported by a range of uncertainties and contingencies.
- Options remain in some sectors including aviation and shipping. The optimal balance of choices across low-carbon fuels, engineered removals, and demand to address residual emissions remains uncertain. In these areas, we consider a mix of solutions in our pathway, reflecting the importance of leaving several options open at this stage.
3.1 Emissions in the Balanced Pathway
3.1.1 The Balanced Pathway to Net Zero
Our Balanced Pathway represents an ambitious but deliverable pathway for the UK to reach Net Zero by 2050 (Figure 3.1), across all GHGs and including the UK’s share of international aviation and shipping emissions. The Balanced Pathway would represent decisive and deliverable action that continues the momentum built since the introduction of the Climate Change Act in 2008.
- Strong action is needed to deliver rapid emissions reduction during the 2020s in order to get the UK on track to meeting its existing emissions targets. The peak rate of emissions reduction is reached in our pathway around 2030.
- Around three-quarters of the emissions reduction in the Balanced Pathway takes place in the 15 years from now until 2040. This will require emissions reductions to speed up in many sectors.
| Figure 3.1 The Balanced Pathway to Net Zero and the Seventh Carbon Budget |
 Description: Emissions fall quickly in the Balanced Pathway, continuing the momentum built since the introduction of the Climate Change Act in 2008. The Balanced Pathway reaches Net Zero greenhouse gas emissions by 2050. |
3.1.2 Performance against existing future emissions targets
The Balanced Pathway meets all of the UK’s existing targets on GHG emissions (Table 3.1).
- It outperforms the legislated values for the Fourth and Fifth Carbon Budgets (by around 115 MtCO2e and 405 MtCO2e respectively). This is necessary in order to be on a credible path to Net Zero, as these targets were set in line with only an 80% reduction in emissions by 2050.
- It narrowly meets the UK’s 2030 NDC and the Sixth Carbon Budget. These remain ambitious targets, and rapid decarbonisation action will be needed now to achieve them. It also meets the UK’s 2035 NDC, which the Government announced it will set in line with the Committee’s advice based on this pathway.[124]
- It reaches Net Zero GHG emissions in 2050. As discussed in Chapter 1, the UK reaching Net Zero by 2050 and its interim targets are consistent with the pathways required to limit global warming to 1.5°C and in line with commitments made by a leading group of developed countries. Our Balanced Pathway demonstrates that these are achievable targets for the UK.
| Table 3.1 Performance of the Balanced Pathway against the UK’s existing GHG emissions targets |
||
|---|---|---|
| Target | Target level | Pathway performance |
| Fourth Carbon Budget (2023–2027)* | 1,950 MtCO2e over 2023–2027 | 1,835 MtCO2e |
| 2030 NDC* | 68% reduction from 1990 levels | 68% reduction |
| Fifth Carbon Budget (2028–2032)* | 1,725 MtCO2e over 2028-2032 | 1,320 MtCO2e |
| 2035 NDC* | 81% reduction from 1990 levels | 81% reduction |
| Sixth Carbon Budget (2033–2037) | 965 MtCO2e over 2033-2037 | 945 MtCO2e |
| Net Zero 2050 | 0 MtCO2e in 2050 | 0 MtCO2e |
| Notes: *The Fourth and Fifth Carbon Budgets and the UK’s NDCs all exclude emissions from international aviation and shipping. The figures presented here for these targets reflect this, by showing the emissions in our pathway excluding international aviation and shipping. (1) Figures are rounded to the nearest 5 MtCO2e or percentage point. (2) The total for the Fourth Carbon Budget includes published provisional emissions data for 2023 and our pathway projections for 2024-2027. (3) Four UK Crown Dependencies and Overseas Territories are included in scope for the UK’s NDCs. If these territories are assumed to decarbonise in line with their own 2030 targets, the resulting decarbonisation across all the territories in scope is slightly slower, but still meets the NDC targets. | ||
3.1.3 Recommended level of the Seventh Carbon Budget
The Committee recommends that the Seventh Carbon Budget should be set at a total of 535 MtCO2e for the period 2038–2042, including emissions from the UK’s share of international aviation and shipping (Figure 3.2, Table 3.2).
- By 2040 (the middle year of the Seventh Carbon Budget period), this would require emissions to fall to an annual total of 108 MtCO2e. This would represent an 87% reduction in emissions compared to 1990 levels and would see emissions falling by three-quarters compared to today.
- Excluding international aviation and shipping, the required reduction is 90% from 1990.
- The recommended budget level is in line with the total emissions in the Balanced Pathway over the five-year carbon budget period, rounded to the nearest 5 MtCO2e. We discuss the potential impact of uncertainties on the budget and contingency measures that should be developed to mitigate this in Chapter 6.
- The Committee recommends that the Seventh Carbon Budget should include the UK’s share of international aviation and shipping emissions. This is important as reducing both territorial and international emissions is vital to limit global warming.
- When legislating the Seventh Carbon Budget, it is critical that the Government make the necessary regulations under Section 30 of the Climate Change Act to formally include international aviation and shipping emissions in carbon budgets and the Net Zero target. The Government has committed to including them in the Sixth Carbon Budget and Net Zero, but the required regulation changes have not yet been implemented.[125]
The Government should plan to deliver the emissions reductions required to meet the Seventh Carbon Budget through domestic decarbonisation action. The Balanced Pathway provides a roadmap for doing this, showing how this can credibly be achieved. To aid parliamentary scrutiny, the Government should produce a draft set of proposals and plans for delivering the Seventh Carbon Budget, setting out its assessment of the mix of measures that will play a role.
- The Government should not plan to use international credits (referred to as ‘carbon units’ in the Climate Change Act) to achieve the Seventh Carbon Budget. Planning to use credits to achieve UK targets carries risks, including the potential to undermine international leadership, reducing the clarity of domestic sectoral action, and failing to deliver carbon budgets if international credit supply proves unreliable. See Section 10.1.3 for further discussion.
- We assess our recommended budget level to represent a fair and ambitious contribution to global efforts to tackle climate change. It would be a credible contribution towards limiting long-term global warming to the 1.5ºC benchmark referenced in the Paris Agreement. See Section 10.1 for our analysis on this topic.
Delivering the Seventh Carbon Budget will require progress in reducing emissions across the economy, with increased rates of decarbonisation required across most sectors. Achieving this is ambitious but it is deliverable, and the Seventh Carbon Budget has the potential to boost investment, support good new jobs, and enhance the UK’s energy security.
- Delivering the budget will require scaling up investment and supply chains so that almost all new technology purchases are zero-emission by the mid-2030s, together with reducing demand for high-carbon activities and development and deployment of greenhouse gas removal technologies. Many of the key technologies required are already or will soon become cost effective (see Chapter 2). Therefore, we would expect roll-out rates to accelerate, delivering increased rates of decarbonisation. See Chapter 5 for further details.
- Many of the technologies required to deliver the Seventh Carbon Budget are more efficient than the high-carbon alternatives they will replace. Many will therefore be cheaper to run, offering the opportunity for households to make savings. See Chapter 8 for further details.
- The Government adopting the budget would send a clear signal to investors that the UK is committed to an ambitious Net Zero transition. This will help create investment opportunities for UK businesses. See Chapter 9 for further details.
- Meeting the budget will reduce the UK’s reliance on volatile markets for imported fossil fuels, enhancing the UK’s energy security. See Chapter 10 for further details.
| Figure 3.2 The recommended Seventh Carbon Budget |
 Description: The Balanced Pathway meets the UK’s existing future emissions targets and sets the recommended level for the UK’s next target: the Seventh Carbon Budget. |
| Table 3.2 Emissions reductions required to meet the recommended Seventh Carbon Budget |
||||||
|---|---|---|---|---|---|---|
| Emissions during the Seventh Carbon Budget period (MtCO2e) | Reduction relative to | Excluding IAS, reduction relative to | ||||
| Five-year total | Emissions in 2040 | 1990 | 2023 | 1990 | 2023 | |
| Recommended Seventh Carbon Budget |
535 | 108 | 87% | 75% | 90% | 80% |
3.1.4 Key differences to our Sixth Carbon Budget pathway
Our Balanced Pathway is similar in ambition to the pathway set out in our 2020 Sixth Carbon Budget advice (Figure 3.3). Key conclusions, including the appropriateness of key targets such as the 2030 NDC, Sixth Carbon Budget, and Net Zero remain unchanged. But there are some differences:
- Lower starting point. The 2023 starting point of our updated Balanced Pathway is 55 MtCO2e below our Sixth Carbon Budget pathway.
- Around 60% of this is due to changes in emissions accounting, which have reduced the contribution of agriculture, land use, and waste compared to the inventory used as the basis for our Sixth Carbon Budget advice.
- At the time of publication of our Sixth Carbon Budget advice, there was uncertainty over which version of the IPCC’s AR5 global warming potentials (GWPs) would be adopted internationally. Therefore, our modelling used the higher values including the impact of climate-carbon feedbacks.[126] Since then, the lower AR5 GWPs excluding these feedbacks have been adopted internationally, reducing the estimated contribution of methane, nitrous oxide, and F-gases to overall emissions totals.[127]
- There have also been a number of improvements to the UK emissions inventory since 2020.[128] The largest of these – better representing emissions impacts from peatlands – was already included within our Sixth Carbon Budget modelling but using a higher estimate than is now in the inventory. There have been a range of further updates since, mostly affecting the land use sector.
- The remaining 40% reduction is a result of updating our approach to temperature-adjusting emissions in the residential buildings baseline to include more recent temperature trends, reductions in demand (particularly for car travel) due to behavioural changes following the COVID-19 pandemic, and lower industrial output.[129];[130]
- Around 60% of this is due to changes in emissions accounting, which have reduced the contribution of agriculture, land use, and waste compared to the inventory used as the basis for our Sixth Carbon Budget advice.
- Slower initial pace. The slope of our updated Balanced Pathway is slightly less steep in the early years than that of the Sixth Carbon Budget pathway. This is due to delays in action meaning that the roll-out of low-carbon technologies in several areas has progressed more slowly than expected (see our report Progress in reducing emissions: 2024 Report to Parliament).
- Improved modelling of land use sinks. In many sectors, decarbonisation slows towards the tail of the transition. However, carbon sequestration in land use sinks scales up through the 2040s, resulting in our Balanced Pathway having a more linear shape in the later years than in our Sixth Carbon Budget pathway.
- Reduced reliance on imported biomass. A key finding is that our Balanced Pathway is now less reliant on engineered removals using imported biomass to hit Net Zero than in our Sixth Carbon Budget advice, allowing biomass imports to decline from today’s levels in the Balanced Pathway.
- As a result of inventory and GWP changes, lower levels of engineered removals are required to offset residual emissions in 2050 than in our Sixth Carbon Budget advice.
- The fact that the pathway requires lower levels of CO2 removal in 2050 also means that these deploy to lower levels in the 2040s than previously projected. This means that Net Zero CO2 is achieved one year later than in our Sixth Carbon Budget advice.
- Similar implied budget level. Despite these changes, the total emissions during the Seventh Carbon Budget period are very similar to those in our Sixth Carbon Budget pathway, with a difference of less than 2% over the period from 2038 to 2042.
There is substantial uncertainty around emissions accounting, especially in the land use sector, and there could be further changes to GWPs. This means that there is potential for accounting methodologies to change again in the future. We discuss this uncertainty, along with other sources of uncertainty and contingency options that could deliver further emissions reduction, in Chapter 6.
| Figure 3.3 The Balanced Pathway compared to our Sixth Carbon Budget pathway |
 Description: The Balanced Pathway begins from a lower starting point than projected in our Sixth Carbon Budget advice. It also has a slower initial pace of decarbonisation. Despite these changes, the two pathways are very similar from the mid-2030s onwards, including during the Seventh Carbon Budget period. |
3.2 Drivers of emissions reduction in the Balanced Pathway
3.2.1 Emissions by greenhouse gas
The Balanced Pathway reaches Net Zero, across all GHGs and including international aviation and shipping, in 2050. Net Zero CO2 emissions are achieved sooner (Table 3.3). The pathway also sees strong reductions in other GHG emissions (Figure 3.4).
- Net Zero CO2 emissions are reached in 2045. This means that by 2050, the UK will be emitting net negative CO2 and contributing to reducing global temperatures (see Section 3.3.2). CO2 reductions in our pathway come mostly from the roll-out of low-carbon technologies displacing fossil fuel combustion, along with engineered and land-based CO2 removals.
- Methane (CH4) emissions fall steeply in the late 2020s and early 2030s, reaching almost half today’s levels by 2050. This is mostly due to the impact of on-farm measures and shifts away from red meat and dairy in agriculture, and reductions in methane generation at landfills.
- By 2030, methane emissions are 25% lower than their 2020 levels, which is slightly less than the 30% in the Global Methane Pledge.[131] A 30% reduction is achieved by 2032, while reductions ramp up quickly and reach 40% by 2035. In the latest published data, the UK’s methane emissions are already 62% lower than they were in 1990.
- Around half of UK methane emissions come from agriculture. The methane reduction from other sectors occurs more quickly, reaching 34% by 2030.
- Nitrous oxide (N2O) emissions decline steadily in our pathway, also reaching almost half today’s levels. Reductions come mainly in the agriculture sector, along with smaller reductions from reduced fossil fuel combustion across other sectors.
- Emissions of fluorinated gases (F-gases) continue recent trends of falling quickly. These are discussed in Section 7.11.
| Table 3.3 Net Zero dates in the Balanced Pathway |
||
|---|---|---|
| Including international aviation and shipping | Excluding international aviation and shipping | |
| All GHGs | 2050 | 2048 |
| CO2 only | 2045 | 2043 |
| Figure 3.4 The Balanced Pathway by greenhouse gas |
 Description: In the Balanced Pathway, CO2 emissions fall quickly and reach Net Zero by 2045. The pathway also sees strong reductions in other greenhouse gas emissions. |
3.2.2 Sources of abatement
The dominant contribution to the emissions reduction required to meet the Seventh Carbon Budget comes from electrification of key technologies across the economy, enabled by transitioning to and scaling up a low-carbon electricity system (Figure 3.5). There are also important roles for other low-carbon fuels and CCS, nature, engineered removals, and demand.
- Electricity: electrification delivers 60% of the total amount of emissions reduction required by 2040 in the Balanced Pathway. This comes from switching to electric technologies, which are now the clear low-carbon technology choice in many areas (including surface transport and home heating), enabled by decarbonising and expanding electricity supply.
- Low-carbon fuels and CCS: a further 10% of the emissions reduction required by 2040 comes from other low-carbon technologies. This includes the use of hydrogen, both directly and in the production of low-carbon fuels for use in aviation and shipping. It also includes CCS, which can be used to capture combustion and process emissions in industry, as well as playing a role in decarbonising electricity supply and hydrogen production and delivering engineered removals.
- Nature: land-based actions to increase natural carbon sequestration and reduce emissions from land deliver 2% of the required emissions reduction by 2040, although this share grows quickly to over 5% by 2050. This includes new woodland creation and peatland restoration.
- Engineered removals: engineered removals contribute 6% of emissions reduction by 2040, increasing from then on to deliver the savings required to reach Net Zero. This includes a mix of bioenergy with carbon capture and storage (BECCS) and direct air carbon capture and storage (DACCS), as well as a limited contribution from enhanced weathering and biochar.
- Demand: demand measures make up the remaining 22% of emissions reduction by 2040. These include measures to increase resource and/or energy efficiency, such as home insulation, more efficient use of resources in industry, and improved efficiencies of high-carbon technologies, as well as some sustained shifts away from high-carbon activities, for example reductions in meat and dairy consumption and flying.
In many areas of our pathway, most notably electrification but also the role of nature, the solutions required have been or are beginning to be deployed at scale globally. Costs of many of these have been falling quickly, and their role in the UK’s decarbonisation pathway is now clear. This reflects a narrowing in optionality in these areas and an increasing clarity on the best way forward for the UK to reach Net Zero. The challenge for government, markets, and regulators is now to enable these clear solutions to be rolled out at pace.
- In almost all parts of the key end-use sectors of surface transport, buildings, and industry, electrification is now the clear preferred technology for decarbonisation. Rapid, widespread roll-out of EVs, heat pumps, and electric industrial heat is therefore crucial for delivering the Seventh Carbon Budget. The conditions must be put in place for these markets to scale up quickly and for low-carbon electricity to be widely available (including through continued growth in renewables and timely grid expansion) to power a rapid electrification transition.
- The sequestration of carbon in woodlands and the reduction of emissions from peatlands play an important role in balancing residual emissions to help reach Net Zero. Due to the time lag between planting a tree and it delivering meaningful sequestration, it is vital to ramp up delivery of tree planting this decade in order to realise this required contribution. It is also clear that these actions, if delivered appropriately, can deliver wider benefits for nature and climate resilience. These wider objectives should be taken into account, for instance by ensuring that new woodlands are sited appropriately and use suitable species.
By contrast, uncertainty remains around the optimal balance between decarbonisation solutions in some areas. In these cases, maintaining optionality is key at this stage to allow further development of complementary and competing options. We therefore consider a mix of options in our pathway for these areas.
- While it is clear that engineered removals will be required to meet Net Zero, uncertainty remains around the exact form that these will take and their balance versus other measures.
- Maintaining optionality is important in some of the areas that will decarbonise more slowly. This includes aviation, where the balance between sustainable aviation fuel, engineered removals, and demand is not yet clear.
| Figure 3.5 Sources of abatement in the Balanced Pathway |
 Description: The Seventh Carbon Budget is delivered through five key routes: electricity, low-carbon fuels and CCS, nature, engineered removals, and demand. The largest share of emissions reduction is from switch from fossil fuels to electric technologies powered using low-carbon electricity. |
3.2.3 Emissions reductions by sector
Sectoral emissions pathways
Meeting the recommended Seventh Carbon Budget will require contributions across all sectors (Figure 3.6, Table 3.4). This will depend on switching to efficient, low-carbon technologies and reducing demand for high-carbon activities in a range of key areas.
- Surface transport (27% of emissions reduction by 2040): we are already beginning to see EV sales have a measurable effect in reducing emissions. This will accelerate rapidly over the coming years as prices fall and sales grow, with fully electric options accounting for nearly all new car and van sales by 2030 and making up over three-quarters of the fleet on the road by 2040. The zero-emission HGV market will see fast growth during the 2030s, enabled by financial support in the early years. Improved bus and active travel provision enable some journeys to switch to these modes. Further details are set out in Section 7.1.
- Residential buildings (14% of emissions reduction by 2040): supply chains and the workforce of trained installers for low-carbon heating will scale up through the 2020s so that all new and replacement home heating installations are low carbon (mainly heat pumps) by the middle of the next decade. In the nearer term, energy efficiency installations and some sustained behavioural changes will play a role in reducing emissions for existing heating. Further details are set out in Section 7.2.
- Industry (11% of emissions reduction by 2040): the largest share of emissions reduction comes from electrification of industrial heat processes. CCS is important for tackling process emissions and should be targeted at industrial subsectors with limited alternatives. Hydrogen will play a small but important role in subsectors which may find it hard to electrify. More efficient use of resources and energy efficiency improvements also reduce demand for materials and energy, reducing manufacturing emissions. These measures all scale up quickly during the 2020s and 2030s. Further details are set out in Section 7.3.
- Agriculture and land use (7% of emissions reduction by 2040): while low-carbon farming practices and technologies, including livestock measures and decarbonising machinery, can achieve a substantial reduction in agricultural emissions, reaching Net Zero across the agriculture and land use sectors requires a reduction in livestock numbers. This can be achieved by supporting farmers to diversify their income streams and by a reduction in average UK meat and dairy consumption.
- Early action is vital to release land from agriculture to enable its use to grow the UK’s natural carbon sink. Increased tree planting rates in the 2020s have a large sequestration impact beginning in the 2040s, contributing significantly to overall removals, while higher levels of peatland restoration reduce peatland emissions.
- We therefore consider the agriculture and land use pathways together in Section 7.4.
- Electricity supply (12% of emissions reduction by 2040): demand for electricity will increase, especially during the 2030s, driven by the switch to EVs and heat pumps. To meet this growth and decarbonise the system, low-carbon generation is rolled out quickly. Offshore wind forms the backbone of the future system. Storable energy, smart demand management, and interconnection all help maintain security of supply, in much the same way as in the current electricity system. Electricity networks will need to expand to enable consumers to benefit from reliable, low-cost, and low-carbon electricity. Further details are set out in Section 7.5.
- Aviation (5% of emissions reduction by 2040): growth in aviation demand is managed through ensuring that the cost of decarbonising aviation is reflected in the price of flying. The share of sustainable aviation fuel used increases gradually, with a growing portion of this coming from synthetic fuels in the 2040s. Efficiency improvements enable further emissions reduction. Further details are set out in Section 7.6.
- Other sectors (24% of emissions reduction by 2040): emissions reduce across fuel supply, F-gases, non-residential buildings, shipping and waste. Engineered removals also ramp up gradually from 2030 to reach required levels by 2050. Further details of the contributions of each sector to the Balanced Pathway are set out in the relevant sections of Chapter 7.
| Figure 3.6 Sectoral emissions in the Balanced Pathway |
  Description: Emissions fall across all sectors in the Balanced Pathway. Different sectors decarbonise at different rates, meaning that the balance of emitting sectors changes over the pathway. Reductions in today’s highest-emitting sectors (surface transport and residential buildings) mean that agriculture and aviation will be the highest-emitting sectors by the Seventh Carbon Budget period. |
| Table 3.4 Emissions by sector in the Balanced Pathway (MtCO2e emissions and % changes from 2023* levels) |
|||||||||
|---|---|---|---|---|---|---|---|---|---|
| Sector | Current data (2023*) | 2030 | 2035 | 2040 | 2050 | ||||
| Surface transport | 102.8 | 68.6 | (-33%) | 37.0 | (-64%) | 14.9 | (-86%) | 1.1 | (-99%) |
| Residential buildings | 52.2 | 51.4 | (-2%) | 35.2 | (-33%) | 17.7 | (-66%) | 0.4 | (-99%) |
| Industry | 51.8 | 31.4 | (-39%) | 21.1 | (-59%) | 11.2 | (-78%) | 3.6 | (-93%) |
| Agriculture* | 47.7 | 39.2 | (-18%) | 31.9 | (-33%) | 29.2 | (-39%) | 26.4 | (-45%) |
| Electricity supply | 37.8 | 9.8 | (-74%) | 5.6 | (-85%) | 4.6 | (-88%) | 1.0 | (-97%) |
| Aviation | 35.4 | 33.5 | (-5%) | 30.1 | (-15%) | 29.5 | (-17%) | 22.7 | (-36%) |
| Fuel supply | 31.1 | 15.8 | (-49%) | 8.5 | (-73%) | 5.4 | (-83%) | 1.6 | (-95%) |
| Waste* | 24.9 | 18.8 | (-24%) | 12.3 | (-50%) | 8.3 | (-67%) | 5.1 | (-79%) |
| Non-res buildings | 20.8 | 14.9 | (-29%) | 6.3 | (-70%) | 2.7 | (-87%) | 0.7 | (-97%) |
| Shipping† | 11.2 | 9.8 | (-12%) | 7.7 | (-31%) | 5.4 | (-52%) | 0.5 | (-95%) |
| F-gases* | 7.6 | 3.8 | (-50%) | 2.7 | (-64%) | 2.0 | (-73%) | 1.6 | (-79%) |
| Land use*,‡ | 0.8 | 1.3 | 1.2 | -1.9 | -29.9 | ||||
| Engineered removals‡ | 0.0 | -2.6 | -12.7 | -21.3 | -35.8 | ||||
| Total* | 423.3 | 295.8 | (-30%) | 187.0 | (-56%) | 107.7 | (-75%) | -1.1 | (-100%) |
| Notes: *Provisional 2023 estimates are not made for non-CO2 greenhouse gases, so 2022 data are used for the agriculture, land use, waste and F-gases sectors in which these gases are dominant. The ‘current data’ entry for the total row shows total UK emissions across all sectors as reported in the 2023 inventory. †In Section 7.10, we present changes in shipping emissions compared to a higher DfT estimate of current emissions, which measures international shipping emissions based on the movements of ships on international voyages rather than basing them on sales of bunker fuels in the UK as currently used in the UK’s GHG inventory. It also uses more recent activity data for domestic shipping than is used for UK’s inventory. On that basis, current emissions are higher at 14.2 MtCO2e and the reduction by 2040 is correspondingly larger at 62%. ‡We have excluded the percentage changes in emissions for engineered removals because historical UK engineered removals emissions have always been zero, and for land use because land use contains both emissions sources and sinks. | |||||||||
Emissions in traded sectors
The UK Emissions Trading Scheme (UK ETS) currently covers emissions in parts of the industry, electricity supply, fuel supply, and domestic aviation sectors. The Government has announced that this will be extended to domestic shipping and energy from waste from 2026 and 2028 respectively. Based on this set of sectors, 107 MtCO2e (20%) of total emissions in the Balanced Pathway over the Seventh Carbon Budget period will come from traded sectors (Figure 3.7).
- Traded emissions fall across the pathway, but a small amount of emissions persist out to 2050. This is because of residual emissions which cannot feasibly be decarbonised in our pathway, particularly in domestic aviation and industry.
- The Government is consulting on the possible inclusion of engineered and/or land-based removals in the UK ETS. If these are included, then they would lower the trajectory for traded emissions by the amounts shown. In that case, it will be important to adjust the cap within the UK ETS appropriately to reflect this lower required trajectory for traded emissions.
| Figure 3.7 Traded and non-traded sector emissions in the Balanced Pathway |
 Description: Emissions in the traded sectors fall across the pathway, but a small amount of residual emissions remain in 2050. |
3.3 The Balanced Pathway during the Seventh Carbon Budget period and beyond
3.3.1 Emissions reductions during the Seventh Carbon Budget period
Over half of the emissions reduction to meet the first three carbon budgets came in the energy supply sectors, whereas over three-quarters of what is needed to meet the next three will come from other sectors. This will require emissions reductions to speed up quickly in most other sectors, including surface transport, buildings, and agriculture and land use. This is a crucial prerequisite to be on track to meet the Seventh Carbon Budget.
The Balanced Pathway shows that this trend will need to continue during the Seventh Carbon Budget period, with around half of the further reductions during this period coming in surface transport and buildings, and growing contributions to reducing total emissions coming from aviation, agriculture and land use, and engineered removals. The contributions from these three areas continue to scale up after this period to enable the UK to reach Net Zero (Figure 3.8).
- The Seventh Carbon Budget period will be a key phase of the transition: the electricity supply sector will be largely decarbonised; progress in surface transport will be moving at pace and will need to continue towards completion; and buildings decarbonisation will be ramping up. During this period (from 2038 to 2042), in the Balanced Pathway:
- There will be sufficient low-carbon electricity generation capacity to provide all of the electricity required across the economy, and the transmission and distribution grids will allow this to be used widely across sectors. The remaining emissions in electricity supply will come from marginal generation used for flexibility and during periods of low wind.
- The surface transport transition will be entering its tail, with emissions falling from around 70% below today’s levels at the beginning of the period to nearly 90% by the end. This reflects the fact that around three-quarters of the car and van fleet will be fully electric, and all sales of new cars and vans will be fully electric. The last new diesel HGV will be sold in the early years of this period.
- The residential buildings sector will be undergoing a period of rapid transition, going from below 50% decarbonisation at the beginning of the period to nearly 80% at the end. The last gas boiler will have already been installed, with the vast majority of new and replacement home heating installations using heat pumps.
- In industry, 70% of current industrial emissions will have already been eliminated and most industrial processes will now be electrified. Actions in this sector will focus on addressing the hardest-to-abate remaining industrial sectors.
- By the Seventh Carbon Budget period, agriculture and aviation will be the highest-emitting sectors and engineered removals will be being deployed at scale. During this period (from 2038 to 2042), in the Balanced Pathway:
- Agriculture emissions will be around 40% lower than today. This will have been partly driven by earlier reductions in livestock numbers, which will have released land for trees to be planted. The beginning of the period marks the point at which, in our modelling, the sequestration effect of these trees turns the land use sector from being a small net emissions source to being a net sink. There are large uncertainties around this sector (see Chapter 6), but it is clear that any delay to ramping up tree planting risks delaying this crossover point.
- Aviation emissions will be falling gradually, reaching around 20% below today’s levels by the end of the period. The share of sustainable aviation fuel used will be rising, and the sector will be paying to support engineered removals. These will be operating at scale, with deployment continuing to ramp up to reach 25 MtCO2 by the end of the period. Most of this will likely be BECCS in our pathway, but DACCS will also be starting to operate at scale.
- Across the economy, oil and gas consumption in the Seventh Carbon Budget period will be substantially lower than it is today. This is discussed further in Chapter 10.
| Figure 3.8 Distribution of emissions reductions during each carbon budget period |
 Description: Over half of the emissions reduction to meet the first three carbon budgets came in the energy supply sectors. Looking forward, the majority of reductions to meet future carbon budgets will need to come from other sectors. Around half of the reduction during the Seventh Carbon Budget period will come from surface transport and buildings. |
3.3.2 Emissions and removals in 2050
Balancing residual emissions and removals
In 2050, the main sources of residual emissions in the Balanced Pathway are agriculture and aviation, with smaller contributions from waste, industry, and other sectors. These are offset by negative emissions from land use sinks and engineered removals (Figure 3.9). Total emissions across the agriculture and land use sectors reach Net Zero, providing a clear goal for these sectors.
- Remaining emissions in agriculture and land use are balanced by the carbon sequestered by land-based sinks, including new woodlands, restored peatlands, and energy crops. This gives a clear objective for the land and agriculture sectors: to achieve a net reduction in their total emissions to zero. See Section 7.4 for more discussion of this balance.
- Emissions from the remaining sectors must be offset through engineered removals. Who pays for these removals is a policy choice. The Balanced Pathway largely assumes a ‘polluter pays’ principle, where those sectors with residual emissions, notably aviation, are expected to reduce their net contribution to UK emissions to Net Zero, whether through in-sector emissions reductions or using removals to offset ongoing emissions.[132] As a result, sectors such as aviation are able to reduce their overall contribution to UK emissions to Net Zero by 2050. See Section 7.6 and Section 7.12 for more discussion of this balance.
- In our pathway, negative emissions are reported within the land use and engineered removals sectors. These can be visualised within the sectors in which they occur to illustrate the impact this has on the overall pace of decarbonisation in each area (Box 3.1).
| Figure 3.9 Sources of emissions and negative emissions in the Balanced Pathway in 2050 |
 Description: Net Zero is achieved by balancing remaining emissions from areas that cannot feasibly be decarbonised in our pathway with a combination of engineered and land-based removals. The land-based removals offset residual emissions from agriculture, while the engineered removals offset residual emissions from the remaining sectors. |
| Box 3.1 Pace of sector decarbonisation if including sectoral shares of removals |
Negative emissions are counted in our land use and engineered removals sectors. In some cases, these removals are linked to another sector in our pathway. These links include the consideration of a Net Zero objective for the land sectors in aggregate, our assumption that the aviation sector pays for the share of UK removals required to offset its residual emissions in 2050, and also removals that are physically located in facilities associated with another sector (for example, BECCS used in industrial or energy from waste plants).
|
| Figure 3.10 Sectoral emissions pathways including specified shares of engineered and land-based removals |
 Description: Combining the agriculture and land use sectors and allocating a share of engineered removals to the aviation sector allows these sectors to reach net zero by 2050. The implied combined pace of emissions reduction is slower than in other sectors. |
Emissions balances and the UK’s contribution to global warming
As discussed in Chapter 1, the latest science indicates that the global average temperature likely more or less stabilises after Net Zero CO2 is reached, and at Net Zero GHGs, using a GWP100 metric, temperatures will likely start to reduce, as shorter-lived residual methane emissions are being balanced by long-lived CO2 removal. We find that the same is true of the UK’s contribution to warming (excluding imported emissions), which will have peaked and will likely be starting to decline by the time Net Zero GHGs is reached (Figure 3.11).
- The residual GHG emissions that remain in our pathway in 2050 are a mix of long-lived CO2 (primarily from aviation) and nitrous oxide (primarily from agriculture) and short-lived methane (primarily from agriculture, land use, and waste).[133]
- These are all balanced by removal of CO2, some engineered and some land-based. Overall, this leads to a peak and then decline in the UK’s contribution to global warming by 2050, as continuing shorter-lived methane emissions are offset by removals of long-lived CO2. This is in contrast to the baseline, in which the UK’s contribution to warming would rise steeply.
- Land-based removals carry a higher risk of being less permanent, for instance due to the risk of long-term carbon loss, such as through fire or other climate impacts.[134] This risk is acknowledged in our pathway by using these land-based removals to balance remaining agricultural and land use emissions, which are mostly (around 60%) comprised of shorter-lived methane emissions. This means that, in combination, the agriculture and land use sectors will be contributing to gradually reducing the UK’s contribution to warming.
- By contrast, remaining aviation emissions, which are almost entirely long-lived CO2, are balanced by permanent engineered removals. This would mean that the sector does not contribute to additional CO2-induced warming. However, UK aviation activity has additional non-CO2 effects which likely make up the dominant part of the sector’s contribution to current global warming. We discuss this further in Section 7.6.
|
Figure 3.11 UK contribution to global temperature change in the Balanced Pathway, as a percentage of current long-term greenhouse gas-induced global warming |
|
|

3.4 Emissions in Scotland, Wales, and Northern Ireland
3.4.1 Current emissions in Scotland, Wales, and Northern Ireland
Emissions in Scotland, Wales, and Northern Ireland made up 22% of UK emissions in 2022.
- Scotland: emissions in Scotland made up 9% of 2022 UK emissions. Per-capita emissions in Scotland are slightly higher than the average across the UK. The makeup of Scottish emissions is similar to those in the UK as a whole, with surface transport the highest-emitting sector. Scotland has slightly higher agriculture emissions but slightly lower electricity and fuel supply emissions per capita than the rest of the UK.
- Wales: emissions in Wales made up 8% of 2022 UK emissions. On a per-capita basis, emissions in Wales are nearly double those in the UK as a whole. This is driven by a high contribution from industry, which comprised 27% of total Welsh emissions in 2022. The share coming from electricity and fuel supply is also nearly twice as large as for the UK, while the share from agriculture is slightly larger. Net land use emissions in Wales are negative.
- Northern Ireland: emissions in Northern Ireland made up 5% of 2022 UK emissions. Northern Ireland has the highest per-capita emissions of all UK nations, nearly double those in the UK as a whole. This is primarily due to the large agriculture sector, which makes up 29% of Northern Ireland’s emissions, a higher share than in any of the other nations. Land use emissions are also considerably higher than in the rest of the UK. Across other sectors, the makeup of emissions is similar to that for the UK overall, with a slightly higher share from buildings and a slightly lower share from aviation and shipping.
3.4.2 Contributions to the Balanced Pathway
As part of our analysis to develop the Balanced Pathway, we have assessed the emissions reductions that can be delivered in Scotland, Wales, and Northern Ireland. We have accounted for differences in current and projected trends across the three nations as far as possible.
- Emissions reductions in Scotland, Wales, and Northern Ireland contribute around one-fifth of the total UK-wide emissions reduction in the Balanced Pathway in 2040. The total contributions to emissions reduction in each nation are similar to their shares of current emissions.
- As our Seventh Carbon Budget target advice is to the UK Government, advice specific to Scotland, Wales, and Northern Ireland (including emissions pathways and detailed assessments of sectoral contributions) will be given in their respective Target Advice reports, which are due to be published in 2025.
3.4.3 Key differences in sectoral emissions pathways
In all sectors, baseline starting points have been aligned to the latest available data on emissions and energy consumption for each devolved administration. In addition, we have included nation-specific assumptions where these are expected to drive significant differences in the level or pace of change compared to UK-wide averages. As a result, the makeup of emissions reduction in each nation varies, with differing contributions according to the sectoral makeup of each nation’s emissions and differing rates of decarbonisation across sectors. The key differences in current emissions levels and sectoral makeup are set out in Section 3.4.1 above. The key differences in the pace at which each sector decarbonises in our pathway are:
- Surface transport: surface transport emissions fall more slowly in Wales and slightly more slowly in Northern Ireland than in the UK pathway. This is due to differences in assumptions around electric vehicle uptake and modal shift.
- Average vehicle ages are slightly higher in Wales and slightly lower in Scotland, which we reflect in our assumptions around the pace of fleet turnover to account for differences in vehicle purchasing patterns in each nation. Electric cars made up 10% of new sales in 2023 in Scotland, 8% in Wales and 11% in Northern Ireland, compared to 16% for the UK. This results in lower sales shares in the devolved administrations, although the gaps close gradually as all nations are assumed to reach 100% of new sales being electric by 2035.
- Our assumed levels of modal shift vary in line with the split between urban and rural geographies in each nation. In particular, this results in slightly smaller reductions in vehicle kilometres in Scotland and Northern Ireland than UK-wide.
- Residential buildings: Northern Ireland sees a faster rate of decarbonisation as it has a higher proportion of homes off the gas grid, using oil for heating. Replacing these with heat pumps delivers relatively high levels of emissions reduction, meaning that low-carbon heating becomes cost effective sooner within our modelling in such premises.
- Industry: around three-fifths of industrial emissions are modelled at the site level. This means that our modelling, in part, chooses the mix of decarbonisation options in each nation based on the industrial sites located there. Wales sees very steep decarbonisation at the beginning of our pathway due to the closure of the blast furnaces in Port Talbot.
- Agriculture and land use: our analysis takes into account the suitability of land in each nation for different uses, as well as the substantial differences in the amount and type of agriculture taking place.
- While the pace of agriculture decarbonisation is similar across all nations, the magnitude of livestock emissions in Northern Ireland and (to a lesser extent) Wales and Scotland means that the take up of low-carbon farming practices and measures that reduce herd sizes will have more of an effect on total emissions in these nations.
- Scotland delivers a high share of total UK land-based removals. This is because tree planting is shared proportionally across England, Scotland, Wales, and Northern Ireland based on the availability of land suitable for planting, and there is proportionally more land suitable for tree planting in Scotland than in the other nations. This means that 39% of the trees planted in our pathway between 2025 and 2050 are in Scotland.
- Wales has limited arable area appropriate for planting energy crops and lacks the infrastructure and energy for using the biomass they produce. We have therefore not included planting of energy crops in Wales, allocating them to England when possible.
- Electricity supply: the modelling for electricity supply is plant-specific and considers existing power plants. In particular, Northern Ireland is modelled as part of the all-island of Ireland system. Renewables capacity is distributed across the UK based on resource availability and other constraints, such as seabed availability. Scotland has strong suitability for renewables, particularly wind power.
- Aviation: we do not assume any demand management for domestic flights to or from Northern Ireland or the Scottish islands, to not adversely affect connectivity to the UK mainland. This leads to a slightly slower reduction in aviation emissions in Northern Ireland and has a very small effect on emissions in Scotland.
- Other sectors: there are also smaller differences in assumptions in other areas. We will describe our pathway for each nation, including our approach to allocating engineered removals between nations, in our advice reports to each devolved administration.
Chapter 4: Costs and investment in the Balanced Pathway
Introduction and key messages
This chapter presents the costs and benefits accompanying the Balanced Pathway. It brings together sector-based modelling to estimate the investment and operating costs required to meet the pathway across the whole economy, quantifies non-monetary co-impacts of investment, and sets out the split between public and private spending.
Our key messages are:
- Between 2025 and 2050, an average investment of £26 billion per year will be needed in the Balanced Pathway, peaking in the first half of the transition. Key areas for investment include expanding the electricity system to account for higher rates of electrification and improving buildings to install low-carbon heating systems.
- This investment will be offset by savings of around £22 billion per year on average in operating costs, from improved efficiency and higher levels of low-cost renewable energy.
- Savings from more efficient low-carbon technologies will begin to outweigh investment costs during the Seventh Carbon Budget period (2038 to 2042) and continue to grow towards 2050. The costs of key low-carbon technologies also fall over time.
- Given the balance of investment costs and operating savings, the overall cost of meeting the Balanced Pathway is estimated to be around £4 billion per year, on average between 2025 and 2050, relative to the baseline. This is around 0.2% of the annual GDP expected over the same period.
- The private sector can provide the majority of the required investment, as long as the right incentives are in place. There is also a role for public spending, especially in meeting the one-off costs of building improvements and to manage the distribution of costs and savings. But the Government has considerable flexibility on the public sector share: it is for them to decide this.
4.1 Estimating costs in the Balanced Pathway
4.1.1 Our approach to costs and benefits in the Balanced Pathway
To estimate the cost of the Balanced Pathway, we use Green Book-aligned social costs. These reflect the cost of the transition to the economy as a whole, rather than to certain individuals or groups. All costs and benefits are additional, relative to our baseline of no further decarbonisation action in the UK.[135] Our cost analysis can be categorised into:
- Whole-economy costs. These bring together sector-based analysis to produce an economy-wide view of the investment and operating costs and cost savings required to deliver the Balanced Pathway.
- Co-impacts. Some costs and benefits of delivering the Balanced Pathway are less tangible. For example, the shift from petrol and diesel vehicles to electric vehicles (EVs) reduces air pollution, which improves health outcomes. These are also considered a social cost (or benefit) and are presented separately to our whole-economy costs, as well as in more detail in Chapter 8.
Our headline figure for the cost of the Balanced Pathway presents the whole-economy cost (excluding co-impacts). Our estimates do not include an assessment of the avoided loss and damage from addressing climate change (see Section 4.1.5).
4.1.2 Our approach to estimating whole-economy costs
We present our whole-economy costs using three measures:[136]
- Investment and operating costs. Our headline measure is made up of additional capital expenditure (investment) and additional operating expenditure (operating costs) to form an economy-wide view of the net additional cost we expect to be required to meet the Balanced Pathway.
- Investment costs include the in-year premium cost paid for low-carbon assets (in our pathway) compared to the high-carbon alternative (in our baseline). For example, in the surface transport sector, the investment costs include the net cost or cost saving of EVs compared to fossil fuel vehicles. They also include the cost of EV charge points, and the labour required to install them.
- Investment costs are accounted for in the years of construction and do not include a cost of capital (cost of borrowing). This is consistent with capital cost accounting in the Green Book and the ONS National Accounts (which determine GDP).[137];[138]
- We also include optimism bias for risky capital projects, in line with the Green Book.
- Operating costs include the ongoing expenses incurred to maintain and run assets. These usually consist of maintenance and fuel costs. For example, operating costs in surface transport would consist of the difference between the electricity and maintenance costs for EVs and the fuel and maintenance costs for fossil fuel vehicles. Since these are social costs, we do not include taxes or subsidies (including fuel duties and VAT). Therefore, these operating costs will not align to the running cost that is paid by a vehicle owner.
- Where costs are aggregated between sectors, costs that pass from one sector to another are only included once. For example, where electricity supply and surface transport costs are combined, the cost of the electricity used for EVs is included in the surface transport sector and excluded from the electricity supply sector. This ensures that there is no double counting in our aggregate costs.
- Annualised resource costs. From the perspective of businesses and households, capital projects are often not paid for in-year but financed across the lifetime of the investment. This measure smooths capital spending and combines this with in-year operating costs.
- This process more closely resembles the flow of capital spending as it would appear in company profit and loss accounts.
- We annualise additional capital expenditure using a 3.5% social discount rate, in line with Green Book discounting practices.
- Average abatement costs. To assess the relative cost effectiveness of measures in the Balanced Pathway, we compare the cost per unit of emissions reduction (£/tCO2e) for different measures.
- Abatement costs are calculated by dividing the net present value of a unit’s lifetime cost by the net present value of its lifetime abatement (both discounted at the social discount rate of 3.5%). Generally, if a measure’s abatement cost is lower than the carbon value (which represents the value UK society places on avoiding emitting 1 tCO2e), then we assume that this is cost effective and can potentially be included in our pathway.[139] However, we also consider a range of other constraints to determine whether a measure’s abatement cost is included (see Chapter 2).
- Cost effectiveness judgements for deciding whether or not a measure can be included in the pathway are generally based on the abatement cost of an individual new unit. However, in this costing analysis we present in-year average abatement costs, which combine the abatement costs of all units which are operating in that year. For example, the average abatement cost of EVs in 2050 is the combined abatement cost of EVs which are made or driven in 2050.
- As with our other cost metrics, abatement costs are additional to a baseline of no further decarbonisation action. Therefore, a negative abatement cost signifies that this measure is cheaper than the alternative in the baseline.
4.1.3 Our approach to estimating the cost of co-impacts
We model co-impacts of the Balanced Pathway for households and wider society. They are briefly summarised here and discussed in detail in Chapter 8.
Co-impacts are presented as a financial value to society, valued in line with Green Book appraisal guidance. Our analysis only includes co-impacts where there is sufficient evidence available, and where the impact is both feasible and material to model. As a result, this is not a comprehensive assessment of all co-impacts but an estimate of the most significant and most well-evidenced co-impacts only.
4.1.4 Our approach to estimating fiscal impacts
We estimate a range of possible outcomes for public expenditure, based on illustrative, high-level, policy options. The range is intentionally wide, reflecting the considerable discretion government has in deciding policies. We take additional capital expenditure as a starting point, and assess what proportion of this in each year, at an upper and lower estimate, would be public expenditure. We also include some operating costs that might fall to public expenditure.
4.1.5 Costs of doing nothing
The additional costs we present are relative to a baseline which assumes no further climate policy action compared to today. We have not taken into account the costs of loss and damage that would result from failing to address climate change.
UK progress on climate change in our Balanced Pathway does not guarantee global progress on reducing emissions, so we cannot assume that the costs that come with climate change are avoided in the Balanced Pathway and included in the baseline. As discussed in Chapter 9, the impacts on UK GDP of unaddressed climate change are likely to be higher than the whole-economy costs presented below.
4.2 Costs in the Balanced Pathway
4.2.1 Whole-economy costs
Whole-economy cost drivers
Whole-economy costs are an output of our emissions pathway. The level of cost in each year and the distribution of costs between years are predominantly driven by the following factors:
- Technology costs: upfront capital costs in the pathway are often higher for low-carbon technologies than for high-carbon alternatives. In many sectors, technology costs fall over time due to technological improvements, innovation, learning rates, and economies of scale.
- Energy costs: operating costs in many sectors are driven by the cost of energy and the quantity of energy required. Many of the measures in the Balanced Pathway switch from fossil fuels to electricity. Electric technologies are innately more efficient, meaning they use less energy than the high-carbon alternative.
- One-off costs of building improvements: installing low-carbon heating will often require a one-off improvement to buildings. Many of the UK’s homes have been designed around gas central heating. Buildings will need to be improved to be suitable for heat pumps, for example by rerouting pipe work. Once complete, the work will not need to be repeated in heat pump replacement cycles.
- Timing of deployment of low-carbon technologies: varying deployment rates can cause in-year additional capital costs to appear volatile. Deployment of low-carbon technologies varies between sectors, depending on when these become cost effective, sector-specific delivery constraints, and replacement cycles. For example, renewable energy is deployed quickly, increasing electricity capital expenditure in the 2020s and 2030s.
- Levels of demand: in some areas, there are differences in levels of demand between the pathway and the baseline. For example, energy efficiency measures in buildings reduce subsequent energy demand. These changes have implications for capital and operating costs.
Investment and operating costs
Delivering the Balanced Pathway will require significant upfront capital investment in low-carbon technologies, including renewables, heat pumps, and EVs. However, this investment will generate a return in operating savings in later years. When combining the required investment and operating savings across the economy, we expect the average cost of the Balanced Pathway to be £4 billion per year between 2025 and 2050 (Figure 4.1). This translates to around 0.2% of GDP (using Office for Budget Responsibility (OBR) estimates).[140]
- Over the 25-year period, we expect the total net cost (investment less operating savings) to be around £110 billion. This cost is front-loaded into the first half of the transition period, peaking at an annual net cost of £33 billion in 2029.
- Due to falling technology costs and increasing operating savings, the net cost becomes cost saving during the Seventh Carbon Budget period (around 2041), leading to a net saving of around £35 billion in 2050.
| Figure 4.1 Additional capital expenditure and operating costs in the Balanced Pathway, compared to the baseline |
 Description: Additional costs in the Balanced Pathway are front-loaded, peaking in 2029. Capital costs are offset by operating savings in later years, with the pathway becoming a net cost saving overall in 2041. Source: Climate Change Committee (CCC) analysis. Notes: (1) In-year costs are in 2023 prices. (2) Capex is additional capital expenditure and opex is additional operating expenditure. Both are relative to a baseline of no further decarbonisation action. (3) The ‘other’ category includes fuel supply, aviation, shipping, agriculture, land use, industry, waste, engineered removals and F-gases. (4) Capex and opex are accounted in the years of construction and operation respectively, in line with Green Book practices. In this aggregation of costs, we adjust for double counting by removing the cost of electricity and low-carbon fuels from the sectors which produce them and maintaining this cost in sectors which consume them. |
Investment in the Balanced Pathway
On average, meeting the Balanced Pathway will require investment of around £26 billion per year into low-carbon technologies and infrastructure (Figure 4.2). This is equivalent to around 0.9% of annual GDP. Investment at this scale is likely to deliver a range of benefits beyond Net Zero, including boosting productivity and supporting new jobs (see Chapter 9).
- Investment of around £26 billion per year would boost the UK’s annual economy-wide capital spending from 2022 levels to around 19% of GDP. This remains below the OECD average (22% of GDP in 2022).[141]
- Investment ramps up quickly in the late 2020s and 2030s, peaking at around £46 billion in 2029. It begins to fall in the late 2030s and 2040s, as deployment slows and the costs of low-carbon technologies fall.
- While we have not explicitly modelled investment costs after 2050, we can reasonably expect they would continue to fall, as most one-off structural investment is spent before 2050.
- For the energy system, the net capex line in Figure 4.2 only includes the investment required to decarbonise the current system. The cost of expanding the system to meet additional demand for electricity and low-carbon fuels is already accounted for in our operating cost chart (Figure 4.3). This ensures we do not double count the same costs. However, it is useful to understand the total additional investment that needs to be financed, before taking account of double counting. We include this total additional investment in the financing requirement line (noting this financing requirement includes both the investment set out in Figure 4.2 and some costs that appear in our assessment of operating costs shown in Figure 4.3).
The main drivers of additional capital expenditure for key sectors are set out below.
- Electricity supply: Figure 4.2 shows the investment that will be required to decarbonise the current electricity system. This is front-loaded in the 2020s and 2030s and becomes negative in 2044 as the capital cost of renewables falls below the cost of gas generation in the baseline.
- Buildings: significant investment will be required in the buildings sector throughout the transition, primarily due to the upfront costs of low-carbon heating installation and making energy efficiency improvements. Much of this investment will be on one-off structural changes (for example, rerouting pipes in existing homes), which will not need to be repeated.
- Surface transport: investment costs are primarily driven by charging infrastructure and the costs or savings from buying EVs. Between 2026 and 2028, electric cars and vans reach price parity with petrol and diesel vehicles. After this point, new cars and vans generate a capital saving compared to our baseline, though new heavy goods vehicles remain a capital cost.
- Aviation and shipping: due to reduced demand for flying between our baseline and Balanced Pathway, net investment in the aviation sector is negative, while investment into SAF is accounted for in aviation operating costs. Investment costs for shipping consist of efficiency measures and low-carbon fuel engines for ships.
- Engineered removals: investment in the removals sector includes bioenergy with carbon capture and storage (BECCS) plants and technology, and costs associated with direct air captured CO2 for storage and producing synthetic fuels used in aviation and shipping.
- Industry and fuel supply: investment in these sectors is made up of industrial processes switching to electrification and hydrogen. It also includes the addition of carbon capture and storage (CCS) processes, and decommissioning of existing fossil fuel production facilities. The cost of producing low-carbon fuels is captured in the operating costs (Figure 4.3).
- Agriculture and land use: investment into natural capital includes woodland creation (including planting, establishment, and fencing) and peatland restoration. Investment into agriculture consists of low-carbon machinery and soil and livestock measures.
|
Figure 4.2 Additional capital expenditure in the Balanced Pathway, compared to the baseline |
|
|

Key technology costs
Investment costs are, in part, driven by the cost of low-carbon technologies. In recent years, we have seen the cost of low-carbon technologies fall rapidly in the UK as markets have begun to establish supply chains and benefit from learning-by-doing and economies of scale. We expect these trends to continue in the Balanced Pathway, as low-carbon technologies are rapidly deployed in the early years of the transition. Our technology unit cost assumptions are set out in Table 4.1.
| Table 4.1 Unit costs for key technologies |
|||||
|---|---|---|---|---|---|
| Sector | Technology | Technology cost in the Balanced Pathway | % reduction from 2025 to 2050 | ||
| 2025 | 2040 | 2050 | |||
| Electricity supply | Onshore wind | £1,410/kW | £1,260/kW | £1,200/kW | 15% |
| Offshore wind | £1,840/kW | £1,300/kW | £1,120/kW | 39% | |
| Solar PV | £560/kW | £310/kW | £280/kW | 50% | |
| Nuclear | £12,920/kW | £10,330/kW | £10,330/kW | 20% | |
| Gas CCS | £1,790/kW | £1,560/kW | £1,560/kW | 13% | |
| Surface transport | Medium electric car | £23,160 | £18,580 | £18,050 | 22% |
| Electric van | £29,490 | £24,700 | £23,930 | 19% | |
| Electric small rigid HGV | £119,560 | £81,270 | £78,610 | 34% | |
| Residential buildings | Air source heat pump | £10,900 | £8,860 | £7,520 | 31% |
| Ground source heat pump | £11,200 | £8,790 | £7,340 | 34% | |
| Heat network | £12,120 | £9,110 | £7,430 | 39% | |
| Description: The costs of low-carbon technologies in the Balanced Pathway are falling between 2025 and 2050. Source: CCC analysis. Notes: Electricity supply technology costs are presented here in terms of £ per unit of capacity, not £ per unit of energy generation, so will differ from technology costs presented in the electricity supply sector. Heat pump costs consist of a fixed cost component for labour and materials (including the heat pump itself), and a variable cost component which increases these costs depending on system size. We use an average system size of 12 kW. These do not include ancillary costs such as hot water tank or radiator upgrades. The heat network cost includes the cost of connecting a 12 kW household to a heat network and the household heat interface unit. |
|||||
Operating costs in the Balanced Pathway
Operating costs in the Balanced Pathway tend to be lower than in our baseline, saving the economy £22 billion on average each year between 2025 and 2050 (Figure 4.3). In terms of GDP, this saving amounts to around 0.7%.
- The main driver for reduced operating costs in our pathway is improved efficiency from electrification. More efficient electrified technologies across sectors reduce energy demand, therefore reducing running costs. Electricity itself is also produced with lower operating costs, as renewable technologies utilise free sources of energy from wind and solar.
- We expect investment in the Balanced Pathway to generate net operating savings immediately, starting at around £2 billion in 2025 and growing each year to peak at a net saving of around £33 billion in 2050. Similarly to investment costs, we expect these savings to continue to rise beyond 2050, as efficiency continues to improve and energy costs fall.
- The impact of these savings on household bills is affected by policy levers, such as taxes and subsidies. Chapter 8 discusses the distributional effects of our costing outcomes.
The main drivers of these costs in key sectors are discussed below.
- Electricity supply: operating costs in this sector are driven by fuel and maintenance costs. Fuel costs generate savings compared to the baseline, due to the dominance of zero-fuel-cost renewable energy in the pathway electricity technology mix.
- Surface transport: this sector produces the largest share of operating cost savings in our pathway. Around 86% of the savings in this sector can be attributed to cars and vans switching from fossil fuel vehicles to more energy efficient EVs. These vehicles have lower fuel costs and reduced maintenance costs since they have fewer moving parts.
- Buildings: energy-saving measures and the installation of heat pumps in buildings generate operating savings of £1.3 billion in 2025, growing to £5.5 billion in 2050. Savings are primarily driven by energy efficiency measures in residential buildings.
- Aviation and shipping: we expect demand in aviation to grow more slowly than in the baseline. This, combined with efficiency gains in aviation and shipping, drives operating savings in the 2020s and 2030s. This is counteracted in later years by the uptake of more expensive low-carbon fuels, including SAF and low-carbon shipping fuels such as methanol and ammonia.
- Engineered removals: the operating cost of the removals sector, driven by energy and maintenance costs in direct air carbon capture and storage (DACCS) and BECCS plants, is positive throughout the transition, reaching £4.7 billion in 2050.
- Industry: energy efficiency measures and increased electrification of industrial processes generate operating savings. This is balanced by the increased operating cost associated with hydrogen and CCS.
- Agriculture and land use: electrification of low-carbon machinery generates operating savings for agriculture, while land use changes incur minor operating costs due to management of woodlands, peatlands, and energy crops.
| Figure 4.3 Additional operating costs in the Balanced Pathway, compared to the baseline |
 Description: Due to efficiency of electric technologies and lower cost of electricity, additional operating costs in the Balanced Pathway are negative and cost savings grow over time. Source: CCC analysis. Notes: (1) In-year costs are in 2023 prices. (2) Operating costs are accounted for in the year they are spent. (3) Double counting is removed between the capital and operating costs of sectors that produce energy (electricity and fuel supply, plus the shared costs for direct air capture infrastructure used for synthetic fuel production, which are included in our engineered removals costs) and the operating costs of sectors that use that energy. This cost is kept within the end-use sectors and removed from energy-producing sectors. |
Annualised resource costs
The whole-economy annualised resource cost amortises (spreads forward into annual payments) additional capital expenditure across the lifetime of the asset and combines this with in-year additional operating costs (Figure 4.4). In absolute terms, the annualised resource cost of the Balanced Pathway peaks at around £10 billion, which equates to around 0.3% of GDP.
- This produces a different view of whole-economy costs to Figure 4.1, where investment is paid in-year. When annualised, aggregated investment costs are spread forward, peaking in 2045 when in-year operating savings are higher, rather than 2029. Therefore, the peak annualised resource cost as a percentage of GDP is lower than our peak in-year whole-economy cost estimate.
- Between 2025 and 2030, immediate operating savings outweigh the annualised investment. However, as investment extends to areas with higher abatement costs, this cost begins to rise. In the 2040s, front-loaded investment begins to be paid back, reducing the annualised resource cost towards 2050.
- We expect significant cost savings in surface transport and electricity supply (Figure 4.5). Other sectors, including buildings and engineered removals, will maintain an additional cost until 2050.
|
Figure 4.4 Annualised resource capital and operating costs, and annualised net costs as a proportion of GDP |
|
|

| Figure 4.5 Annualised resource costs in key years |
 Description: By 2050, some sectors (including electricity supply and surface transport) have cost saving annualised resource costs, while others (including buildings, engineered removals, and fuel supply) remain a positive cost. Source: CCC analysis. Notes: (1) The data labels represent the annualised resource cost of that sector as a proportion of GDP in 2050. (2) Double counting is removed between the capital and operating costs of sectors that produce energy (electricity and fuel supply, plus the shared costs for direct air capture infrastructure used for synthetic fuel production, which are included in our engineered removals costs) and the operating costs of sectors that use that energy. This cost is kept within the end-use sectors and removed from the energy-producing sectors. |
Average abatement costs
The whole-economy cost metrics discussed above combine all measures in the Balanced Pathway. In this section, we look at the cost of individual measures relative to their abatement potential (their abatement cost). Our pathway includes a range of measures with a range of abatement costs (Figure 4.6).
- By 2050, measures which are cost saving compared to our baseline have negative abatement costs. In particular, abatement through the purchase of electric cars and vans and through decarbonisation of the electricity system is cost saving compared to high-carbon systems today.
- Abatement costs improve from 2025 to 2050. Technological improvements to abatement potential and reductions in the cost of low-carbon technologies have a downwards impact on abatement costs between 2025 and 2050. For example, abatement costs for electric cars and vans fall from £220/tCO2e to -£210/tCO2e over the 25-year period.
- Engineered removals and low-carbon fuels are the least cost-effective measures included in the Balanced Pathway. Due to high capital costs and energy intensities of these measures, their abatement costs in 2050 remain high compared to other measures operating in the economy. One of the most expensive measures operating in 2050 is SAF which costs around £260/tCO2e.
- All measure groups are cost effective against the central carbon value, which rises to £409/tCO2e in 2050.[142] Once aggregated, all the measures in the Balanced Pathway are cost effective relative to the carbon value in this year.[143]
The order of measures in this chart is not the only consideration for when measures should be rolled out in the Balanced Pathway. Our pathway also accounts for feasibility constraints and dynamic cost effectiveness. More discussion of how abatement costs are used to prioritise actions in our pathway can be found in Chapter 2.
|
Figure 4.6 Cross-economy average abatement costs in 2050 |
|
|

Differences in costs compared to our Sixth Carbon Budget advice
Our costing estimates are lower than those from our Sixth Carbon Budget advice, in which the annualised resource cost was estimated to be around 0.5–0.6% of GDP over the period from 2030 to 2050. There have also been changes to our estimates of whole-economy investment and operating costs. The key differences in our costing estimates between our previous advice and what we present here are:
- Different time periods. Costs and benefits incurred between 2020 and 2024, included in our Sixth Carbon Budget report, are now in the past. Upfront costs from this part of the transition have been spent.
- Refined assumptions. We have updated our underlying assumptions to align with the latest evidence. Many of these changes have influenced our cost profile, in both inflationary and deflationary directions. For example, we have improved expectations of the falling cost of EVs compared to petrol and diesel cars, bringing forward our assumption on years of price parity. We have also tempered our expectation of the efficiency improvements of heat pumps, reducing potential operating savings.
- Methodological changes. In our Sixth Carbon Budget advice, we assumed that low-carbon technologies already in the baseline would be replaced with high-carbon alternatives when they reach the end of their lifetimes. Since low-carbon measures are becoming more mainstreamed, we now assume that the stock of low-carbon technologies that exist today (primarily renewable energy and EVs) generally remains constant in our baseline over time.
4.2.2 Co-impacts
Quantified co-impacts are estimated to provide £2.4–£8.2 billion per year in net benefit by 2050, largely due to positive health impacts.[144] We present a range as co-impacts are affected by whether there is a rebound effect as a result of the transition to EVs (an increase in driving due to lower driving costs), which is uncertain. Chapter 8 discusses co-impacts in more detail.
- The largest quantifiable co-impact of our pathways is the health benefit related to improvements in outdoor air quality due to the switch to low-carbon heating, electric cars, and modal shift.
- Other quantified co-benefits include better insulated and less damp homes and health improvements from a reduction in average meat and dairy consumption. The main quantified cost is the increased travel time on public transport.
We set out the detail on co-impacts in Section 8.4.
4.3 Fiscal impacts
The Climate Change Act requires that we consider ‘fiscal circumstances, and in particular the likely impact of the decision on taxation, public spending and public borrowing’.
4.3.1 Public expenditure
The specific mechanisms used to support the transition are a choice for government. Market mechanisms can be used to ensure that the private sector brings forward the majority of the required investment, particularly in the later years of the transition. There is also a case for public spending in some areas, especially the upfront costs of buildings improvements. Our citizens’ panel supported taxpayer-funded grants here, which is discussed in Chapter 8.
- We have estimated a range of possible outcomes for public expenditure, based on illustrative, high-level policy options. The range is intentionally wide, reflecting the considerable discretion government has in deciding policies. Some areas, such as the public sector’s own buildings, inevitably fall to public expenditure.
- We anticipate public spend being higher early in the transition, to drive investment in technologies at their early stages and to foster innovation and commercialisation of early-stage technologies. We expect this to reduce in later years as the market delivers the remaining required investment.
- We estimate that for the Balanced Pathway, approximately £6–£23 billion of additional capital investment would be publicly funded in 2035, falling to £1–£4 billion in 2050 (Figure 4.7). Public spend per year in our estimates never exceeds 2% of total managed public expenditure.[145]
- In our estimates, the private sector funds between two-fifths and over nine-tenths of additional capital expenditure from 2025 to 2050 (varying by year and by upper and lower estimate).
- Our estimates are similar to the OBR’s estimates of public spend, which were based on our Sixth Carbon Budget pathway. The OBR found that public debt in an unmitigated climate change scenario is significantly higher than public debt as a result of action on climate change by 2050.[146]
- Policy support will be critical to support households to overcome upfront capital costs for low-carbon heating and some energy efficiency measures. Initial support for upfront capital investment for areas such as CCS and industrial electrification will also be required.
- Support for low-carbon heating for homes is the largest driver of public spend in our upper estimate, averaging £6 billion per year from 2025 to 2035. However, if the Government were to move quickly to implement policies to support market scale-up, set a phase-out date for gas boilers, and introduce a point-of-sale requirement from 2030, public spend in our lower estimate could be lower at close to £1 billion on average per year from 2025 to 2035.
- Our distributional modelling discussed in Chapter 8 has public expenditure implications for two illustrative policy packages, specifically for residential buildings and transport. These fall within the ranges set out below.
- Some policy support will be needed to enable businesses to transition, including farmers and small businesses and support for woodland creation and peatland restoration. Initial upfront support for capital investment into industrial decarbonisation, CCS, and removals (on average between £1–£3 billion per year in total from 2025 to 2035) is included in our estimates but this reduces significantly from 2036.
- Classification of the costs of future nuclear power stations is a matter for the Office for National Statistics.[147] It is possible that Sizewell C and subsequent projects could be classified as public expenditure. This would represent an additional £4–£6 billion per year in the 2030s in our Balanced Pathway. Once generating, nuclear power stations would then produce public sector receipts offsetting these costs, or might be reclassified outside of public expenditure. Pending any decision on classification, these costs are not included in our estimates for public expenditure.
- Government might choose to pair Net Zero objectives with wider objectives and overall spend more on certain objectives, such as nature restoration or insulation for fuel poor homes. There may be overlaps or reductions in spending in other areas.
|
Figure 4.7 Estimated range of public expenditure |
|
|

4.3.2 Tax receipts
Environmental taxes are a relatively small proportion of total UK tax receipts. The Government will need to make plans to address the loss in revenue from fuel duty.
- Environmental taxes that raise government revenue represented 5% of total UK tax receipts in 2023, consisting mostly of fuel duty (47%), vehicle excise duty (15%), renewable obligations (14%), the UK Emissions Trading Scheme (11%), and air passenger duty (7%).[148]
- Without an increase in the rate of fuel duty, we expect to see fuel duty tax receipts decline rapidly, leading to a gap in revenue for the Exchequer. If fuel duty remained at the same rate as today, falling demand for fuel for vehicles would result in revenues being about a third lower in 2030 than levels in 2023 (£25 billion).
- We have not estimated what the likely impact of our pathway is on tax receipts across other sectors. If we assume a broad continuation of policy commitments, most changes in tax receipts will be gradual.
Environmental taxes such as carbon taxes could be used to incentivise households and businesses to shift towards low-carbon technologies. This could leverage additional revenue in the short term, although if taxes are effective in shifting behaviour, then this revenue would not last.
Chapter 5: Delivering the Seventh Carbon Budget
Introduction and key messages
This chapter discusses what the Balanced Pathway means in practice, setting out a collection of indicators of the changes required and discussing our recommendations for how to deliver them.
Our key messages are:
- Delivery of the Balanced Pathway requires a rapid ramp-up in roll-out of a range of low-carbon technologies and a sustained shift away from high-carbon activities. A combination of markets, government support, and choices by the public and businesses are needed to ensure delivery.
- Many of the key technologies are already well-established and are ready to deploy and scale. Where the way forward is clear, the task for government and businesses is to deliver it. The pace of technology roll-out and sustained shifts in behaviour are comparable with transitions which have happened in the past in the UK.
- Low-carbon technology uptake is typically expected to follow familiar ‘S-curve’ dynamics, whereby roll-out accelerates quickly as production scales up and prices fall. Prices in many areas (for example, batteries and solar panels) have fallen rapidly and are now lower than ever.
- Sustained shifts away from high-carbon activities are important where low-carbon technologies are not available or will take longer to develop. These can be achieved by ensuring that alternative low-carbon choices are accessible and affordable.
- 43 priority recommendations to the Government support delivery of our recommended Seventh Carbon Budget. There are seven themes underpinning them:
- Electricity needs to be cheaper, to incentivise a switch to low-carbon electric technologies across many sectors.
- Barriers must be removed, including in planning, consenting, and regulatory funding, to enable grid connections and rapid deployment of low carbon technologies.
- Government must provide certainty, by providing timely decisions on new technology choices to provide confidence to consumers and investors.
- Households need to be supported to install low-carbon heating to address barriers presented by upfront costs, especially in the case of low-income households.
- Businesses need clarity on the balance between government support and market mechanisms, so they can make the transition to low-carbon operations.
- Growing workforces will be a critical enabler of some of the changes that are needed. A plan is required to enable this and to support workers in areas that will be affected.
- An engagement strategy is needed to provide clear information to households and businesses, to help them understand the choices available to them.
5.1 Delivery indicators in the Balanced Pathway
5.1.1 Principles of progress monitoring
Effective mechanisms to monitor progress are essential to allow barriers and risks to delivery of the UK’s emissions targets to be identified and addressed. This requires a set of indicators that set out what is needed and enable reliable early assessment of progress towards achieving this. Further details on our approach to progress monitoring can be found in our 2022 Monitoring Framework.
5.1.2 Key indicators
In this section, we present the key indicators across the economy, with more detail provided for some sectors in Chapter 7. These indicators set out the key real-world changes that deliver the emissions reductions in our pathway. We have grouped the indicators into the following categories:
- Roll-out of low-carbon technologies and land-based actions. Low-carbon technologies and land-based actions deliver a large share of the emissions reduction in the Balanced Pathway. The rate at which this occurs will be crucial. We consider two categories:
- Quantity-based indicators. These set out the pace of roll-out. In most cases, this is expected to follow established trends of technology transitions, such as ‘S-curves’ whereby roll-out accelerates quickly as production scales up and prices fall. We present these indicators in terms of the impact of technology roll-out on the makeup of the overall stock, as this is what drives the required reductions in emissions. For progress monitoring, especially in the early phase of deployment, tracking annual roll-out rates may give clearer insight into progress.
- Price-based indicators. These show the changes in prices that influence roll-out rates. Prices of many low-carbon technologies are falling quickly, making them rapidly more cost effective and appealing for consumers and businesses. It will be important to monitor these trends to identify any areas where cost could pose a barrier to roll-out.[149]
- Demand for high-carbon activities can be reduced both through measures to enable sustained low-carbon choices by consumers and businesses and through improvements to efficiencies. These indicators set out the key changes in our pathway, in terms of either a decrease in high-carbon activity or a corresponding increase in a low-carbon one. To monitor progress, it will also be important to track delivery of key enabling actions that make low-carbon choices easier, more attractive, and more affordable.
Roll-out of low-carbon technologies and land-based actions
In this section, we present deployment trajectories and projected price trends for the key low-carbon technologies and land-based actions that feature in our pathway. As discussed in Chapter 3, electrification across a range of sectors delivers the majority of the emissions reduction required to meet the Seventh Carbon Budget, with important supporting roles for low-carbon fuels and carbon capture and storage (CCS), nature, and engineered removals. We focus this collection of headline indicators on these areas.
- Many of these key technologies (for example, electric cars and renewables) are already mature technologies with established markets in the UK, ready to deploy and scale. Others, for example heat pumps, are mature technologies globally but require a significant scale up of UK skills and supply chains. Once achieved, we have confidence roll-out can grow rapidly.
- Our pathway also relies on some technologies that are still in their infancy, but which will become crucial later on in the transition. This applies to the development of low-carbon fuels, CCS, and engineered removals. There will be different expected timescales associated with the ramp-up of each type of technology. Section 5.2.1 discusses this in more detail.
Our key indicators show the rate at which these roll-outs progress and the pace of cost-reductions in our pathway, as well as how these compare to observed historical trends (Figures 5.1 and 5.2).
Electricity
Electric options are now the clear choice in many areas of surface transport, buildings, and industry. Expansion of low-carbon electricity supply, through deployment of renewables and grid infrastructure upgrades, will be critical to enable the roll-out of these technologies.
- Low-carbon electricity supply: offshore and onshore wind, together with solar, provide the bulk of generation in the future electricity system in the Balanced Pathway.
- Offshore wind: offshore wind grows from 15 GW of capacity in 2023 to reach 88 GW by 2040 (Figure 5.1a). This will require a rapid ramp-up this decade, with annual installation rates more than treble those seen over recent years. The average cost of offshore wind is expected to fall from £49/MWh to £35/MWh by 2040 (Figure 5.2a).
- Onshore wind: onshore wind capacity doubles to 32 GW by 2040 (Figure 5.1b). This will require recent annual installation rates to treble this decade, requiring installation rates comparable to the annual roll-out rates previously sustained during the mid-2010s.
- Solar: solar capacity increases to 82 GW by 2040, compared to 16 GW in 2023 (Figure 5.1c). Recent annual installation rates will need to almost quadruple this decade, reaching similar levels to the historical peak seen in 2015. The cost of solar has fallen significantly in recent years, and is expected to fall further in our pathway, from £52/MWh to £29/MWh by 2040 (Figure 5.2b).
- The electricity grid: these technologies need to be accompanied by investment in network infrastructure, including rapidly building out the transmission grid and speeding up the grid connection process, which currently poses a barrier to electrifying industry and HGV depots. Steep growth is needed from today out to 2040 (Figure 5.1d).
- Electric vehicles: by 2040, 80% of cars and 74% of vans on the road will be electric vehicles (EVs) in the Balanced Pathway, up from 2.8% and 1.4% respectively in 2023 (Figure 5.1e). The share of new car and van sales that are electric will grow quickly, reaching around 95% by 2030 and 100% by 2035.
- The transition to EVs is propelled by the falling cost of batteries (Figure 5.2c), which allows electric cars to reach price parity with comparable petrol and diesel cars by 2026 to 2028 (Figure 5.2d). After this point, EVs will be cheaper to buy and run, making them the clear choice for many buyers and allowing sales to accelerate beyond the minimum levels set out in the zero-emission vehicle mandate.
- A crucial enabler of EV sales is a reliable network of public charge points. There has been strong growth in the charging network over recent years (see Section 7.1). This needs to continue, with our pathway growing from 54,000 public charge points in 2023 to around 300,000 by 2030.
- Heat pumps: by 2040, 52% of existing homes in the UK will be heated using a heat pump in the Balanced Pathway, compared to around 1% in 2023 (Figure 5.1f). This requires the annual rate of heat pump installations in existing residential properties to rise from 60,000 in 2023 to nearly 450,000 by 2030 and around 1.5 million by 2035, after which point all new and replacement heating systems will be low carbon (mostly heat pumps, but with additional shares from low-carbon heat networks and direct electric heating).
- Our modelling assumes that boilers are only replaced at the end of their typical lifespan. Each year, typically around 1.8 million households replace their boiler.[150]
- By 2040, the cost of installing a heat pump for use in a typical residential property is expected to be falling and will be lower than it is today (Figure 5.2e). Further savings in installation costs may be possible as the market develops, but limited UK data makes this uncertain.
- Non-residential buildings will also install heat pumps, with 83% and 95% of heat in commercial and public sector buildings delivered by low-carbon technology by 2040.
- To enable the transition to low-carbon heat, it is vital that electricity and gas prices are rebalanced. Currently, levies and other policy costs increase electricity prices, disincentivising the take-up of low-carbon technologies. Delivering our pathway assumes a range of policy approaches to remove this disincentive (see Chapter 8), as well as underlying cost changes in gas and electricity production, resulting in the ratio of electricity to gas prices falling from around 4 today to between 2.2 and 2.6 by 2040, ensuring that the low-carbon choice allows consumers to save money through running costs due to the greater efficiency of heat pumps (Figure 5.2f).
- Industrial electrification: electrification is the dominant measure for industry in the Balanced Pathway. By 2040, electricity meets 61% of industrial energy demand, up from 26% in 2022 (Figure 5.1g).
- The major sources of heat in industry are replaced with electric options including electric boilers, electric ovens, electric furnaces in the glass sector, and, most significantly, electric heat pumps which could produce a large part of industrial demand for low-temperature heat. Electric arc furnaces will also replace blast furnaces and basic oxygen furnaces for steel production.
- The ratio of industrial electricity to gas prices has fallen in recent years, partly due to support schemes for energy-intensive industries.[151] Such support schemes need to continue and extend across a broader range of manufacturers (Figure 5.2g).
Low-carbon fuels and CCS
There is an important supporting role for low-carbon fuels, including hydrogen and aviation and shipping fuels, and CCS technologies. These contribute in areas less suited to electrification.
- CCS: CCS is used to capture combustion and process emissions in industry. It also plays a role in underpinning engineered removals (discussed below), in hydrogen production, and contributing to long-term storable, dispatchable power in the electricity supply sector.
- The Balanced Pathway includes 15 GW of dispatchable low-carbon electricity generation capacity by 2040 (Figure 5.1h). This includes gas CCS and hydrogen-fired turbines. There is flexibility in the balance of these options. They are complemented by 26 GW of battery and other short- to medium-duration energy storage, which helps with operation of the system and balancing of daily variations in demand.
- To be able to play this cross-cutting role, CCS infrastructure delivery will need to extend beyond currently agreed Track 1 projects, including to Track 2 and beyond.
- Low-carbon fuels: sustainable aviation fuel (SAF) meets 17% of aviation fuel demand by 2040, compared to around 1% in 2023 (Figure 5.1i). There remains uncertainty over the optimal balance between different types of SAF, engineered removals, and measures to manage aviation demand.
- The marginal unit of aviation fuel used during the Seventh Carbon Budget period is likely to be synthetic SAF, for which prices are projected to be falling steadily by this point (Figure 5.2h).
- By 2040, the Balanced Pathway sees ammonia meet 22% of shipping energy use and synthetic fuels a further 17%, predominantly from synthetic methanol.
Nature
Land-based measures including planting new woodland and restoring peatlands are integral in growing the land carbon sink in the Balanced Pathway, which is needed to ensure that the agriculture and land sectors together reach Net Zero.
- New woodland creation: planting new diverse woodlands delivers carbon sequestration in vegetation and soils. By 2040, the proportion of UK land covered by woodland will increase to over 16%, compared to 13% today (Figure 5.1j). When trees outside woodlands are considered (for example under agroforestry and short-rotation forestry measures) this increases to 19%. It is vital that tree planting rates increase quickly, due to the time taken for new trees to reach peak sequestration rates. This will require tree planting rates to more than double from 13 kha in 2023 to 32 kha per year by 2030.
- Peatland restoration: the proportion of UK peatlands in natural or rewetted conditions will rise from 26% in 2023 to 55% by 2040 (Figure 5.1k). This will require a considerable ramp-up in annual restoration rates this decade, from 13 kha in 2023 to 49 kha per year by 2030.
Engineered removals
Engineered removals are needed to balance remaining emissions that cannot be abated in the Balanced Pathway, principally from aviation.
- Engineered removals: by 2040, engineered removals will be operating at scale, with 21 MtCO2 being removed in total each year (Figure 5.1l).
- In our pathway, the largest share of engineered removals in 2040 is delivered by BECCS across various sectors, but the contributions from DACCS, enhanced weathering, and biochar will be growing. There is substantial uncertainty around both the balance between removals technologies and the trade-offs between removals, low-carbon fuels, and demand management, so these shares could be different in practice.
- As the market scales up and demand to offset residual emissions grows, the costs of removals are projected to fall. In 2040, the average cost of removals is expected to be £324/tCO2, which is cost effective compared to the central carbon value (Figure 5.2i).
| Figure 5.1 Key indicators of roll-out of low-carbon technologies and land-based actions in the Balanced Pathway – quantity variables |
 Description: The key quantity indicators of the roll-out of low-carbon technologies and land-based actions in the Balanced Pathway show continued growth in renewables, growth that follows an S-curve in the electrification of cars, home heating, and industry, a ramp-up in tree planting and peatland restoration rates, and growing contributions from low-carbon fuels and engineered removals. Source: Historical data from DESNZ, NESO, DfT, EHPA, NAEI, Forest Research, Defra, and the devolved administrations; Climate Change Committee (CCC) analysis. Notes: (d) The chart shows the average number of GW capacity added to each transmission network boundary. (f) The chart shows the share of existing homes that are heated by a heat pump in each year, including homes with individual heat pumps and those connected to communal heat pump systems. This share does not include homes connected to low-carbon heat networks (some of which will use heat pumps). (j) Historical woodland area is based on the September 2024 Woodland Statistics release. Our modelling is underpinned by the 2021 estimates of woodland area, which were lower than the most recent historical data. |
|
Figure 5.2 Key indicators of roll-out of low-carbon technologies and land-based actions in the Balanced Pathway – price variables |
|
|

The deployment of low-carbon technologies needs to be done in parallel with a shift away from high-carbon activities. This is particularly true where no major low-carbon technology exists or where these shifts are required to reduce emissions in the near term due to technologies taking longer to develop. Our key indicators set out the levels of demand for high-carbon activities in our pathway and how these compare to historical trends (Figure 5.3).
Reducing demand for high-carbon activities
Demand
High-carbon demand can be reduced through measures that increase efficiency and sustained shifts towards lower-carbon choices.
- Road transport demand: enabling people to choose alternatives to driving can reduce emissions and deliver a range of co-benefits. While the deployment of EVs delivers the largest share of emissions reduction in road transport, it is also important to encourage a shift away from cars towards alternative modes of travel. By 2040, total car-kilometres driven per capita in the Balanced Pathway, including EVs as well as petrol and diesel vehicles, are projected to rise slightly to 5–14% above 2023 levels, depending on the extent of possible rebound effects due to EVs (Figure 5.3a).[152]
- Car traffic steeply declined during the pandemic. This fall and the subsequent recovery have resulted in 2023 levels of per-capita car-kilometres being 7% below pre-pandemic levels. Excluding the possible impact of rebound effects, car-kilometres driven per capita remain below these 2019 levels all the way out to 2050.
- Our pathway represents a lower level of demand growth than if pre-pandemic growth trends were resumed, with 7% of car kilometres shifted to public or active travel by 2035.
- Energy efficiency in buildings: by 2040, almost all homes will have taken some steps to improve their energy efficiency (for example draught-proofing or lagging hot water cylinders) in the Balanced Pathway.
- In addition, cavity wall insulation is installed in 16% of homes with cavity walls, such that 87% of these homes have insulation by the mid-2030s (Figure 5.3b).
- Additional loft insulation or top-up loft insulation is installed in 9% of homes with lofts, such that all these homes have insulation by the mid-2030s.
- Livestock numbers: support and incentives for farmers and land managers to diversify their income streams and a reduction in meat and dairy consumption allow land to be released out of livestock production for alternative uses. This leads the number of cattle and sheep to fall by 27% by 2040 from 2023 levels in the Balanced Pathway (Figure 5.3c).
- Average meat consumption declines by 25% by 2040 relative to 2019 levels (Figure 5.3d). This requires going beyond the existing UK long-term trend, which shows a gradual reduction in meat consumption. In recent years, meat purchases have fallen more steeply, with a 10% fall in overall meat consumption between 2020 and 2022. This represents a faster rate of decline than in the Balanced Pathway.[153] It is too early to tell whether this steeper-than-projected trend will continue in the long term or is a temporary response to the cost-of-living crisis, which saw an 11% decrease in overall food purchases by weight between 2020 and 2022.[154]
- Aviation demand: in the Balanced Pathway, per-capita aviation passenger-kilometres in 2040 are 16% above 2025 levels, with demand growth from the mid-2030s contingent on low-carbon technologies being available (Figure 5.3e).[155] This is a considerably lower increase than in the baseline, in which per-capita demand grows by 53% by 2040.
- Aviation demand can only grow if aviation sector technology roll-out progresses and begins to abate and offset aviation emissions, with demand management playing an important role in the 2020s and 2030s while availability of SAF and engineered removals is limited. As a result, per-capita passenger-kilometres remain relatively flat between 2025 and the early 2030s.
- As SAF and engineered removals become more widely used from the mid-2030s, demand then grows from this point (although demand remains below baseline levels). This growth is conditional on these technologies developing as projected.
- Recycling: today, around 45% of household waste is recycled, although there is significant regional variation. In the Balanced Pathway, this average level increases to 57% by 2035, a rate already achieved in Wales (Figure 5.3f). Recycling rates for commercial and industrial waste, including municipal non-household waste, are expected to rise even higher, to 74%.
| Figure 5.3 Key indicators of demand for high-carbon activities in the Balanced Pathway |
 Description: The key indicators of demand for high-carbon activities in the Balanced Pathway show distance travelled by car and by plane growing more slowly than historical trends, reductions in meat consumption that build on historical trends, falling livestock numbers, and increasing recycling rates. Source: Historical data from DfT, MHCLG, Defra, CAA, and ONS; CCC analysis. Notes: (a) The range represents the uncertain impact of rebound effects, which could increase driving as a result of the cheaper cost of motoring offered by electric vehicles. (c) Livestock numbers at the start of the pathway are higher than the most recent historical year due to the increase in sheep numbers in the baseline from 2022. (d) Consumption of meat at the start of the pathway is aligned to the existing UK long-term trend. This means it is above the most recent historical years (2021 and 2022) when levels fell more steeply, but it is too early to tell whether these reductions will continue in the long term or are just a temporary reaction to the cost-of-living crisis. |
5.2 The role of markets, governments, and the public in delivering the transition
The roll-out trajectories and shifts described in Section 5.1 are all deliverable through a combination of markets, government support, and choices by the public.
5.2.1 Delivery through markets
The private sector has a proven record of innovating and delivering rapid transitions in technologies and consumer choices, provided the right conditions and incentives are in place to enable this. Mass-market roll-outs of mobile phones, refrigerators, and internet connections all took place over similar timescales to those required for the uptake of EVs, heat pumps, and renewables.[156];[157];[158] These low-carbon markets are already growing quickly, both in the UK and overseas.
- Almost all major vehicle manufacturers now offer a range of electric car options, with more than 100 models now available in the UK.[159] Choices are available across all market segments, and offerings in the van and HGV markets are also growing.
- Heat pump markets are growing across Europe, following countries such as Denmark and Sweden in which they are already well established.[160] In 2023, over 3 million new heat pumps were installed in Europe, which is more than three times the installation rate a decade ago.
- The costs of many of the low-carbon technologies needed to deliver our pathway, such as batteries and solar panels, have fallen quickly and are now lower than ever (see Figures 5.2b and 5.2c).[161];[162] In the past decade, battery pack prices have fallen by more than 80%.
These trends show that markets are scaling up. Meeting the Seventh Carbon Budget will critically depend on putting the conditions in place for this growth to continue and extend across all the areas required. Our pathway depends on a variety of technologies at different stages of maturity – what is needed will vary depending on the phase of the transition. Some technologies are already well established and entering the mass market while others are still in the early innovation stage (Figure 5.4).[163]
- For technologies already at mass-market deployment (such as renewables), the UK needs to support and maintain continued investor confidence and provide market mechanisms to support robust competition.
- For technologies approaching mass-market deployment (such as EVs), clear signals on the pace of change expected from businesses are important, as well as policy focus on the developments needed to allow technologies to extend beyond early adopters (for example, supporting infrastructure and consumer information).
- Once technologies near this stage, there are clear opportunities for government and industry to narrow down the options and set phase-out dates for ending sales of old technologies, sending clear signals to consumers and investors on the way forward.
- Reaching mass market deployment is made easier by making the necessary consumer and business choices as straightforward as possible. Changes to ease planning barriers or regulatory restrictions can therefore help in this phase of roll-out by minimising obstacles to people choosing the new technology.
- In some cases, such as heat pumps, a technology is well established either internationally or in a specific context, but supply chains and expertise will need to be scaled up in the UK. In such instances, clear information and policy support for the key enablers (such as consumer demand and installer capacity and training) will be important.
- For technologies still in the innovation phase (such as sustainable aviation fuel, engineered removals, and novel alternative proteins), it is vital to address the prerequisites that will enable scale-up at pace. This includes ensuring that the policy environment provides sufficient confidence on sustained levels of demand to allow markets to build up supply chains and develop the skills bases that will be needed to deliver a fast-expanding market.
- For early-stage technologies, research and development (R&D) support and incentives to stimulate innovation and bring technologies to market can be important to accelerate development.
- In many such cases, it can be vital to maintain optionality across a range of competing technologies until uncertainties reduce and a clear preferred option emerges. Some options will fail to develop as expected, which should be viewed as an acceptable risk provided other options succeed.
|
Figure 5.4 Phases of low-carbon technology roll-out in the Balanced Pathway |
|
|

5.2.2 The role of government
Markets alone cannot drive the Net Zero transition. Policy is needed to provide confidence to investors and consumers; manage risks in new markets; remove barriers to delivery; and, in some cases, provide financial incentives where necessary.
Enabling market delivery through policy
Stable, consistent policy supports markets to develop and scale up. This should include clear, long-term signals on the direction of change and decisive choices to narrow option spaces once the evidence is clear. This will help give businesses confidence to invest in the right solutions.
- Carbon budgets are designed to provide such a stable framework: the budget level is set 12 years in advance of the period in question, giving a clear long-term signal on the UK’s direction of travel. Moreover, the Climate Change Act requires the Government to produce a report setting out proposals and policies for meeting carbon budgets, including the timescales over which these are expected to take effect. This requires the Government to set out plans to deliver the budget that are consistent with the objective and provides Parliament with a transparent, measurable basis for its scrutiny of the Government’s actions.
- Contracts for difference and other market mechanisms can build upon this, providing further levels of certainty to investors, improving incentives, and enabling competition.
- Market mechanisms improve incentives to take the action required and provide a consistent basis for markets to grow and competition to develop. Examples include the zero-emission vehicle mandate and the clean heat market mechanism.
- Contracts (including contracts for difference) increase certainty by binding government and businesses into a legal agreement to deliver required outcomes. Contracts for difference have been successful in helping scale up renewables deployment, driving down the price at which renewables projects are delivered, and building a pipeline of confirmed future projects.[164];[165]
- Carbon pricing can help ensure that private incentives are aligned to the social goal of reducing emissions, through the ‘polluter pays’ principle. Carbon pricing can play an important role in effective climate policy but must be supplemented with policies that address non-financial barriers, support early-stage or expensive technologies, and address distributional impacts.[166] Carbon pricing is already in place in certain sectors through the UK Emissions Trading Scheme (UK ETS) and the UK’s adoption of the Carbon Offsetting and Reduction Scheme for International Aviation (CORSIA).
- It is crucial that policies are properly aligned to the pace of transition required. Decisions on technologies must be taken promptly once the market has locked in and plans must be in place to develop supporting infrastructure and enable consumers and businesses to switch (if required), to build the demand that can pull through further market progress.
In many cases, decisions taken today will continue to have an impact into the Seventh Carbon Budget period and beyond. The frameworks and processes guiding these decisions must properly consider the importance of both reducing emissions and adapting to climate change. This will reduce delivery risks and lower the costs of the transition.
- For example, planning frameworks and standards must ensure new homes that are built today do not need to be retrofitted in future to meet emissions and adaptation goals.
- Infrastructure is a key enabler of many of the changes needed. This needs to be prioritised at a national level, ensuring availability in time for emissions targets and that it is designed in a way that is resilient to a changing climate. The UK’s gas and electricity transmission and motorway networks were rolled out at a similar pace to the expansion we need to see in the electricity, EV charging, and CCS pipeline networks today.[167];[168];[169]
There will be aspects of any transition which market dynamics alone will not adequately address. Governments have a role in addressing such barriers and putting in place policies to ensure these do not undermine delivery. Interventions will be needed to unblock barriers as they appear.
- Government interventions, including targeted support and regulations, can be necessary to ensure that markets develop in a manner that is accessible and fair to all communities.[170] Subsidies will be necessary in some areas where households or businesses are not able to afford low-carbon alternatives, are constrained in their access to capital, or where there are significant distributional or acceptability concerns (see Chapter 8).
- Effective monitoring of technology roll-out will be critical, to identify and proactively address any barriers that begin to emerge. Specific barriers associated with the tail-end of transitions will need to be considered and planned for.
Addressing coordination challenges
The Net Zero transition has long timescales and relies upon delivery across the economy and society. Delivering Net Zero therefore requires a whole-system approach, with interactions being properly understood and planned for and actors being incentivised to deliver on their responsibilities. Ensuring this, alongside a coherent overall policy landscape, should be a key goal for central governments (at both UK and devolved level).
- Interdependencies between expanding low-carbon generation, increased electrification, and grid infrastructure should be an immediate priority area of focus. Expanding the grid is a fundamental enabler, without which our decarbonisation objectives cannot be achieved.
- Ofgem has a critical role in ensuring that grid development happens at the required pace, through its controls on the revenues transmission and distribution network operators are permitted to raise. The Energy Act (2023) gave Ofgem an explicit duty to consider how its decisions may help the country meet its Net Zero and carbon budget targets.[171] This needs to be put into practice through speeding up processes, increasing willingness to invest proactively, and recognising the downsides of choosing not to invest.
- The National Energy System Operator (NESO) has been commissioned to develop a strategic spatial energy plan.[172] This should aim to provide a joined-up strategic approach to planning the future energy system, coupled with the governance to coordinate this. It must also interact constructively with existing frameworks, such as National Policy Statements and the National Planning Policy Framework.
- If the right enabling conditions are in place, markets are able to do a lot of the work in coordinating solutions. An example is the roll-out of EVs and EV charging infrastructure – if the signals on expected levels of demand for EVs are sufficiently clear and barriers are resolved, then there are clear benefits for vehicle manufacturers and charge point operators to work collaboratively to achieve mutually beneficial outcomes.
Investment, skills, and industry
As set out in Chapter 4, many aspects of the Net Zero transition require upfront investment in order to access savings later on. While much of this will come from the private sector, there is a role for governments (both national and local) to facilitate this private investment and supplement it with public support in targeted areas.
- Innovation will be key to delivering the Net Zero transition, whether in developing and scaling up new solutions in areas where optionality remains in our pathway or to widen the reach of technologies that the market is locking into. Public financing can enable this by lowering upfront costs of capital.
- Public investment offers the potential to help crowd in private finance, catalysing the investment required to scale up delivery.[173];[174] Public investment also strengthens the incentive for future governments to maintain a consistent course and supportive policy framework, further increasing investor confidence.
- Some aspects of the transition are likely to require ongoing government subsidies, especially in areas where markets alone will not deliver deployment at the pace or across the breadth of society required. This is likely to be the case for decarbonising home heating, where the emissions savings are worth the additional upfront costs to society. While markets can play a role in bringing these costs down, some government support is likely to be needed to ensure that everyone is able to participate in the switch to low-carbon heating.
- As well as subsidies, financing can help households and businesses where upfront costs are involved. Various mortgage lenders now offer preferential interest rates for properties with high levels of energy efficiency, while some offer zero-interest borrowing for home energy efficiency upgrades.[175];[176]
Underpinning the UK’s approach to Net Zero must be a coherent approach to supporting industry in the transition to a low-carbon economy. This must set out the Government’s approach to choosing where to invest and its plans for ensuring that existing industrial strengths are not lost overseas due to a failure to realise their low-carbon transition in the UK.
- As a relatively small economy, the UK should not aim to capture a share of every low-carbon market but should prioritise its target areas for investment. The Government should identify the priority areas in which it aims to grow British business to capture a share of an emerging industry. These should build on areas of existing comparative advantage and will likely include expanding service sectors as well as manufacturing low-carbon technologies.[177];[178]
- In areas in which the UK is aiming to capture an early-mover advantage, the Government’s commitment must remain consistent, to avoid policy uncertainty undermining forward-planning and investment. Innovators will require both public investment for R&D and early-stage development and support (for example financing and streamlined regulatory processes) to help bring products through from innovation to market. Bridging the ‘valley of death’ between public and private funding is crucial to realising returns on investment.[179];[180]
- Existing UK industries could benefit from growing global demand for low-carbon goods in the long term by decarbonising earlier than international competitors. This requires a supportive investment environment and support to manage transition costs, to ensure that domestic production does not become uncompetitive in the short term as it transitions.
Alongside a strategy for supporting and growing industries, the Government should develop a skills action plan for Net Zero, which sets out priority skills gaps and plans to address them. It should consider industrial priorities, delivery priorities (for example, the need to rapidly grow the workforce of heat pump installers), and place-based solutions for areas where businesses may decline.
- Almost one-tenth of the UK workforce are in sectors that will need to grow in order to deliver the Net Zero transition, including home retrofit, peatland restoration, woodland creation and management, and electricity supply. To deliver the deployment trajectories in the Balanced Pathway, some of these sectors will require a rapid increase in employment.
- Policy certainty can signal to the labour force the value in upskilling or reskilling. More proactive skills policy may be needed in particularly acute areas, such as where the skilled workforce needs to grow rapidly, where businesses are typically very small (such as sole trader boiler installers), or where there is limited confidence in future employment opportunities.
- The public needs to have confidence that installations of low-carbon measures will be straightforward and will be delivered to a high quality. Appropriate government verification schemes and standards can play a role in building this confidence, while businesses will need to be able to grow their workforces and ensure they deliver high-quality training to ensure positive consumer experiences in order to grow demand.[181];[182]
We discuss investment and opportunities for businesses, impacts on employment, and the policy support required further in Chapter 9.
Interactions between the UK and devolved governments
The UK, Scottish, Welsh, and Northern Irish Governments each have ambitious Net Zero targets. More than 10% of the UK-wide emissions reduction required to meet the recommended Seventh Carbon Budget will come in devolved or partially devolved policy areas within the devolved nations. Likewise, 30-60% of the emissions reduction required in Scotland, Wales, and Northern Ireland will come in policy areas that are mainly reserved. There is therefore a shared reliance between national governments for effective delivery.
- While there have been some examples of collaborative policy (for example, the zero-emission vehicle mandate and offshore wind planning), in other areas, the UK and devolved governments need to work together more effectively.[183];[184];[185] An important first step would be a collaborative effort to map out the key interdependencies, agree responsibilities, and ensure each nation’s plans will work together constructively.
- Key reserved policy areas impacting each nation’s targets include planning of the energy system and engineered removals. These areas nonetheless often depend on enabling actions at devolved level, so there remains a need for collaborative efforts.
- In areas that are mostly devolved, policies need to be sufficiently joined-up to avoid risks of inconsistencies undermining delivery. Dependency on shared infrastructure, behaviours in border communities, and consistency of government messaging are key examples.
- In certain areas, differences in policy approaches could provide valuable insight from which all nations can learn. Ensuring that effective monitoring and evaluation processes are embedded in policy design and that findings are shared promptly will be important to enable this to happen.
We will publish advice on emissions targets for each devolved administration later in 2025.
Interactions between national and local governments
There is substantial ambition to act on climate change at local government level, with 84% of councils having a climate change plan.[186] This ambition needs to be harnessed more effectively, as delivery against it is currently inconsistent, hindered by a lack of clarity on who should be doing what, limited resources, competing priorities, and a fragmented, short-term funding landscape.
- An agreed division of responsibilities between central and local government is needed. This should identify the areas in which local government can act and prioritise those that will have the greatest impact, while allowing scope to go further for those wanting to innovate.
- Local authorities should focus on the most impactful changes needed locally and help their communities understand what these are. There is high scope for local government to influence emissions from buildings, surface transport, and waste, which account for around half of the emissions reduction needed to meet the Seventh Carbon Budget.
- The critical infrastructure upgrades that are needed should be led at a national or regional level. This includes most electricity generation and the grid upgrades needed to transmit this power to where it is needed. But local authorities have an important role to support their delivery and ensure they are designed in a way that considers the local community and allows sharing of benefits. Such projects are often vital to the delivery of Net Zero and adapting to climate change nationwide, so it is essential that they can be delivered without impediment.
- Current structures for coordinating actions between national and local governments are falling short of their potential.[187];[188] Local government representatives have called for a new framework or partnership to provide a shared understanding of priorities and how national and local government should work together to deliver them.[189];[190]
Delivering Net Zero requires longer-term, more predictable funding to enable local authorities to develop and implement plans. Funding streams could be linked to accountability for the responsibilities agreed between central and local government.
- The current funding landscape is highly fragmented and focussed mainly on competitive, short-term projects.[191] This often favours better-resourced authorities and those who have been successful previously, rather than allocating funding in line with where it could bring the greatest benefit. A longer-term, programmatic approach would allow authorities to plan and develop capabilities, as well as making it easier to leverage other sources of finance.
- Varied capacity and capability also pose a challenge. Sharing of best-practice (such as through Local Net Zero Hubs) and provision of shared resources (such as the National Wealth Fund’s local authority advisory function) can help address this.
- Devolution deals agreed with various combined authorities appear promising. These include various multi-year funding settlements, including designated pots for projects linked to Net Zero (for example, devolving buildings retrofit funding in ‘trailblazer’ deals).[192] Future devolution settlements should take a similar approach, linking funding to specific required outcomes.
5.2.3 Public engagement
Effective engagement with the public is essential to build people and businesses’ understanding and confidence in low-carbon technologies, goods, and services. This will help grow the demand that will pull through further scale-up in these markets. Around a third of the emissions reduction required to meet the Seventh Carbon Budget will come from households making low-carbon choices. Public engagement should aim to communicate the most important household choices and proactively address misconceptions and misinformation about low-carbon technologies.
- There is strong public knowledge of climate change and Net Zero. Knowledge of some of the key solutions is also growing (Figure 5.5), but public engagement (including clear, consistent public messaging, public information campaigns, and standards so that trusted information is available to consumers) is needed to ensure people understand the most impactful actions available to them.
- 80% of the UK public say they are concerned about climate change, while 65% perceive it as already having an impact on the UK.[193];[194] Knowledge of the concept of Net Zero has grown markedly in recent years.[195];[196]
- EVs are becoming mainstream, with over 90% of people reporting knowledge of them.[197] This is in contrast to heat pumps, with only 50% of people saying they know a lot, a fair amount, or a little about this technology.[198]
- In 2023, 36% of people reported that they consider the impact on the environment when deciding whether or not to travel by air (up from 21% in 2016).[199];[200]
- Recent representative UK data on people’s awareness of the emissions impact of eating meat and dairy is missing, but wider research suggests awareness is limited.[201] There is also unease and limited trust around novel alternative proteins.[202];[203]
- For both EVs and heat pumps, there is evidence of significant misinformation about their reliability and cost. Effective, trusted public engagement is important to address this.
- For example, 30% of people wrongly see electric cars as being expensive to run and maintain and 40% wrongly believe that electric cars are no more environmentally friendly than petrol or diesel cars.[204];[205]
- One-third of people who said that they were unlikely to install a heat pump stated that it may not be possible to do so in their home and one-third stated that they would rather wait to see how the technology develops.[206] This is despite heat pumps being a well-established technology, found to be suitable for the vast majority of UK homes.[207]
- As technologies become more visible, this can build familiarity. Simple steps can help with this, such as green number plates and advertising campaigns. Clear, trustworthy consumer information and product standards can help build confidence in new technologies.
- It is also important for the Government to be visibly taking the lead in implementing the changes that it is asking of the public. For example, a rolling programme to decarbonise public buildings would show government leadership and would help grow markets and develop the workforce capacity and skills that will be required to decarbonise commercial and domestic premises.
Public engagement needs to go beyond one-way information provision. It should also enable governments to gain input from the public and build public buy-in.
- Two-way engagement around the key low-carbon household choices will ensure that policy design considers perceptions, concerns, and different circumstances of UK households and will aid the development of deliverable policies that gain public support.
- Beyond the main household low-carbon choices that need to happen, the transition will also impact communities in other ways, through changes to local landscapes and employment (see Chapter 9). Bespoke two-way engagement will be needed to ensure concerns are heard and where possible addressed, and that there is local buy-in for changes.
- Public buy-in for changes impacting households and businesses can be further increased through government leadership: visible public figures can lead by example and adopt key solutions, and the Government can communicate clearly how its plans will ensure an appropriate distribution of action from all actors and across the economy.[208]
Low-carbon choices available to households are discussed in Chapter 8, including the findings from our citizens’ panel, which strongly called for a proactive government engagement campaign.
| Figure 5.5 Public knowledge of Net Zero and low-carbon technologies |
 Description: There is strong public knowledge of climate change and Net Zero. Knowledge of some of the key solutions is also growing, with knowledge of electric vehicles considerably ahead of knowledge of heat pumps. Source: DESNZ (2024) Public Attitudes Tracker; Ipsos (2024) Technology Tracker; CCC analysis. Notes: (1) ‘Knowledge’ is defined as people indicating that they know a lot, a fair amount, or a little about a technology, but does not include responses that indicate that people have heard of a technology (but know hardly anything about it). The Technology Tracker only covers England. (2) For ‘Knowledge of electric vehicles’, data is used from December survey results, except for 2020 where data is used from August/September. For ‘Knowledge of Net Zero’ and ‘Knowledge of air source heat pumps’, data is always used from winter survey results. |
5.3 Integrating adaptation into Net Zero delivery
Further climate change is inevitable. This means that further changes in UK weather and climate extremes will occur and need to be planned for. Implementing actions to reduce emissions without considering the future UK climate could pose a risk to those emissions reductions and work against needed adaptation, making the challenge of living with future climate change harder. Integration of adaptation aims is critical for the following reasons:
- Avoiding lock-in of climate risk. The Balanced Pathway requires rapid investment and deployment of long-life mitigation measures, such as renewables, grid infrastructure, and woodland creation. These measures need to be designed to be resilient for a future climate, so as not to put the Net Zero target at risk.
- Maximising co-benefits. Integrating adaptation into the design and delivery of mitigation policy can benefit wider outcomes beyond emissions reduction. For example, restoring natural carbon stores can have positive benefits for biodiversity and ecosystem services which regulate the environment, support health and wellbeing, and offer amenity value.[209]
- Minimising trade-offs and avoid unintended consequences. Systems thinking is required to consider the interactions between mitigation and adaptation to identify potential synergies and make explicit potential negative impacts. For example, consideration of climate hazards such as flooding needs to be incorporated into spatial planning for new infrastructure.
Delivering the Balanced Pathway will require a range of new investments. To be effective, these need to be mindful of widespread climate risks such as heatwaves and flooding and consider their possible effect on local impacts such as drought risk. They should be considered when planning the actions required in all sectors. The sectors below have clear links between mitigation and adaption, showing how co-benefits can be realised and trade-offs and unintended consequences minimised.
- Buildings: in most instances, measures to improve energy efficiency in existing buildings, such as loft and cavity wall insulation, have synergies with adaptation, helping to reduce risks of overheating in heatwaves. However, in poorly ventilated homes, these can lead to increases in indoor air temperatures.[210] Consideration of these synergies and trade-offs needs to be included in planning of energy efficiency upgrades. When successful, this leads to homes needing less heating or cooling during extreme heat or cold and reduces the cost of implementation by sharing the cost between adaptation and mitigation retrofits.
- Agriculture and land use: in delivering land use changes, it is essential to consider their impact across a range of environmental outcomes (Box 5.1). Without this, the potential for measures such as tree planting or peatland restoration to sequester and store carbon is at risk from a changing climate and other pressures. The spread of the bark beetle in France reducing the sequestration potential of French forests is an example of this happening.[211]
- Electricity supply: given the increased dependence on electricity across the economy in our pathway, it is crucial to ensure that the electricity grid is appropriately protected from weather and climate extremes. A decarbonised energy system needs to be resilient at both the system and asset level in order to provide reliable and secure supply:
- At the system level, reliance on weather-dependent renewables will increase, so it will be important to design the system to be resilient to weather-related risks (see Section 7.5). In addition, resource constraints (such as water availability) need to be considered.
- At the asset level, existing infrastructure and new investments in generation and network capacity will need to be made resilient to a changing climate. The lowest-cost route will generally be to design in resilience upfront.
| Box 5.1 Principles of a resilient land use transition |
Farmers and rural communities are critical to delivering a Net Zero future. In the Balanced Pathway, land use across the UK is transformed to expand measures which sequester and reduce emissions.[212] It is vital that these changes are delivered in ways that protect rural communities and ensure that their benefits to these communities and wider society are maintained in the long term. We consider the following principles to mitigate the risk of unintended consequences to the wider environment and communities:
The effectiveness of the measures in our pathway is highly dependent on where they are in the landscape, and risk of failure is high if they are applied in an unsuitable location or if the measures lack resilience to future climate change. The above points relate to mitigating the risk of unintended consequences at a high level, but ultimately land use change is often dependent on decisions made at a farm or field scale. On-the-ground delivery should consider the following to build resilience into the land use transition:
|
5.4 Key actions
We have 43 priority recommendations that need to be enacted to put the country on track to deliver the Seventh Carbon Budget. The full set can be found in Annex 1. There are seven core themes that underpin most of these recommendations:
- Making electricity cheaper. The largest share of emissions reduction in our pathway comes from switching to low-carbon electric technologies across sectors including transport, buildings, and industry. Households and businesses need to be better incentivised to make these choices through the impacts they will see on their bills. This can be done through rebalancing prices to remove policy levies from electricity bills.
- Removing barriers. People need to be able to install heat pumps and EV charge points in their homes and businesses. Industries require timely grid connections to allow them to move to electrified production processes. Grid infrastructure is essential to enable everyone to make use of domestically produced low-carbon electricity, reduce energy bills, and improve our energy security. Key processes and rules, including in planning, consenting, and regulatory funding, need to enable rapid deployment of low-carbon technologies.
- Providing certainty. In many key areas, the best way forward to decarbonise is now clear. Once the market has locked into a solution, it needs to be delivered. Government should support markets to do this by setting out clear, timely decisions on support for new technology choices, and dates for phasing out old technology. Certainty will provide confidence to consumers and investors. This should include confirming that there will be no role for hydrogen in home heating.
- Supporting households to install low-carbon heating. While the Net Zero transition should lead to lower energy bills for consumers, support is needed to address barriers in upfront costs, especially for low-income households. Addressing barriers such as the price of electricity, lack of awareness, and misconceptions about heat pumps will also be crucial.
- Setting out how government will support businesses. Businesses need clarity on the balance between government support and market mechanisms such as the UK Emissions Trading Scheme and carbon border adjustment mechanisms, so that they can make the transition to low-carbon operations. With the right support, UK businesses could decarbonise early and take advantage of growing global demand for low-carbon goods and services. Farmers and land managers need support to diversify land use into woodland creation, peatland restoration, energy crops, and renewable energy.
- Enabling the growth of skilled workforces and supporting workers in the transition. Growing workforces will be a critical enabler of some of the system-wide changes that are needed (for example, switching from gas to electric heating or expanding the electricity grid). We need a plan for how to do this. A small number of industries will change substantially, which could adversely impact communities if not managed well. Government, business, workers, and communities should proactively plan for how to address this and ensure that new opportunities are available in affected areas.
- Implementing an engagement strategy. Government should provide clear information to households and businesses. It should focus on what actions are most impactful in reducing emissions, the benefits of low-carbon choices, and providing trusted information.
Chapter 6: Uncertainty and contingency
Introduction and key messages
This chapter examines the impact of key uncertainties on the Balanced Pathway, encompassing both cross-economy and sector-specific factors. Additionally, it identifies contingency measures that could be used to make up potential shortfalls in emissions reduction or as options to go further.
Our key messages are:
- The path to Net Zero has become clearer in many areas, as discussed in Chapter 3. However, substantial uncertainty inevitably remains around aspects of a pathway modelled over a 25-year time horizon. An uncertainty assessment allows us to identify key sources, understand their potential impact, and consider options to address deviations from the pathway.
- Population and GDP growth, emissions accounting methodologies, and fuel costs are key sources of uncertainties in our pathway. Uncertainties in how key technology costs will evolve also play a role, as do year-to-year weather fluctuations and general trends in weather, including from climate change. Uncertainties vary across sectors.
- The largest uncertainty impact in 2040 comes from the aggregation of cost sensitivities, followed by global warming potential (GWP) and population and GDP uncertainties.
- Contingencies provide options to go further or to catch up if emissions reductions fall off track. Development of contingency options is important to ensure a robust and adaptive approach to achieving Net Zero. Appropriate contingencies vary depending on the period under consideration, as well as the timescales available for implementation.
- For the UK’s nearer-term targets, faster action to decarbonise the electricity system, further reducing car travel, and incentives to speed up electric vehicle (EV) sales are key options.
- For the Seventh Carbon Budget, the most important contingencies are accelerated roll-out of EVs and heat pumps, including scrappage schemes. Early scrappage in these areas is not included in the Balanced Pathway but could provide an option to go faster or to catch up if emissions reductions fall off track.
- For Net Zero, options to accelerate deployment of removals or to increase demand-side measures in the aviation and agriculture sectors can have more impact.
6.1 Our approach to uncertainty analysis
We have broadly divided uncertainties into two categories, based on their associated timescales:
- Long-term uncertainties are derived from long-term trends in underlying influencing factors, such as GDP. Our analysis of long-term sources of uncertainty focusses on underlying influencing factors, rather than on uncertainty around the effective delivery of policy.
- Short-term uncertainties are derived from shorter-timescale fluctuations in underlying influencing factors, such as year-to-year variation in weather.
There are also numerous sources of uncertainty that are outside the scope of this analysis. Furthermore, our understanding of some uncertainties is limited by the quality and availability of data. As such, the results described in this chapter should not be interpreted as a complete representation of the uncertainty in the Balanced Pathway.
6.2 Long-term uncertainties
6.2.1 Key sources of long-term uncertainty
The key sources of uncertainty considered here are:
- Population and GDP growth. The Balanced Pathway is based on forecasts of population and GDP growth, which affect consumption patterns in the UK.[213];[214] We have identified sectors that are particularly sensitive to changes in GDP and population and quantified the impact of varying assumptions on their emissions. For aviation, we have also included the impacts from uncertainties in foreign GDP and the elasticities with which demand reacts to prices.[215];[216];[217]
- Greenhouse gas inventory. We use the published uncertainty on the current greenhouse gas (GHG) inventory to account for potential future accounting changes that could impact the UK’s emissions targets.[218];[219] Additional uncertainties are applied for wastewater emissions factors and soil disturbance emissions from tree planting.
- Since our advice on the Sixth Carbon Budget, inventory changes have reduced estimated UK emissions (see Chapter 3). Future changes could increase or decrease reported emissions.
- Hydrogen has an indirect warming impact, so hydrogen leakage was analysed to assess the impact. Since there are no official GWP values for hydrogen, it is not included in the inventory. An uncertainty is included to account for possible inclusion in the future.
- Global warming potentials. GWP values are used to convert emissions of non-CO2 GHGs into their CO2-equivalent. We use GWP100, which compares the warming effects of gases over a 100-year time horizon, in line with international practice.[220] Our uncertainty analysis incorporates Intergovernmental Panel on Climate Change estimated uncertainties in the GWP100 emissions factors.[221]
- Fuel and technology costs can impact emissions for sectors in which cost plays a role in determining when fuels or technologies are taken up (see Chapter 2).
- For fuel costs, we consider the uncertainty on future oil, gas, electricity, and hydrogen costs. DESNZ projections are used for the oil and gas costs, and the change in gas costs is reflected in electricity costs.[222] Intrinsic cost uncertainties (uncertainties from factors not related to gas costs) for electricity and hydrogen are assumed to be ±25%. For shipping, we also include the effect of varying synthetic fuel costs.
- For technology costs, we consider uncertainties around the cost of EVs and heat pumps. Other technology cost uncertainties, for example in the industry and electricity supply sectors, are not considered but would contribute to overall uncertainty.
- Climate impacts. There is uncertainty on the projections of warming in the UK over the next 25 years.
- Climate change will alter demand for heating, which is currently largely from gas. As warming occurs this is likely to reduce demand, lowering emissions in the buildings sector. This uncertainty is estimated based on the probabilistic projections from the Met Office’s UKCP18 publication (using the RCP4.5 scenario).[223]
- Future warming and extreme events such as wind, wildfires, droughts, pests, and disease will interact with land-based measures, potentially reducing their capacity to sequester and store carbon. Due to the difficultly modelling the effect of these events, we currently do not quantify this. The land use transition should embed adaptation and resilience principles to mitigate risk to natural carbon stores (see Chapter 5, Box 5.1).
- Carbon capture rates. We consider uncertainty in the capture rate of carbon capture and storage (CCS) technologies, assessing the impact if these rates do not improve over time.
6.2.2 Impact of long-term uncertainties on the Balanced Pathway
Combining the different long-term sources of uncertainty gives an indication of the overall impact on the Balanced Pathway (Figure 6.1).[224] In absolute terms, the total magnitude of uncertainty from the factors quantified in this analysis is fairly steady along the pathway. The relative uncertainty increases as the absolute emissions decrease, growing from 11% in 2030 to 28% in 2040. The uncertainty makeup changes significantly across the duration of the pathway.
- The largest uncertainty impact in 2040 comes from the aggregation of cost sensitivities, followed by GWP and population and GDP uncertainties (Figure 6.2).
- Uncertainties associated with costs have a growing impact, peaking in the late 2030s, due to their ability to slow down or speed up technology roll-out. These uncertainties fall to 2050 as sectors such as surface transport, buildings, and industry almost completely decarbonise.
- The impact of inventory and GWP uncertainties is largest initially (when emissions are highest) and falls in line with falling emissions across sectors. It remains considerable by 2050, however, because sectors such as agriculture and land use (which play an important role in the 2050 balance of emissions) are among those with the largest uncertainties from the inventory and GWP.
- Population and GDP uncertainties increase in the 2020s as potential variation in these trends exceeds the pace of emissions reduction in our pathway, but then reduce as emissions in key sectors fall quickly.
- The impact of the climate (global average temperature) uncertainty on buildings emissions remains relatively stable until 2035, after which it steadily decreases to approximately zero in 2050 due to the decarbonisation of buildings.
- Uncertainties associated with CCS capture rates grow steadily from 2035, in line with the roll-out of CCS, and become a significant source of uncertainty in 2050.
| Figure 6.1 Impact of key sources of long-term uncertainty on the Balanced Pathway |
 Description: The total uncertainty from the factors quantified in this analysis is relatively steady along the pathway (in absolute terms). However, the makeup of uncertainties changes over time, and the relative uncertainty increases as emissions fall. Source: Climate Change Committee (CCC) analysis. Notes: (1) In combining uncertainties to form the total, uncertainties from different sources are assumed to be uncorrelated apart from population and GDP, but uncertainties from a given source are assumed to be correlated between sectors (except for inventory uncertainties). Other sources of uncertainty exist but are not included in this analysis. (2) The GDP uncertainty for aviation includes both UK and overseas GDPs and the uncertainty in the elasticities with which demand reacts to prices. |
| Figure 6.2 Uncertainty breakdown by source in 2040 |
 Description: Cost uncertainties, including fuel prices and some technology costs, have the largest impact in the Seventh Carbon Budget period. These are followed by uncertainties around global warming potentials (GWPs) and population and GDP. Source: CCC analysis. Notes: (1) The chart shows the impact of these six sources of uncertainty on annual emissions in 2040 (the middle year of the Seventh Carbon Budget period). (2) The GDP uncertainty for aviation includes both UK and overseas GDP and the uncertainty in the elasticities with which demand reacts to prices. (3) Other sources of uncertainty exist but are not included in this analysis. |
Uncertainty by sector
Aviation and agriculture have the highest emissions in the Balanced Pathway in 2040, and they also have large associated uncertainties that are mostly attributable to uncertainties on GDP (including price elasticity) and GWP100 emissions factors, respectively (Figure 6.3). The aviation uncertainties presented in this analysis only include uncertainties on aviation demand and not on the roll-out of technology or fuels. There is considerable uncertainty from these sources that is outside the scope of this analysis.
| Figure 6.3 Uncertainty breakdown by sector in 2040 |
 Description: Uncertainties on emissions vary by sector. Aviation and agriculture have the highest emissions in the Balanced Pathway in 2040, and they also have large associated uncertainties. Source: CCC analysis. Notes: (1) The chart shows the total uncertainty from the factors considered in this chapter for each sector – population and GDP growth, greenhouse gas inventory, global warming potentials, fuel and technology costs, climate impacts, and carbon capture rates. Other sources of uncertainty exist but are not included in this analysis. Some sectors with low emissions in 2040 are omitted. (2) The aviation uncertainties only include uncertainties on aviation demand and not on the roll-out of technology or fuels. (3) There is considerable uncertainty from these sources that is outside the scope of this analysis. |
6.3 Short-term uncertainties
6.3.1 Potential impact of year-to-year variability
Shorter-term variability due to factors such as weather and economic shocks can cause year-on-year changes in emissions.
Weather variation
Our modelled pathways for electricity supply and buildings are susceptible to change through weather impacts. In colder weather, emissions from heating buildings will increase, although this dependence will reduce as gas boilers are replaced by heat pumps. Year-to-year weather variation also affects electricity supply emissions. For example, periods of lower wind lead to higher reliance on unabated gas. We have considered this in our electricity supply modelling (see Section 7.5).
- This creates more risk for targets that are set as single-year values (such as NDCs) than for five-year totals (such as carbon budgets), as there is a lower probability of several adverse years occurring consecutively (Table 6.1).
| Table 6.1 Impact of uncertainty due to weather variation on average annual emissions in target periods |
||||
|---|---|---|---|---|
| Target | Average annual emissions in the Balanced Pathway (MtCO2e) | Buildings temperature uncertainty (MtCO2e) | Electricity supply weather adversity uncertainty (MtCO2e) | Combined uncertainty (MtCO2e) (% of target) |
| 2030 NDC (excl. IAS) |
259.8 | ±4.7 | ±2.5 | ±7.2 (2.8%) |
| 2035 NDC (excl. IAS) |
154.9 | ±3.0 | ±2.2 | ±5.3 (3.4%) |
| Sixth Carbon Budget (2033– 2037) | 188.8 | ±1.4 | ±1.0 | ±2.4 (1.3%) |
| Seventh Carbon Budget (2038– 2042) | 106.6 | ±0.7 | ±0.9 | ±1.6 (1.5%) |
| Net Zero (2050) | -1.1 | ±0.1 | ±0.3 | ±0.4 |
| Notes: (1) The combined weather uncertainty conservatively assumes that the sectoral uncertainties are correlated. (2) Emissions for carbon budgets are given as the average annual emissions over the five-year period. | ||||
Economic shocks
Short-term economic shocks can disrupt behaviours across the economy. GDP correlates with emissions in several sectors, so changes in the economy will impact the pathway.
- Economic shocks, for example recessions, can have the effect of reducing emissions in the short term and limiting growth in sectors that are sensitive to GDP. For example, the global financial crisis of 2007 to 2008 triggered a UK recession which reduced GDP.[225] This contributed to a 9% drop in emissions in 2009 compared to 2008, although there was a partial rebound in emissions the following year.
- The other potential impacts of an economic shock are disruption to trade or a downturn in investment, both of which could hinder the roll-out of key technologies. This could have longer-term consequences for the pace of future decarbonisation. Recent examples include:
- The COVID-19 pandemic suppressed the new car market and disrupted manufacturers’ semiconductor supply chains.[226] As a result, the market remained suppressed for several years, slowing the pace at which new vehicles (including EVs) were able to enter the fleet and potentially resulting in older, more polluting vehicles remaining on the road for longer.
- The invasion of Ukraine caused disruption in the supply of elements that feed into battery supply chains. This led to a slight temporary increase in battery prices in 2022.[227] The situation also drove earlier EU investment in renewables and increased support for electric heating projects to replace imports of natural gas from Russia.[228];[229]
6.4 Contingency actions and options to go further
6.4.1 Contingency framework
As shown above, there are a range of uncertainties that could affect the pathway to Net Zero. In addition, there is risk that policies could fail to deliver the expected levels of emissions reduction. In either case, it is important to monitor both the emissions trajectory and the underlying indicators of progress (see Chapter 5), as well as factors such as GDP, population, the GHG inventory, and costs, to enable early identification of a long-term risk of underperforming on emissions reduction. Any credible plan to deliver the Seventh Carbon Budget needs to include contingency options to address these risks.
While short-term uncertainties are harder to plan for, five-year carbon budgets reduce short-term risks, especially if higher than expected emissions occur in the early years of the budget, as these could be addressed in the later years.
Contingency options are action plans that can be implemented to deliver additional emissions reductions to make up for shortfalls in the pathway. A credible contingency framework should include:
- A set of measures that could deliver a substantial amount of additional emissions reduction over the period of the target in question.
- A robust understanding of the timescales required to implement each of these measures, and the steps that would need to be taken.
- Some options that could be implemented in the short term, to allow differing responses depending on how far in advance things are known to be moving off track.
- Preliminary steps for certain contingencies to keep these options open in case required.
- An effective monitoring framework which can identify the potential for delivery to fall off track at an early stage.
In this section, we illustrate some potential contingency measures. These are not comprehensive.
6.4.2 Examples of potential contingency actions
We have modelled a range of additional actions that could be used as contingencies or to go further than our Balanced Pathway. The appropriate actions, and the scale of potential impact, vary depending on the timing of the target that they are designed to support. While we give greatest focus to contingency actions for the Seventh Carbon Budget (as the focus of this advice), it is important to develop contingencies for all of the UK’s emissions targets consistent with Net Zero (i.e. the 2030 and 2035 NDCs, the Sixth Carbon Budget, and Net Zero).
Contingency actions for the Seventh Carbon Budget
For the Seventh Carbon Budget, the most important contingencies are likely to be those to accelerate roll-out of low-carbon heating and EVs, including through scrappage. Accelerating deployment of engineered removals could also be an option at this point in the pathway (Figure 6.4).
It is important to consider credible delivery timelines in planning a contingency framework for meeting this budget. While some contingencies could be implemented several years in advance if a risk of emissions falling off track has been identified proactively, contingencies should ideally also be available to implement on shorter timescales. This should include contingencies that can be implemented just before or during the target period.
- As we approach the Seventh Carbon Budget period, EVs and heat pumps will make up 100% of all new cars and heating systems sold. Therefore, the biggest opportunities for contingencies come from measures that can accelerate the rate of stock turnover.
- Scrappage schemes that incentivise owners of older, less efficient fossil fuel cars and boilers to replace these before end-of-life can be implemented relatively quickly, subject to market capacity. It makes sense to implement such schemes once the new low-carbon technology markets have scaled up to become the dominant choice. Early scrappage in these areas is not included in the Balanced Pathway but could provide an option to go faster or to catch up if emissions reductions fall off track.
- Implementing these could deliver sizeable emissions savings by helping the fleet switchover sooner, although there would be some cost in both the fiscal incentives needed and the lost asset life, as well as a risk of increasing imported emissions due to embedded production emissions. For older cars, the emissions savings and the falling costs of EVs mean that some level of early scrappage is likely to be cost effective and reduce emissions, including embedded emissions.[230]
- Earlier action to enable these markets to scale up sooner, such as the incentives to grow consumer demand and investment in supply chains, could also have a sizeable effect in reducing emissions by increasing the number of EVs and heat pumps that have been sold by the time of the Seventh Carbon Budget.
- If the expected sales growth of EVs does not materialise, contingencies to support demand in the market should be considered, for example, low-cost financing for cars and vans.
- As aviation will be one of the UK’s highest-emitting sectors by the Seventh Carbon Budget period, measures to manage demand could also offer sizeable additional emissions savings, especially if sustainable aviation fuel has not scaled up as planned.
- If technology is not on track to deliver what is required for the Seventh Carbon Budget and Net Zero in the near term, or if aviation sector emissions are not developing in line with Net Zero, the Government and the aviation industry will need to be ready to implement more demand management policy. The Government also has a role to ensure the distributional impacts of demand management are considered.
- Other demand-side measures could also be effective, in particular increased resource and energy efficiency in industry and waste. Other options could include measures to encourage people to switch to alternatives to meat more quickly, stronger action to increase recycling rates, and reducing food waste.
- By the Seventh Carbon Budget period, our analysis shows that engineered removals will need to be operating at scale. Therefore, accelerating their deployment could offer another contingency option.
- One option could be to allow more biomass imports in our pathway, for example to allow bioenergy with carbon capture and storage (BECCS) hydrogen to displace around 10% of blue hydrogen production, subject to constraints on the amount of biomass that can be sustainably supplied (see Section 7.7 and Section 10.2).
- Direct air carbon capture and storage (DACCS) should also be in use by this point, so there may also be some scope to accelerate its deployment. It is estimated that it will take around six to eight years for a new CCS project to go from inception to capture.[231]
| Figure 6.4 Impact of potential contingency options on average annual emissions during the Seventh Carbon Budget period |
 Description: The largest sources of contingency for the Seventh Carbon Budget come from measures to accelerate roll-out of low-carbon heating and electric vehicles. Source: CCC analysis. Notes: (1) The contingencies are coloured by sector – see the legend for more information. (2) The average annual emissions during the Seventh Carbon Budget period is 106.6 MtCO2e. |
Contingency actions for the UK’s other emissions targets
Key contingencies for the other target periods include:
- The 2030 NDC: incentives to grow demand for EVs; accelerated action to deliver a decarbonised power system; measures to incentivise people to choose public transport or active travel instead of driving.[232]
- The Sixth Carbon Budget and 2035 NDC: incentives and early scrappage schemes to accelerate the switch to EVs; investment to scale up heat pump supply chains more quickly; stronger regulation or incentives for resource efficiency in industry.
- Net Zero: accelerated deployment of DACCS; increased demand-side measures in aviation and agriculture; planting of higher-yielding trees (although the long lag from planting to sequestration means that this would need to be enacted around 10–20 years in advance, and concerns around biodiversity and sustainability impacts mean we do not recommend this).
A combination of contingency actions may be required to compensate for large shortfalls in emissions reductions or to make up shortfalls that span across different target periods (Box 6.1).
| Box 6.1 Example applications of contingency options |
| As part of considering contingency options, it is also useful to consider possible scenarios in which these options might be required. For example, emissions reductions may be at risk of falling off track as a result of one of the long-term uncertainties discussed in Section 6.1, progress monitoring may indicate that roll-out rates are not proceeding as projected, or contingencies may be needed as a result of different policy choices. This box discusses some examples of how contingencies could apply in these cases.
EV uptake Heat pump roll-out No BECCS in electricity supply Our pathway includes the use of a limited amount of BECCS in the electricity supply sector. If the Government were to choose to pursue a pathway without any BECCS in electricity supply, this would leave shortfalls to be made up in the engineered removals and electricity supply sectors:
|
Chapter 7: The Balanced Pathway by sector
This chapter discusses what the Balanced Pathway looks like for each sector, setting out the key measures that combine to reduce emissions, the costs and cost savings, and the priority actions required to deliver the pathway.
The sectors covered in this chapter are:
- Surface transport (Section 7.1).
- Residential buildings (Section 7.2).
- Industry (Section 7.3).
- Agriculture and land use (Section 7.4).
- Electricity supply (Section 7.5).
- Aviation (Section 7.6).
- Fuel supply (Section 7.7).
- Waste (Section 7.8).
- Non-residential buildings (Section 7.9).
- Shipping (Section 7.10).
- F-gases (Section 7.11).
- Engineered removals (Section 7.12).
7.1 Surface transport
Key messages
Today: surface transport is currently the highest-emitting sector in the UK economy. In 2023, surface transport accounted for 24% of UK emissions, 102.8 MtCO2e.
CB7 period: by 2040, surface transport emissions fall by 86% in the Balanced Pathway, relative to 2023. Surface transport will account for 14.9 MtCO2e of UK greenhouse gas (GHG) emissions and will be the UK’s fourth highest-emitting sector.
By 2050: this sector can almost completely decarbonise through rapid electrification.
Our key messages are:
- Electric vehicles (EVs) will be the main source of decarbonisation. By the middle of the Seventh Carbon Budget period, over three-quarters of cars and vans on the road, along with a fast-growing number of heavy goods vehicles (HGVs), will be EVs. There will be no hydrogen cars or vans, and very little or potentially even no role for hydrogen in heavier vehicles.
- Electric cars and vans become cheaper than internal combustion engine (ICE) vehicles by the late 2020s, both in terms of upfront and running costs. The changes in surface transport are cost saving for the country and households.
- The zero-emission vehicle (ZEV) mandate is supporting the transition to EVs through legally binding targets on the share of cars and vans sold in the UK that must be zero-emission. The Balanced Pathway assumes that, under current vehicle price expectations and with a supportive policy landscape, sales exceed the minimum levels set by the mandate.
- Charging infrastructure will be critical to supporting rapid uptake of EVs. Along with continued roll-out, it will also be important to reduce the cost of charging and simplify payment methods.
- The Government needs to provide clarity on the phase-out date for ending the sale of new petrol and diesel vehicles, which provides a backstop to the ZEV mandate. The Government’s intent to restore the phase-out date for new petrol and diesel cars to 2030 is welcome. The Government should also confirm the 2040 phase-out for new diesel HGVs, restore the 2030 date for vans, and consider including hybrid cars in the phase-out.
- The Government should work with major van fleet operators to better understand the barriers to electric van take-up, which is lagging, and quickly implement policies to overcome them. Financial support will be needed in the early years to stimulate uptake of electric HGVs and charging infrastructure.
- Local authorities will require funding and powers to deliver better public transport and walking and cycling infrastructure. These travel modes increase in our pathway, bringing the UK closer in line with countries such as Switzerland, Germany, and the Netherlands.
7.1.1 Emissions in surface transport
Emissions in surface transport were 102.8 MtCO2e in 2023. It has remained the UK’s highest-emitting sector since 2015. In 2023, 95% of surface transport emissions came from cars (59%), HGVs (19%), and vans (18%), with smaller shares from other vehicles including buses, motorcycles, and rail.
- Emissions were relatively flat between 1990 and 2019. Following a steep decline during the COVID-19 pandemic, emissions rebounded by 2021, but at a lower overall level. In 2023, emissions were 10% below 2019 levels.
- A typical medium-sized car was 39% less carbon intensive in 2023 than in 1990.[233] However, the reduction in emissions from increased vehicle efficiency has been offset by a trend towards large cars and SUVs. This trend also has implications for the embodied emissions of manufacturing cars.
- Strong recent progress on electric car sales has started to have a small positive contribution towards emissions reduction in the sector, with nearly one million EVs on UK roads in 2023, making up 2.8% of the entire car fleet.[234]
- Car traffic steeply declined during the COVID-19 pandemic. This fall and the subsequent recovery have resulted in a reduction in per-capita car-kilometres in 2023 to 7% below pre-pandemic levels, caused by embedded changes to travel and working patterns, such as hybrid working and online shopping.[235] Conversely, van traffic is now higher than pre-pandemic levels, caused by an increase in online retail.[236]
7.1.2 The Balanced Pathway for surface transport
In our Balanced Pathway, surface transport emissions are projected to fall, relative to 2023 levels, by 86% to 14.9 MtCO2e by 2040 (the middle of the Seventh Carbon Budget period) and to 1.1 MtCO2e by 2050 (Figure 7.1.1). The key values that underpin this pathway are summarised in Table 7.1.1.
| Figure 7.1.1 Surface transport emissions by subsector – historical (2008–2023) and Balanced Pathway (2025–2050) |
 Description: The largest share of surface transport emissions comes from cars, followed by HGVs and vans. In the Balanced Pathway, emissions across all subsectors fall quickly, reaching close to zero by 2050. Source: Department for Energy Security and Net Zero (DESNZ) (2024) Provisional UK greenhouse gas emissions national statistics 2023; DESNZ (2024) Final UK greenhouse gas emissions national statistics 1990-2022; Climate Change Committee (CCC) analysis. Notes: Solid colours, to the right of the line, represent our modelled pathway emissions in each subsector from 2025. Pale shades, to the left of the line, show historical subsector emissions data up to 2023 and then our modelled expectations based on existing trends and policies for past years for which data are not yet available. |
| Table 7.1.1 Key values in the Balanced Pathway for surface transport |
||||||
|---|---|---|---|---|---|---|
| 2025 | 2030 | 2035 | 2040 | 2050 | ||
| Emissions | Emissions in year (MtCO2e) | 99.1 | 68.6 | 37.0 | 14.9 | 1.1 |
| Change in emissions since 1990 | -13% | -40% | -68% | -87% | -99% | |
| Change in emissions since 2023 | -4% | -33% | -64% | -86% | -99% | |
| Share of total UK emissions | 24% | 23% | 20% | 14% | ||
| Key drivers – quantity variables | Percentage of electric cars in the fleet* | 6% | 29% | 57% | 80% | 97% |
| Percentage of electric vans in the fleet* | 3% | 23% | 52% | 74% | 95% | |
| Percentage of electric HGVs in the fleet* | 0% | 6% | 31% | 63% | 93% | |
| Modal shift away from cars (car-km)† | 1% | 4% | 7% | 7% | 7% | |
| Percentage of electrified rail track | 38% | 44% | 49% | 55% | 66% | |
| Key drivers – price variables | Electric car price premium/saving‡ | 14% | -6% | -8% | -10% | -12% |
| Electric van price premium/saving‡ | 8% | -8% | -11% | -12% | -15% | |
| Electric HGV price premium/saving‡ | 102% | 57% | 46% | 33% | 30% | |
| Source: CCC analysis. Notes: We have blanked out the share of total UK emissions in 2050 because total UK emissions have reached Net Zero at this point. All costs are in 2023 prices. *Electric vehicle (EV) shares refer to fully electric vehicles only (i.e. excluding hybrids). Our EV uptake modelling is based on the actual distribution of vehicle ages. This means that there are some vehicles that remain in the fleet for a long time, resulting in a small share of petrol and diesel vehicles remaining in 2050. Based on observed data on vehicle mileages by age, these older vehicles are typically expected to drive relatively low annual mileages. †Compared to the baseline. ‡The ‘premium/saving’ is the percentage price difference between a new EV and a comparable internal combustion engine vehicle, averaged across the distribution of new vehicle sales by vehicle size. A positive value means there is a cost premium to buying an EV over an ICE vehicle; a negative value means there is a saving. Electric car prices are compared to an average petrol car. Electric van and HGV prices are compared to a diesel van and HGV respectively. |
||||||
Key elements of the Balanced Pathway for surface transport
The largest share of emissions reduction in the Balanced Pathway for surface transport comes from switching from fossil fuel vehicles to electric cars, vans, HGVs, buses, and motorcycles. This is supported by measures to reduce traffic growth, improve the efficiency of conventional vehicles, and decarbonise the rail network (Figure 7.1.2).
| Figure 7.1.2 Sources of abatement in the Balanced Pathway for surface transport |
 Description: The largest share of emissions reduction in surface transport is from switching to electric cars and vans. Contributions also come from zero-emission HGVs, other zero-emission vehicles, rail, vehicle efficiency and hybridisation, and modal shift and efficient driving. Source: DESNZ (2024) Provisional UK greenhouse gas emissions national statistics 2023; DESNZ (2024) Final UK greenhouse gas emissions national statistics 1990-2022; CCC analysis. Notes: (1) We generally account for emissions reductions due to measures to reduce demand for high-carbon activities (including low-carbon choices and efficiencies) first, before the impact of low-carbon technologies. (2) Emissions reduction due to the use of biofuels in road vehicles does not appear in this chart, because these fuels are used in both the pathway and the baseline. (3) ‘Other zero-emission vehicles’ include zero-emission buses, motorcycles, and aircraft support vehicles. |
The key measures that combine to reduce emissions in surface transport are:
Electric cars and vans (53% and 19% respectively of emissions reduction in 2040). EV sales have grown rapidly over recent years. Falling costs will make EVs an attractive option across all market segments by the late 2020s, allowing sales to increase quickly.
- By 2040, 80% of cars and 74% of vans on the road will be electric.[237] The market share of new electric cars increases from 16% in 2023 to 55% by 2027, with electric vans increasing from 6% to 34%.[238] Electric cars and vans reach around 95% of new sales by 2030 and 100% by 2035.
- While this ambitious trajectory outpaces the ZEV mandate, it is achievable – there has been strong early EV growth in the UK and consumer awareness is high (see Chapter 5).
- This roll-out rate falls within the range of other projections (Figure 7.1.3).
- Uptake modelling suggests that sales of new EVs will increase as they become relatively less expensive than ICE vehicles at the point of purchase, and when there is increased confidence in these technologies. Availability of cheap and reliable charging (including for households without off-street parking) is needed to increase consumer confidence.
- Falling costs, primarily due to cheaper batteries, are a key driver of EV uptake. EVs are assumed to reach price parity with ICE vehicles between 2026 and 2028, depending on vehicle size.[239];[240] The prices of EVs have been falling quickly, and the lifetime cost of an EV is already lower than a comparable ICE vehicle for many drivers due to lower running and maintenance costs.[241]
- Used EVs have now reached upfront price parity with their ICE counterparts.[242]
- Plug-in hybrid electric vehicles (PHEVs) do not play a central role in our pathway, although they continue to be taken up in small numbers until 2035 (5% of sales over this period). Real-world performance of PHEVs indicates that these often result in lower emissions savings than previously expected, so the Government should consider including PHEVs in the ICE phase-out date.[243]
- Sales of electric vans have been slower to pick up than cars. This is partly due to there being fewer electric van than car models. The continued development of charging infrastructure will be key in increasing commercial confidence in electric vans, but further action to remove barriers to uptake is likely to be needed.
- Good progress has been made in the roll-out of EV chargers, which should in turn increase consumer confidence and EV uptake.
- From 2022 to 2023, the number of public chargers grew by 45% to 54,000.[244] Continued growth is needed to reach around 300,000 by 2030 and over 550,000 by 2040, to support charging during longer journeys and those who cannot charge at home.
- However, the cost of public charging and limited payment methods, especially for those who cannot charge at home, could be a barrier to EV take-up. There is also a need to ensure adequate charge point provision in every area of the country.
- It will likely eventually become cost-ineffective to maintain a widespread petrol fuelling network. While we have not modelled this, it would impact the feasibility of fossil fuels for general use, which could result in a rapid shift away from ICE vehicles towards the end of the transition.
| Figure 7.1.3 EV uptake in the Balanced Pathway compared to the ZEV mandate and forecasts from other sources |
 Description: Electric vehicle uptake follows a similar growth profile to other projections. Uptake in the Balanced Pathway is faster than Bloomberg and SMMT projections, Norway’s observed EV sales shares delayed by eight years, and the ZEV mandate, but slower than projections by Carbon Tracker/New Automotive. Source: Statens Vegvesen (2024) Updated status for zero-emission vehicles; Bloomberg New Energy Finance (2023) EV Outlook; Society of Motor Manufacturers and Traders (SMMT) (2021) SMMT new car market and parc outlook to 2035 by powertrain type at 11 June 2021; Department for Transport (DfT) (2023) Zero emission vehicle mandate and CO2 regulations: joint Government response cost benefit analysis; Carbon Tracker (2023) Electric drive to survive: the automotive energy transition; CCC analysis. |
Zero-emission HGVs (12% of emissions reduction in 2040). Operators of HGVs are expected to switch to zero-emission options. Battery-electric options are likely to be suitable for most use-cases.
- While the market development of zero-emission HGVs is at an earlier stage than electric cars and vans, manufacturers are now launching electric models.[245] Developments in technology and charging infrastructure since our Sixth Carbon Budget advice suggest that electric models are likely to be suitable for most use-cases and offer lower lifetime cost:
- EV battery prices have fallen in recent years, with a rapid further decrease projected by 2030. Conversely, progress on fuel cell costs has been slower than expected.[246] Many manufacturers are setting out plans to launch and scale up their electric HGV offer.[247];[248];[249]
- There is promising early progress on the roll-out of public charging infrastructure for battery-electric HGVs. The majority of HGV movements occur along a limited number of corridors connecting major logistics centres. Government support is expected to deliver 25 sites by the end of 2026.[250]
- Roll-out in our pathway scales up from the late 2020s, with 63% of HGVs in the fleet being electric by 2040. The Government’s commitment to a 2040 phase-out date for ending the sale of new ICE HGVs (with a 2035 phase-out date for smaller HGVs) sends a strong signal to industry to research and invest in zero-emission HGVs.
- However, it is likely that incentives will be needed in the early years to support businesses with the higher upfront cost of zero-emission HGVs if this level of uptake is to be achieved. There are other barriers to battery-electric HGV uptake that need to be addressed:
- Battery-electric HGVs are heavier than their ICE counterparts due to the weight of the battery. Under current weight restrictions, this may require an increase in HGV journeys to transport the same payload for some heavy goods and could therefore increase HGV-kilometres. While this can be mitigated to some extent by allowing heavier HGVs on strategic roads, current commercial demonstrations will need to establish the best approaches to make battery-electric HGVs commercially viable across the sector.
- Sufficient infrastructure will also be required to allow HGVs to charge en route and at journey endpoints while meeting tight delivery schedules. As many warehouses and depots are not owned by HGV operators, there will need to be a collaborative approach to establishing a network of depot chargers. It will also be critical to reduce delays in securing connections to the electricity grid.
- Our pathway assumes battery-electric vehicles are the option chosen to decarbonise all HGVs. However, there is still some uncertainty regarding the exact make-up of technologies in the fleet that will meet requirements for specific long-distance journeys or for particularly heavy cargoes. As freight travels across borders, it will be important to keep up with developments in Europe and ensure UK HGV infrastructure aligns with these.
- Our modelling does not assume that road freight shifts onto rail. This could aid decarbonisation of the freight sector in the short term and reduce congestion. However, zero-emission HGVs are expected to become available across the road haulage sector sooner than it will be possible to completely remove diesel from rail freight. This is due to the limitations of other rail technologies and the likely need for diesel-electric hybrids to service certain routes.
Other zero-emission vehicles (3% of emissions reduction in 2040). This includes buses, coaches, and motorcycles, as well as aircraft support vehicles. Various bus operators have already switched parts of their bus fleets to zero-emission technologies. This trend will continue to accelerate.
- The share of buses that are zero-emission grows from 1% in 2023 to 18% by 2030 and 60% by 2040. Local routes will be largely served by battery-electric vehicles. Long-distance routes and coaches face similar challenges to HGVs, so decarbonise more slowly. Local authorities are playing a leading role in the decarbonisation of buses and will require further support.
- The share of motorcycles that are zero-emission grows from 2% in 2023 to 89% by 2040.
Modal shift and efficient driving (9% of emissions reduction in 2040). Enabling people to choose alternatives to driving can reduce emissions and deliver a range of co-benefits, as can more efficient driving. More will need to be done to encourage a further shift away from cars towards alternative modes of travel.
- Improvements to make buses and active travel more attractive, affordable, and accessible allow 7% of car demand to be switched to public transport and active travel by 2035, compared to the baseline. This is an ambitious assumption on modal shift, underpinned by evidence on interventions in leading countries, such as Germany and the Netherlands and in towns and cities across the UK.[251];[252];[253];[254]
- Modal shift in our pathway is primarily driven by a move to buses, cycling, and walking. Transformative rail projects are unlikely to be delivered before 2035, after which all new cars will be electric and the emissions-saving potential from modal shift declines substantially.
- The Government may wish to go further on modal shift for reasons beyond emissions reduction, such as reducing congestion and energy demand. We explore a contingency for a further 3% of car demand to be switched to public transport or active travel by 2035, compared to the baseline (see Chapter 6).
- We also assume small improvements in average driving efficiency through improved speed limit compliance and eco-driving training for HGV drivers.
- We assume that the trend of increasing van-kilometres slows down in the baseline. This should be monitored.
Conventional vehicle efficiency (1% of emissions reduction in 2040). While EV sales are still growing, it is important to reduce the CO2 intensities of the conventional vehicles still being sold.
- In line with the Government’s consultation on the ZEV mandate, we assume a 2% improvement in the efficiencies of new ICE cars and vans each year.[255] We also assume that these efficiency improvements will be extended to HGVs, for which this improvement will be particularly important as new diesel vehicles are sold until 2040. This can be achieved through measures such as light-weighting and increasing hybridisation.
- For cars, much of the improvement in vehicle efficiency in the last few decades has been offset by the shift towards larger vehicles.[256] We assume that the distribution of new car sales across vehicle size segments remains constant at today’s levels throughout the Balanced Pathway, counter to recent trends. Policy intervention may be needed to limit further vehicle size increases.
- We assume biofuels continue to be blended into petrol and diesel, reducing emissions from those ICEs still in the fleet. These savings decrease as the vehicle fleet switches to electric. Blending of biodiesel, predominantly used in HGVs and vans, increases as production using the Fischer-Tropsch process scales up in the 2030s.
- Some old vehicles and classic ICE cars will remain in the fleet in 2050 and contribute to low levels of residual emissions, as these vehicles are not typically driven long distances. There may be an additional role for biofuels here, however, we have not modelled this.
Rail decarbonisation (1% of emissions reduction in 2040). Rail travel is already relatively low carbon.
- This can be further improved by increasing the share of electrified track on which a growing number of electric trains can travel. Our pathway also has a small role for hydrogen-powered and battery-electric trains in the medium term. Together, this allows for all fully-diesel trains to be removed from both passenger and freight operations by 2040. Diesel-electric hybrids continue to operate on non-electrified freight routes until 2050.
- Some coal in heritage railways will continue to be required until a viable low-carbon fuel is found. Currently, no such alternative exists, and heritage railways continue to produce residual emissions in our pathway.[257]
Key indicators for surface transport
The key indicators of the changes required to deliver the Balanced Pathway for surface transport include metrics on the rate of uptake and costs of EVs, the roll-out of public charge points, and road transport demand (Figure 7.1.4).
|
Figure 7.1.4 Key indicators for the surface transport sector |
|
|

| Box 7.1.1 Surface transport in the citizens’ panel |
| The Committee convened a citizens’ panel to explore what an accessible and affordable vision of Net Zero looks like for households (see Chapter 8 for further details). Among other topics, the panel explored how the switch from petrol and diesel cars to electric cars and the reduction in car-kilometers through modal shift could be achieved in a way that is accessible and affordable for all households. The panel was presented with results from the Committee’s distributional impacts model (see Section 8.3), which explores the costs and cost savings associated with different policies for different household archetypes (brought to life in the form of illustrative household personas).
The panel expressed a readiness to switch to electric cars, but often only if better charging infrastructure is available and if/once costs of electric cars achieve upfront purchase price parity with petrol and diesel cars, or with support on upfront costs. Panel members:
The panel saw modal shift as a desirable option if made accessible and affordable to all households. Panel members wanted better public transport infrastructure in rural areas and a reduction in ticket prices, especially for families and when travelling by train. |
7.1.3 Costs, cost savings, and co-impacts
Delivering the Balanced Pathway for surface transport results in a cost saving to the economy compared to the baseline (Figure 7.1.5). Cost savings are driven by EVs, which give savings in capital and operating expenditure across most of the pathway. Costs in the pathway are driven by charging infrastructure, the upfront price premium of zero-emission HGVs and buses, and rail electrification. Until price parity is reached, the upfront price premium of electric cars and vans also contributes to costs.
- Electric cars and vans: after the date of price parity between EVs and ICEs is reached (2026 to 2028), electric cars and vans deliver capital cost savings. This is driven by a decrease in EV manufacturing costs, especially the battery component.[258] EVs are much more energy efficient than fossil fuel vehicles and have fewer moving parts requiring maintenance. As a result, they also deliver substantial operating cost savings.
- The upfront price of an electric car, based on comparing EVs against comparable ICE vehicles and averaging across all car size segments, was 37% higher than a petrol car in 2023. Prices have fallen quickly over the past decade.
- Another analysis of a representative sample of seven car models with electric and ICE equivalents found that for these cars, electric models were only 12% more expensive than their petrol counterparts in 2024.[259];[260]
- HGVs and buses: upfront costs of zero-emission HGVs and buses are higher than the diesel options they replace in our pathway. Depending on the speed of global development of these technologies, costs could fall more quickly than we have assumed, potentially resulting in cost savings. Zero-emission HGV and bus operating costs are lower than operating costs for diesel vehicles, although incentives on the upfront price premium are likely to be needed to deliver lifetime cost savings for operators over the next 10 to 15 years.
- Charging infrastructure: costs for installing charging infrastructure (both home and public chargers) increase until the early 2030s then slowly decline. Costs will continue to be incurred for scaling up the network to meet growing demand, operation and maintenance, and developing a network for charging HGVs.
- Rail electrification: while the costs of electric trains are similar to the costs of diesel trains, the cost of track electrification means that decarbonising rail transport leads to net costs which peak around 2035. Rail electrification leads to operating cost savings.
Our pathway also offers substantial cost savings for consumers, due to the greater efficiency of EVs. EVs and modal shift also offer a range of co-benefits (see Chapter 8).
- Costs to consumers: while EVs currently cost more to purchase than petrol cars and face higher insurance costs, their lower running costs and the fact that they do not incur fuel duty mean their total costs over a year are already similar to total costs for ICEs for many consumers. Cost comparisons depend on annual mileage, car type, and charging infrastructure used (home or public charging) and for some consumers EVs are already cheaper than ICEs on a lifetime basis.[261] We assume that between 2026 and 2028 EVs will become cheaper on an upfront basis and will continue to offer lower running costs. This will be true even without accounting for fuel duty. Figure 7.1.6 compares annual costs of owning and running EVs and ICEs in 2023 and 2030.
- The main barriers to switching to EVs are likely to be their upfront price relative to ICE vehicles (in the near term), the time taken for a robust supply of EVs to flow through to used car markets, and access to home charging.[262] Consumers on lower incomes or with no access to off-street parking are therefore likely to be the last to switch to EVs.
- Continuing to drive an ICE vehicle towards the end of the transition will be more expensive and could also be increasingly challenging as petrol stations become less prevalent. It will be important to ensure these consumers are not negatively affected by the transition.
- There are a range of policy options available to mitigate these risks including improving access to home charging and social leasing schemes which can be targeted to support those at the tail-end of the EV transition. Policies such as these would also help to reduce the associated residual emissions from ICEs.[263]
- The lower cost of motoring for electric cars is assumed to lead to an increase in car-kilometres in our analysis, which more than offsets the overall reduction due to modal shift. Although there is uncertainty around the degree to which this will happen, this increases the electricity demand from EVs in our analysis and could have a significant impact on congestion. It will be important to monitor this rebound effect and consider whether policies to control any increases in driving brought about by EVs are needed.
- Fiscal impacts: as petrol and diesel vehicles are phased out, fuel duty revenue will fall sharply. Replacing this is a matter for government, which could be dealt with through general taxation or a switch to an alternative transport tax. These, like other transfers, are not counted within our overall costs.
- Manufacturing competitiveness: UK manufacturers will need to continue to adapt to the transition to EVs for both domestic and international markets for the UK’s car industry to remain globally competitive (Box 7.1.2).
- Health benefits: switching to active forms of travel, such as walking and cycling, will offer health and wellbeing benefits. Widespread uptake of zero-emission vehicles will deliver improvements in air quality (particularly reductions in nitrogen oxides and carbon monoxide) and noise reduction.[264]
| Figure 7.1.5 Costs and cost savings in the Balanced Pathway for surface transport, compared to the baseline |
 Description: The Balanced Pathway becomes cost saving for surface transport by 2027, and total cost savings gradually increase out to 2050. These cost savings are driven by EVs, which give savings in capital and operating expenditure across most of the pathway. Source: CCC analysis. Notes: (1) Capex is additional capital expenditure and opex is additional operating expenditure. Both are additional in-year costs in 2023 prices, relative to a baseline of no further decarbonisation action. (2) The ‘other’ category includes buses, motorcycles, and airport support vehicles. |
| Figure 7.1.6 Annual cost comparison for new electric and petrol cars in 2023 and 2030 |
 Description: In 2023, the total annual cost of an electric car was roughly £250 more than a petrol car, due to higher upfront vehicle and insurance costs. By 2030, annual electric car costs are expected to be lower than petrol cars due to lower vehicle and running costs. Source: CCC analysis. Notes: (1) Vehicle capital costs are annualised across a 15-year lifetime at an 8.9% interest rate. All taxes and duties are included here. (2) Electric vehicle (EV) insurance costs are assumed to be 13% higher than ICE costs in 2023, but decrease to match ICE levels in 2030 as EV prices fall. (3) For this chart, annual distances driven are the same for EVs and petrol cars and consistent across 2023 and 2030. |
| Box 7.1.2 UK vehicle exports and imports |
| UK auto manufacturers have made good progress in growing their EV offers, and many have commitments to expand their EV range or phase out petrol and diesel vehicles entirely.[265];[266];[267] This is driven by international trends, as the vehicle market is international. The UK’s ZEV mandate and ICE phase-out dates apply to vehicles sold in the UK (rather than those manufactured in the UK) and have contributed to this change.
The UK is both an exporter and importer of vehicles, as vehicles made in the UK and abroad cater to different market segments. Cars are the UK’s second largest goods export, with 80% of vehicles made in the UK exported.[268];[269] 7% of vehicles produced in the UK are EVs, of which 24% are sold domestically. In comparison, 21% of non-EVs produced in the UK are sold domestically.[270] More than 90% of cars registered in the UK in the first half of 2023 were manufactured abroad.[271]
The share of Chinese-made electric vehicles sold in the UK could expand as cheaper models enter the market, for example BYD’s new low-cost Seagull supermini model is expected to reach UK markets in 2025.[275] Stellantis is also set to sell cheap electric cars in the UK, made by Chinese partner Leapmotor.[276] The EU, US, and more recently Canada have imposed tariffs on Chinese-made EVs to protect domestic industries. Tariffs on imported vehicles increase costs for consumers. A recent analysis of UK automotive manufacturing by the CBI concluded that EVs will be ‘fundamental to the future prosperity of the UK automotive sector, which could vary in size by up to £50 billion in gross value added’ depending on different industry scenarios.[277] |
7.1.4 Key actions required to deliver the Balanced Pathway for surface transport
Delivering the Balanced Pathway in surface transport will depend on continuing progress in building key markets combined with effective government policy. Most major vehicle manufacturers are already switching to producing EVs. Consistent policy is needed to ensure the enablers of both production and consumer demand are in place. It will also be important to extend progress beyond cars. The key actions that are needed are as follows:
- Implement regulations requiring that all new cars and vans sold after 2030 must be able to travel a significant distance using electrical power alone. Clarity on and effective implementation of phase-out dates for ending the sale of new petrol and diesel cars and vans is essential for the transition to EVs. Legislation will be required to establish ambitious targets for the ZEV mandate from 2031 to 2035 if hybrids are still allowed post 2030.
- Improve the availability and reduce the cost of local public charging for drivers who do not have access to private off-street parking, to make local public charging more comparable to charging at home.
- Develop further policies and incentives to accelerate zero-emission van uptake, working with major van fleet operators to understand and overcome barriers to uptake such as charging and access to finance.
- Design and implement a regulatory mechanism requiring sales of zero-emission HGVs to scale up to meet the 2040 end-of-sales date for new diesel HGVs (2035 for smaller HGVs) and provide purchase subsidies where required.
- Develop a strategy to deliver the required charging infrastructure for heavy-duty vehicles, including HGVs and buses. This would give operators confidence to invest in new technologies. This should include guidance on establishing new grid connections, delays to which currently pose a significant barrier to ZEV uptake.
- Provide local authorities with long-term funding and powers to deliver increases in public transport, walking, and cycling. Long-term clarity is also needed on what funding streams will be available to implement plans and additional powers for local areas to deliver an integrated public transport offer.
- Highlight the benefits of zero-emission vehicles. Government and industry should actively provide information on the benefits of EVs. Many consumers are unaware that EVs could already be cost saving for them on a lifetime basis (depending on annual distance driven, car type, and whether they have access to home charging) and are unaware how rapidly upfront EV prices are falling.[278] They can also be unaware of the extent of charging availability and misinformed about battery longevity and EV lifecycle emissions.[279]
7.2 Residential buildings
Key messages
Today: the residential buildings sector is currently the second highest-emitting sector in the UK economy. In 2023, residential buildings accounted for 12% of UK emissions, 52.2 MtCO2e.
CB7 period: by 2040, residential buildings emissions fall by 66% in the Balanced Pathway, relative to 2023. Residential buildings will account for 17.7 MtCO2e of UK GHG emissions and will be the UK’s third highest-emitting sector.
By 2050: this sector can almost completely decarbonise through electrification of heating and appliances.
Our key messages are:
- Electrification of heating is central to eliminating emissions from homes. Heat pumps will be the dominant low-carbon heating technology, with a limited role for other electric heating options. There is no role for hydrogen heating in residential buildings.
- Energy efficiency measures are an important part of our pathway, providing near-term reductions in emissions and energy demand, and lower fuel bills. Energy efficiency measures also reduce fuel poverty and deliver health benefits.
- A rapid increase in deployment of low-carbon heating and energy efficiency measures is essential. The UK is behind many other similar countries in rolling out heat pumps. Energy efficiency measures have also been delivered at a much slower rate than required. But experience in similar countries shows rapid uptake is possible with the right incentives in place.
- Households will need better incentives to adopt low-carbon heating, including cheaper electricity. Uptake will need to be incentivised through a combination of regulations and financial support. Loans and grant funding will be necessary for some households to meet the upfront costs, and incentives or regulations will be required for landlords to ensure tenants in private rented housing can access low-carbon heating.
- Supply chains for low-carbon heating and energy efficiency need to be scaled up rapidly. The domestic heating industry urgently needs to develop a workforce with the skills to design, install, and service heat pumps at scale.
7.2.1 Emissions in residential buildings
Emissions in residential buildings were 52.2 MtCO2e in 2023, making it the UK’s second highest-emitting sector (Figure 7.2.1). This is 35% lower than 1990 levels.[280]
- The largest source of emissions (96%) is the use of fossil fuels for space heating and hot water.
- The main fossil fuel used for heating and hot water is gas (80% of emissions), with a smaller role for oil and liquefied petroleum gas (LPG) (12%). Since 1990, there has been a reduction in emissions from solid fuels, from 21% of total emissions in 1990, to 4% in 2023.
- Emissions in residential buildings have gradually decreased since the early 2000s. This decrease has been driven by policies to improve the efficiency of heating technologies and deliver investments in building fabric efficiency.[281];[282];[283]
- There has been a sharp fall in emissions since 2021, driven by very high gas prices and mild winters.
7.2.2 The Balanced Pathway for residential buildings
In our Balanced Pathway, emissions from residential buildings are projected to fall, relative to 2023 levels, by 66% to 17.7 MtCO2e by 2040 (the middle of the Seventh Carbon Budget period) and to 0.4 MtCO2e by 2050 (Figure 7.2.1). The key values that underpin this pathway are summarised in Table 7.2.1. Our analysis uses heating emissions in 2019 as a starting point for calculating the baseline. This was an average temperature year and was prior to the COVID-19 pandemic and the energy crisis (the long-term impacts of which are uncertain).
| Figure 7.2.1 Residential buildings emissions by subsector – historical (2008–2023) and Balanced Pathway (2025–2050) |
 Description: Residential buildings emissions have been gradually falling, with large year-to-year variation due to temperature as almost all emissions are from heating and hot water. In the Balanced Pathway, emissions fall to nearly zero by 2050. Source: DESNZ (2024) Provisional UK greenhouse gas emissions national statistics 2023; DESNZ (2024) Final UK greenhouse gas emissions national statistics 1990-2022; CCC analysis. Notes: (1) Solid colours, to the right of the line, represent our modelled pathway emissions in each subsector from 2025. Pale shades, to the left of the line, show historical subsector emissions data up to 2023 and then our modelled expectations based on existing trends and policies for past years for which data are not yet available. The grey line shows temperature-adjusted historical emissions. (2) There was a significant drop in emissions from residential buildings between 2021 and 2023 due to warmer-than-average winters and record high energy prices. Our pathway assumes that some of this reduction was a direct response to the weather and prices and will therefore only be short-term. It is assumed that the rest of this reduction is due to energy-saving practices that will be maintained into the future, such as reducing boiler flow temperatures, adjusting thermostats, and other measures to reduce energy bills. |
| Table 7.2.1 Key values in the Balanced Pathway for residential buildings |
||||||
|---|---|---|---|---|---|---|
| 2025 | 2030 | 2035 | 2040 | 2050 | ||
| Emissions | Emissions in year (MtCO2e) | 58.5 | 51.4 | 35.2 | 17.7 | 0.4 |
| Change in emissions since 1990 | -27% | -36% | -56% | -78% | -99% | |
| Change in emissions since 2023* | +12% | -2% | -33% | -66% | -99% | |
| Share of total UK emissions | 14% | 17% | 19% | 16% | ||
| Key drivers – quantity variables | Proportion of homes with a heat pump | 2% | 6% | 26% | 52% | 80% |
| Proportion of homes with a low-carbon electrified heating system | 9% | 16% | 39% | 68% | 100% | |
| Deployment of ‘big’ energy efficiency measures (cumulative, millions)† | 0.2 | 4.6 | 5.5 | 5.5 | 5.5 | |
| Deployment of ‘small’ energy efficiency measures (cumulative, millions)‡ | 0.6 | 14.0 | 32.2 | 34.7 | 34.7 | |
| Key drivers – price variables | Capital cost of first-time 12 kW air source heat pump installation (£ thousands)§ | 10.9 | 10.3 | 9.6 | 8.9 | 7.5 |
| Source: CCC analysis. Notes: We have blanked out the share of total UK emissions in 2050 because total UK emissions have reached Net Zero at this point. All costs are in 2023 prices. *Emissions in 2023 were lower than expected due to a warmer-than-average year and high energy prices. †’Big’ energy efficiency measures include loft insulation, wall insulation, and floor insulation. ‡’Small’ energy efficiency measures include a variety of low-cost measures, including draught-proofing and hot water tank insulation. §Excludes any ancillary costs such as a hot water tank or radiator upgrades. |
||||||
Key elements of the Balanced Pathway for residential buildings
Residential buildings are almost fully decarbonised by 2050. Replacing fossil fuel heating systems with low-carbon, electric heating technologies is central to eliminating emissions from homes (Figure 7.2.2). Most homes also receive small energy efficiency improvements (such as draught-proofing), while big energy efficiency improvements are installed in 17% of homes.
| Figure 7.2.2 Sources of abatement in the Balanced Pathway for residential buildings |
 Description: The largest share of emissions reduction in residential buildings is from the electrification of heat, in both existing and new homes. Energy efficiency improvements and the continuation of some energy-saving practices also play an important role. Source: DESNZ (2024) Provisional UK greenhouse gas emissions national statistics 2023; DESNZ (2024) Final UK greenhouse gas emissions national statistics 1990-2022; CCC analysis. Notes: (1) We generally account for emissions reductions due to measures to reduce demand for high-carbon activities (including low-carbon choices and efficiencies) first, before the impact of low-carbon technologies. (2) There was a significant drop in emissions from residential buildings between 2021 and 2023 due to warmer-than-average winters and record high energy prices. Our pathway assumes that some of this reduction was a direct response to the weather and prices and will therefore only be short-term. It is assumed that the rest of this reduction is due to energy-saving practices that will be maintained into the future, such as reducing boiler flow temperatures, adjusting thermostats, and other measures to reduce energy bills. |
The key measures that combine to reduce emissions in residential buildings are:
Low-carbon heating (66% of emissions reduction in 2040). Low-carbon heating is installed in all homes by 2050. In our pathway, this is all electric with no role for hydrogen in home heating (Box 7.2.2). Heat pumps will play a key role, primarily as standalone systems, but also within communal systems, and it is essential that their deployment accelerates rapidly.
- In the Balanced Pathway, the share of existing homes with low-carbon heating increases from 8% in 2023 to 68% by 2040. The majority of these homes are heated by a heat pump (either an individual heat pump or a communal system). This share grows from around 1% in 2023 to 52% by 2040.
- The optimum mix of electric technologies is sensitive to assumptions about their costs and performance. Uncertainties around these, and the incentives faced by homeowners, mean that the real-world deployment mix is likely to vary from our estimates.
- The mix of technologies and rates of deployment vary across different parts of the UK, depending on the types of housing stock and existing heating systems. Low-carbon heating is more cost effective in homes which currently use more expensive fuels, such as oil, so areas with a high proportion of homes on expensive fuels decarbonise faster.
- Individual heat pumps (75% of low-carbon heating systems installed by 2040). Heat pumps are the dominant solution for replacing fossil fuel heating systems. These mostly consist of air source heat pumps (94% of the heat pumps installed by 2040), with a smaller role for ground source heat pumps (0.4%) and hybrids (6%).[284]
- Heat pumps extract heat from the air or ground, allowing them to provide more energy than they consume in electricity. This allows energy demands for space heating and hot water to be met using electricity, while minimising electricity demand and energy bills.
- In our pathway, annual heat pump installations in existing homes increase rapidly. 60,000 heat pumps were installed in 2023, and this rises to nearly 450,000 in 2030, reaching around 1.5 million by 2035.[285] Installation rates do not exceed natural replacement cycles – the replacement of a heating system at the end of its life.
- Growth in consumer demand and installer capacity, rather than manufacturing capacity, are the primary constraints on deployment.
- Reaching this rate by 2035 means that, on average, all heating systems can be replaced by 2050 without requiring assets to be scrapped early. This aligns with a 2035 phase-out date for ending the sale of new gas boilers.
- The UK is significantly behind on heat pump installations compared to other European countries, consistently installing fewer than 1,000 heat pumps per million people each year (Figure 7.2.3).[286] The UK has a similar reliance on gas for heating to the Netherlands, which installed nearly 6,000 heat pumps per million people in 2022.[287] Our assumed compound growth rate for heat pump deployment, which increases to a maximum of 42%, is based on the rate of scale-up observed across a range of other European countries.
|
Figure 7.2.3 Comparison of heat pump roll-out rates across Europe |
|
|

- Communal heat pumps (3% of low-carbon heating systems installed by 2040). Communal heat pumps offer a solution for decarbonising flats and terraced houses.
- Communal heat pumps are shared systems serving a single block of flats or row of terraced houses. They combine a communal air source or ground source heat pump, shared distribution pipework, and individual heat pumps within properties (to boost the heat delivered by the shared pipework).
- Communal heat pump systems are smaller in scale than district heat networks and serve a relatively small number of properties. This means they can be procured by building owners or groups of homeowners, without requiring centralised coordination.
- We assume that deployment of communal heat pumps is limited by the same supply and demand constraints as individual heat pumps.
- Low-carbon heat networks (9% of low-carbon heating systems installed by 2040). Homes are connected to heat networks when they are located in an area where low-carbon district heating is likely to be cost effective.
- Low-carbon heat networks (or district heating) connect multiple buildings to a centralised low-carbon heating source using a network of underground pipes. They enable the use of heat from large-scale sources such as waste industrial heat, water bodies, and sewage, and can incorporate large heat pumps.
- They vary in scale, from carrying heat a few hundred metres to nearby homes, to several kilometres across a whole town.
- They will primarily be located in dense urban areas with large non-residential buildings as anchor loads, particularly where there are existing large-scale heat sources.
- Heat networks are complex projects requiring large-scale planning and investment. Individual homes are connected via an internal heat interface unit. They are particularly suited to dense areas and space-constrained homes, where individual air source heat pumps may be problematic.
- We assume deployment of heat networks in homes is aligned to the deployment rate in non-residential buildings (see Section 7.9). This requires construction of low-carbon heat networks to increase from current low rates.
- Existing heat networks are converted to low-carbon heat sources from 2025, with 40% of existing heat networks converted by 2030 and all converted by 2040.
- Low-carbon heat networks (or district heating) connect multiple buildings to a centralised low-carbon heating source using a network of underground pipes. They enable the use of heat from large-scale sources such as waste industrial heat, water bodies, and sewage, and can incorporate large heat pumps.
- Direct electric heating (13% of low-carbon heating systems installed by 2040). Direct electric heating is deployed in homes with lower heat demand, particularly where heat pumps may not be an appropriate solution. Approximately 8% of homes already use direct electric heating.
- Direct electric heating systems include electric resistive heaters and storage heaters for space heating, and immersion heaters and point-of-use heaters for hot water.
- These heating systems have significantly lower capital costs than heat pumps, but are much less efficient, meaning running costs are higher. In some homes with lower heat demand, this can mean that total lifetime costs are lower for direct electric systems.
- Supply chains are already well established, and annual installation rates reach 210,000 by 2035 in our pathway.
- The high electricity consumption of direct electric heating limits the role it can play in decarbonising homes, due to the impact it would have on household energy bills and the scale and cost of the power system.
Energy efficiency (10% of emissions reduction in 2040). Energy efficiency measures are primarily deployed wherever the value of energy savings over their lifetime exceeds the costs of installation.
- Energy efficiency measures include draught-proofing, loft insulation, floor insulation, cavity wall insulation, and solid wall insulation. These measures reduce heating energy demand by reducing the rate of heat loss through the building fabric.
- In 83% of homes, the most cost-effective approach to reducing emissions via energy efficiency involves low-cost measures such as insulating hot water tanks and basic measures such as draught-proofing. The majority of homes with lofts or cavity walls are already insulated to varying standards.[288] In the Balanced Pathway:
- Most of the emissions reductions due to energy efficiency come from widespread small energy efficiency measures.
- Additional loft insulation or top-up loft insulation is installed in 9% of homes with lofts, such that all these homes have insulation by the mid-2030s.
- Cavity wall insulation is installed in 16% of homes with cavity walls, such that 87% of these homes have insulation by the mid-2030s.
- Solid wall insulation is generally not cost effective and is only installed in around 15,000 homes.
- Supply chains for energy efficiency are not tied to those for low-carbon heating. Energy efficiency measures can be deployed ahead of low-carbon heating, reducing emissions from existing heating systems.
- Improvements to energy efficiency complement the installation of low-carbon heating systems, however they are not necessarily a requirement.
- Energy efficiency measures reduce the energy demand and system sizes of low-carbon heating, reducing the capital costs and operating costs associated with low-carbon heating; reducing electricity demand; and lowering household bills.
- Energy efficiency measures reduce the peak heat demand of homes, allowing heat pumps to operate at lower flow temperatures (with or without radiator upgrades) which improves their efficiency.
New homes (14% of emissions reduction in 2040). The Balanced Pathway assumes that all new homes are highly efficient and have low-carbon heating systems.
- The assumption that all new homes have low-carbon heating systems aligns with planned government policy, and our analysis compares to a baseline in which they are assumed to be built with gas boilers.
- Our pathway assumes no new homes are built with fossil fuel heating systems or gas grid connections, which would add to emissions and increase overall costs by requiring retrofitting later.
Lighting, electrical appliances, and other household appliances (1% of emissions reduction in 2040). The Balanced Pathway assumes that all domestic energy-using products are decarbonised and/or replaced with more efficient equivalents by 2050.
- Lighting and appliances are replaced with more efficient equivalents, including LED lightbulbs and higher-efficiency appliances, such as refrigerators and ovens. These are assumed to be replaced as they reach the end of their life.
- Gas cooking appliances and petrol or diesel-powered garden machinery are phased out and replaced with electric equivalents from the mid-2030s, although this could be implemented more quickly.
Energy-saving practices (9% of emissions reduction in 2040). Our pathway assumes that some of the emissions reduction between 2021 and 2023 were due to energy-saving behaviours that will be maintained into the future, such as reducing boiler flow temperatures, adjusting thermostats, and other steps to reduce energy bills.
Key indicators for residential buildings
The key indicators of the changes required to deliver the Balanced Pathway for residential buildings include metrics on the roll-out of low-carbon heating, installation rates of energy efficiency measures, and energy costs (Figure 7.2.4).
| Figure 7.2.4 Key indicators for the residential buildings sector |
 Description: This key indicators for residential buildings in the Balanced Pathway show the proportion of homes with a heat pump and the proportion with low-carbon heating increasing, following an S-curve shape. The ratio of electricity to gas prices is reduced and heat pump installation costs fall gradually. Home insulation measures are deployed rapidly over the coming years. Source: Historical data from EHPA, DESNZ, and BSRIA; CCC analysis. Notes: (a) The chart shows the share of existing homes that are heated by a heat pump in each year, including homes with individual heat pumps and those connected to communal heat pump systems. This share does not include homes connected to low-carbon heat networks (some of which will use heat pumps). (b) This includes all electrified low-carbon heating. (e) The range represents the effect of two policy approaches to reducing the price of electricity that we have considered in our distributional analysis (see Chapter 8). (f) The pathway shows the cost of a first-time heat pump installation in a typical property, excluding any ancillary costs such as a hot water tank or radiator upgrades. There is limited historical data on the cost of heat pump installations. The data shown are likely an underestimate: the average cost of an air source heat pump installed under the Boiler Upgrade Scheme since its inception is £13,000. |
| Box 7.2.1 Residential buildings in the citizens’ panel |
| The Committee convened a citizens’ panel to explore what an accessible, attractive, and affordable vision of Net Zero looks like for households (see Chapter 8 for further details). Among other topics, the panel explored how the switch to heat pumps and the installation of home insulation measures can be achieved in a way that is accessible and affordable for all households. The panel was presented with results from the Committee’s distributional impacts model (see Section 8.3), which explores the costs and cost savings associated with different policies for different household archetypes (brought to life in the form of illustrative household personas).
The panel expressed a willingness to switch to heat pumps and install home insulation, but often only if upfront costs are made affordable and considerable concerns about the new heating technology are addressed, including ensuring better information is available and the installation process is made easier. Panel members:
|
| Box 7.2.2 Why hydrogen will not be used to decarbonise home heating |
| Hydrogen is not a viable fuel for widespread decarbonisation of home heating, and hydrogen boilers and hydrogen heat pump hybrids are not included in the Balanced Pathway.
Using hydrogen for home heating would delay direct emissions reduction and significantly increase indirect emissions from the sector. While heat pump installations can be scaled up immediately, hydrogen will not be available for widespread uptake over the next decade. Future supplies of low-carbon hydrogen are constrained, and the required production and distribution infrastructure could not be delivered at scale until the mid-2030s.
Converting domestic gas supplies to hydrogen would also present a difficult coordination exercise, requiring a vast programme to enable all homes in particular areas to safely switch from natural gas to hydrogen simultaneously. Every home within each conversion area would need to be accessible on a specific day, to modify and safety-check appliances. Public acceptance of this seems unlikely. The resources required for such a programme could be deployed more beneficially on other aspects of the Net Zero transition. |
7.2.3 Costs, cost savings, and co-impacts
There are substantial capital cost requirements to delivering the Balanced Pathway for residential buildings (Figure 7.2.5). These costs are driven by the additional capital cost of low-carbon heating systems, and capital costs peak in 2036, when roll-out of low-carbon heating technologies reaches the natural replacement rate across all homes.
- Low-carbon heating: a large proportion of the capital costs are a one-off, upfront investment.
- The upfront costs fall over time as the cost of a new installation gradually declines. There is potential for innovation in the market to drive these costs down more quickly.
- As low-carbon heating systems become the norm, there is potential that the upfront costs of this change will be increasingly reflected in relative house prices, providing an incentive to change systems.
- As the market matures, non-fuel maintenance costs for low-carbon heating systems are likely to become similar to those of gas boilers.
- In our modelling, the magnitude of the operating costs or savings for a low-carbon heating installation depends on the specific heating system installed and the ratio of electricity to gas prices (see Chapter 8).
- There is uncertainty on how heat pump efficiencies may improve in the future, with improvements leading to reduced operating costs. Our analysis uses recent evidence on in-situ performance of heat pumps.[289];[290]
- Energy efficiency: energy demand reduction measures deliver reductions in operating costs. The installation of energy efficiency measures also contributes to upfront capital costs in the early years of our pathway.
Energy efficiency measures and low-carbon heating systems have additional social benefits beyond the operating savings they provide. The co-benefits include reduced reliance on gas imports (see Section 10.2), reduced household energy bills (see Section 8.3), and improved air quality. These deliver benefits in relation to energy security, health, and fuel poverty (Box 7.2.3).
|
Figure 7.2.5 Costs and cost savings in the Balanced Pathway for residential buildings, compared to the baseline |
|
|
 Description: Upfront capital costs are consistently high in residential buildings throughout the Balanced Pathway, compared to a low opex saving. Costs peak in 2036, when low-carbon heating is being rolled out at the natural replacement rate. Energy efficiency contributes to capital costs in the early years.
| Box 7.2.3 Impacts of the Balanced Pathway on fuel poverty |
| Households are considered to be in fuel poverty if they spend a high proportion of their income on heating bills (precise definitions vary across England, Scotland, Wales, and Northern Ireland). This can be caused by one or more of: households living in energy inefficient homes, facing high fuel prices, and having low incomes.
Governments across the UK have varying targets for reducing fuel poverty, for example in England the Government aims to ensure that as many fuel poor homes as is reasonably practical achieve a minimum energy efficiency rating of EPC C by 2030. The transition provides an opportunity to reduce levels of fuel poverty in the UK, as insulating homes and installing low-carbon heating systems will make homes more energy efficient and we expect electricity prices to fall as renewables deployment progresses.
Government schemes such as the Energy Company Obligation have supported households in fuel poverty to insulate their homes and switch to low-carbon heating. This targeted support can help progress against both delivering the Balanced Pathway and government fuel poverty targets. The level of energy efficiency measures in the Balanced Pathway is based on our assessment of a cost-effective pathway for reducing emissions only. Given other government priorities such as meeting its fuel poverty targets, the Government may assess that additional action on the energy efficiency of fuel poor homes is needed. |
7.2.4 Key actions required to deliver the Balanced Pathway for residential buildings
Delivering the Balanced Pathway in residential buildings will depend on growing the market for low-carbon heating, delivering energy efficiency measures in existing homes, and ensuring that all new homes are built with low-carbon heating systems. It is also important to consider opportunities to reduce the risks of overheating in existing homes, prioritising passive cooling and behaviour change.[292] All of this requires policy certainty, with a clear, long-term framework of regulation and financial incentives which provide clarity to homeowners and enable installers to respond. The key actions required are as follows:
- Make electricity cheaper by removing levies and other policy costs from domestic electricity bills, to help incentivise consumers to switch to lower-carbon electric options. This can be achieved by removing policy costs from electricity prices (see Chapter 8) and decarbonising the electricity system (see Section 7.5).
- For heat pumps to become an attractive option, they need to offer households savings on their fuel bills. Evidence from other countries suggests that heat pump uptake can increase dramatically when they are cheaper to run than gas boilers.
- Confirm that there will be no role for hydrogen in home heating.
- Reinstate regulations so that beyond 2035 all heating systems installed are low carbon.
- Existing regulatory frameworks require reform to incentivise take-up of electrified heating, including reforms to consumer protection, landlord regulations, planning policies, and Energy Performance Certificates (EPCs).
- New policies may be required which mandate the installation of electrified heating systems in certain categories of homes at specific times, such as when a heating system requires replacement, or around the time a home is sold.
- Provide long-term certainty that upfront costs will not present a barrier to the ramp-up in roll-out of heat pumps, ensuring that the transition is affordable and accessible to households.
- Our analysis shows that heat pumps are likely to have higher upfront capital costs for a considerable period of time. Assistance with these capital costs will therefore continue to be required to support the development of the market.
- Assistance with capital costs could include government funding, through schemes such as the Boiler Upgrade Scheme, and discounted private finance schemes such as green mortgages or zero-interest loans.
- Provide long-term funding for energy efficiency improvements to social housing and targeted support to ensure that poorly insulated homes are not a barrier to uptake of low-carbon heating systems for low-income households.
- Put in place requirements on housing developers ensuring no new properties completed from 2026 are connected to the gas grid. Deliver changes to Building Regulations with stringent transition arrangements which ensure that, from 2026 at the latest, all new homes are built with low-carbon heating systems.
- Develop and implement an engagement strategy to provide clear information to households. Steps should be taken to counter misinformation about heat pumps in the media, and to provide accurate information to households to build trust.
- Provide policy certainty to support development of supply chains for electrified heating and support installers to invest in skills and innovation. The Government needs to provide a long-term policy framework to support growth in the market for electrified heating. This will give installers the confidence to invest in increasing capacity, developing skills, and delivering innovations in technology and business models.
- Phase out fossil fuel household appliances and machinery. Alternatives to gas cookers and petrol or diesel-powered garden machinery are readily available. Induction hobs and battery lawnmowers are better and more efficient than their fossil fuel equivalents. Fossil fuel appliances and machinery could be easily phased out by regulations on their sale.
7.3 Industry
Key messages
Today: industry is currently the third highest-emitting sector in the UK economy. In 2023, industry accounted for 12% of UK emissions, 51.8 MtCO2e.
CB7 period: by 2040, industry emissions fall by 78% in the Balanced Pathway relative to 2023, with broadly the same mix of industrial output. Industry will account for 11.2 MtCO2e of UK GHG emissions and will be the UK’s fifth highest-emitting sector.
By 2050: this sector can almost completely decarbonise, mostly driven by electrification.
Our key messages are:
- Industrial decarbonisation presents an opportunity to boost investment in manufacturing and gain a competitive advantage in low-carbon production. This will need a supportive policy environment to enable manufacturers to remain globally competitive while decarbonising and avoid the risk that energy-intensive manufacturers leave the UK.
- Electrification is the main route to decarbonising industry in our pathway, but both carbon capture and storage (CCS) and hydrogen also have essential roles.
- Industrial electricity costs need to be reduced relative to the price of gas to deliver our Balanced Pathway. Electricity prices relative to international competitors will affect the competitiveness of UK industry.
- The time required to upgrade electricity grid connections must be reduced. Electrification could decarbonise a wide range of industries both within and beyond industrial clusters, provided electricity grid connections are upgraded swiftly.
- CCS is important for tackling process emissions. It should be targeted at those industrial subsectors with limited alternatives, in particular cement and lime. The Government should investigate the potential contribution of carbon capture and use, particularly for industrial sites with small volumes of process emissions.
- Hydrogen will play a small but important role in subsectors such as ceramics and chemical production, which may find it hard to electrify.
- Manufacturers must decide soon how to decarbonise and need to understand how their different options will be incentivised. The Government should set out how it will ensure appropriate incentives and availability across electricity, hydrogen, and CCS.
7.3.1 Emissions in industry
Emissions in industry were 51.8 MtCO2e in 2023. This is 63% lower than 1990 levels. The subsectors with the largest contributions to industrial emissions in 2023 were chemicals (8.2 MtCO2e) and iron and steel (8.1 MtCO2e).[293]
- The main cause of the reduction in industry emissions since 1990 is the steep decline in UK production of some of the most emissions-intensive materials. For example, the tonnage of steel produced fell from 17.8 Mt in 1990 to 5.6 Mt in 2023 and the tonnage of cement fell from 14.7 Mt to 7.7 Mt.[294];[295] In addition, several large chemicals plants have closed since 2020, including both of the UK’s ammonia plants, with high gas prices a major factor.[296]
- Since the 1990s, there has been a structural shift in UK industry towards less carbon-intensive but higher-value industrial output, such as pharmaceuticals and aerospace. Between 1998 and 2022, the gross value added from UK industry grew by 26% in real terms, while the energy consumption for each unit of output by value fell by 45%.[297];[298]
- The closure of one of the UK’s remaining integrated steelworks and the expected closure of the second will lead to a fall in emissions of at least 8 MtCO2e compared to 2023.[299] The owners plan to build electric arc furnaces at both sites, which will maintain steel production in the UK. However, this will lead to thousands of job losses and adverse effects on local communities. The failure to plan ahead for this change is worrying. It will be important to develop proactive, long-term plans for other areas that may be adversely impacted by the Net Zero transition so that alternative sources of good employment can be identified.
7.3.2 The Balanced Pathway for industry
In our Balanced Pathway, industry emissions are projected to fall, relative to 2023 levels, by 78% to 11.2 MtCO2e by 2040 (the middle of the Seventh Carbon Budget period) and to 3.6 MtCO2e by 2050 (Figure 7.3.1). The key values that underpin this pathway are summarised in Table 7.3.1.
| Figure 7.3.1 Industry emissions by subsector – historical (2008–2023) and Balanced Pathway (2025–2050) |
 Description: Industry emissions have fallen significantly since 2008, with most industrial subsectors contributing to the reduction. In the Balanced Pathway, emissions fall further to less than 4 MtCO2e by 2050. The chemicals subsector accounts for nearly half of residual industry emissions in 2050. Description: Industry emissions have fallen significantly since 2008, with most industrial subsectors contributing to the reduction. In the Balanced Pathway, emissions fall further to less than 4 MtCO2e by 2050. The chemicals subsector accounts for nearly half of residual industry emissions in 2050.Source: DESNZ (2024) Provisional UK greenhouse gas emissions national statistics 2023; DESNZ (2024) Final UK greenhouse gas emissions national statistics 1990-2022; CCC analysis. Notes: Solid colours, to the right of the line, represent our modelled pathway emissions in each subsector from 2025. Pale shades, to the left of the line, show historical subsector emissions data up to 2023 and then our modelled expectations based on existing trends and policies for past years for which data are not yet available. |
| Table 7.3.1 Key values in the Balanced Pathway for industry |
||||||
|---|---|---|---|---|---|---|
| 2025 | 2030 | 2035 | 2040 | 2050 | ||
| Emissions | Emissions in year (MtCO2e) | 44.6 | 31.4 | 21.1 | 11.2 | 3.6 |
| Change in emissions since 1990 | -69% | -78% | -85% | -92% | -97% | |
| Change in emissions since 2023 | -14% | -39% | -59% | -78% | -93% | |
| Share of total UK emissions | 11% | 11% | 11% | 10% | ||
| Key drivers – quantity variables | Index of industrial GVA (2023 = 100)* | 101 | 103 | 108 | 115 | 128 |
| Total industrial energy use (TWh) | 280 | 231 | 211 | 205 | 196 | |
| Percentage of industrial energy use supplied by electricity | 30% | 36% | 47% | 61% | 73% | |
| Industrial heat pump electricity demand (TWh) | 0 | 9 | 16 | 23 | 54 | |
| Percentage of industrial energy use supplied by hydrogen | 0% | 2% | 3% | 5% | 8% | |
| Million tonnes of CO2 captured and stored | 0 | 1.4 | 4.2 | 6.7 | 9.2 | |
| Percentage of non-road mobile machinery not powered by fossil fuels | 3% | 33% | 56% | 74% | 97% | |
| Key drivers – price variables | Industrial heat pump – cost per capacity of thermal output (£/kW) | 680 | ||||
| Source: CCC analysis.Notes: We have blanked out the share of total UK emissions in 2050 because total UK emissions have reached Net Zero at this point. All costs are in £2023 real. *GVA = gross value added. The index of industrial GVA is based on UK Government figures in its Energy and Emissions Projections. The index does not take account of the effect of the resource efficiency measures in our pathway, which would reduce overall demand for materials. | ||||||
Key elements of the Balanced Pathway for industry
The largest share of emissions reduction in the Balanced Pathway for industry is from the electrification of heat processes. This is complemented by fuel switching to hydrogen, which is a useful option where cost-effective electrification options are not available. There is also a limited amount of fuel switching to bioenergy, which we prioritise for subsectors that deploy CCS and as an interim option for non-road mobile machinery. CCS is important for dealing with industrial process emissions that cannot be avoided by fuel switching. Resource efficiency and energy efficiency reduce industrial emissions by reducing demand for materials and energy respectively (Figure 7.3.2). Abatement solutions vary significantly across industrial subsectors (Box 7.3.1).
| Figure 7.3.2 Sources of abatement in the Balanced Pathway for industry |
 Description: The largest share of emissions reduction in industry is from electrification. Contributions also come from CCS, hydrogen, resource efficiency, energy efficiency, and biomass. Description: The largest share of emissions reduction in industry is from electrification. Contributions also come from CCS, hydrogen, resource efficiency, energy efficiency, and biomass.Source: DESNZ (2024) Provisional UK greenhouse gas emissions national statistics 2023; DESNZ (2024) Final UK greenhouse gas emissions national statistics 1990-2022; CCC analysis. Notes: (1) We generally account for emissions reductions due to measures to reduce demand for high-carbon activities (including low-carbon choices and efficiencies) first, before the impact of low-carbon technologies. (2) The industry baseline is based on the UK Government’s Energy and Emissions Projections, with an adjustment to remove the effect of efficiency and climate policy. The decline in baseline emissions to 2032 reflects recent trends, while the subsequent rise to 2050 reflects government assumptions about a future increase in industrial output. Industry also delivers CO2 removals through BECCS (0.8 MtCO2e in 2050), but we account for these in our engineered removals pathway, rather than the industry pathway. |
The key measures that combine to reduce emissions in industry are:
Electrification (57% of emissions reduction in 2040). This is the most important measure in the industry pathway. Industry already uses large amounts of electricity to power machinery and other equipment. Electrification in our pathway relates to more extensive use of electricity for heat processes.
- There is growing recognition that electrification of heat should be the main route to decarbonising industry.[300] There are electrical alternatives to most types of fossil fuel-fired heating equipment used in industry. These technologies include electric boilers, electric ovens, electric furnaces in the glass subsector, and, most significantly, electric heat pumps which could produce a large part of industry demand for low-temperature heat. The potential role of heat pumps in industrial electrification is explained in Box 7.3.2.
- Most of the iron and steel subsector decarbonises in the 2020s through electric arc furnaces, in line with the public plans of the owners of the two integrated steelworks.
- Electrical heating technologies can bring important advantages such as greater efficiency and can be safer, quieter, and easier to control. However, they require retrofitting and sometimes complex process redesign.
- In the non-road mobile machinery subsector, about half of the abatement is due to the replacement of diesel equipment with electric alternatives.
- The potential of electrification in industry echoes its central role in the decarbonisation of other sectors such as buildings and surface transport. Achieving the level of industrial electrification in our pathway will require the installation of new equipment at thousands of factories across the UK.
Carbon capture and storage (17% of emissions reduction in 2040). This measure is needed for tackling emissions from industrial subsectors with a high level of process emissions or where switching from fossil fuels is not practical or cost effective. CCS is deployed in only two industrial subsectors: chemicals, and cement and lime.
- CCS is assumed to capture both combustion emissions and process emissions. Process emissions, those unrelated to energy or combustion, comprise 75% of the captured emissions in the industry pathway. We have assumed the capture rate of CCS technologies to be 90% until 2040, and 95% from 2041 onwards.
- Achieving the CCS trajectory in our industry pathway relies on the establishment of CO2 storage locations and rapid construction of pipelines to connect sites. Due to the location of cement and lime and chemical sites, by 2050 our industry pathway has more than half (65%) of CCS emissions reduction happening at dispersed sites outside the industrial clusters.
- Globally there are now a handful of industrial CCS projects in operation or under development.[301]
- There are innovative types of cement whose manufacture reduces process emissions or avoids them altogether. Such cements contribute to emissions reduction in the cement subsector via our resource efficiency measures (see below). With further development, they may have the potential to play an even greater role and reduce the role of CCS.
- Our modelling does not include any options for carbon capture and use (CCU), where carbon emissions are permanently stored through mineral carbonation. CCU could make a valuable contribution, particularly in subsectors where the volume of process emissions is too small to justify a dedicated CCS pipeline.
Hydrogen (7% of emissions reduction in 2040). Most gas-fired industrial processes could in principle be converted to run on hydrogen. Switching to hydrogen has a meaningful role in four subsectors in our pathway: chemicals, glass and other minerals, iron and steel, and non-road mobile machinery.
- For many industrial processes, electrification is a better option than hydrogen because of its greater efficiency and availability. However, there remains a role for hydrogen where electrification is either impractical or not cost effective. Examples include:
- Manufacture of high-volume ceramics, such as bricks, where there is currently no commercialised equivalent to a gas-fired tunnel kiln.
- The chemicals subsector, where electric alternatives to some equipment such as steam crackers are at an early stage of commercialisation and would require a much higher level of capital investment than converting to hydrogen. However, the optimal decarbonisation route for many chemicals processes is still uncertain.
Bioenergy (5% of emissions reduction in 2040). Many industrial processes could in principle be converted to run on bioenergy. We prioritise bioenergy for areas where it brings the most benefit.
- Industry currently uses around 25 TWh of bioenergy. We constrained the future availability of bioenergy to industry as there are higher priority uses in other sectors for this scarce resource (see Chapter 10). This constraint means that industry’s use of bioenergy in our pathway falls from today’s level. Nevertheless, there is some abatement from this source as some bioenergy is transferred from subsectors that electrify to those that do not. New policies may be required to direct bioenergy to its best uses.
- We have prioritised bioenergy use for those industrial subsectors that deploy CCS, particularly cement. Combining bioenergy with CCS (BECCS) delivers CO2 removals – our industry pathway delivers 0.8 MtCO2e of removals by 2050.
- Most industrial BECCS is in the cement subsector, which decarbonises largely through CCS but also uses an increasing proportion of bioenergy.
- If this level of BECCS is to be achieved in industry, there would need to be a reallocation of bioenergy to those subsectors which deploy CCS.
- We account for the CO2 removals from BECCS in the engineered removals sector (see Section 7.12), rather than the industry sector.
- Bioenergy in the form of liquid biofuels is important in our pathway as a transition fuel for non-road mobile machinery. This becomes steadily less important as hydrogen and electrification replace biofuels, starting in the 2030s.
Resource efficiency (7% of emissions reduction in 2040). Reducing demand for materials can reduce manufacturing emissions. This can be done by material switching, reducing consumption, or producing goods with fewer material inputs.
- We assume most resource efficiency is achieved through a high level of adoption of a handful of high-impact measures. We also assume smaller improvements in resource efficiency from a range of other measures. It is possible that greater abatement could be achieved through these other measures, but further evidence is required to demonstrate how this could be delivered.
- Resource efficiency provides some abatement in all subsectors except non-road mobile machinery, but is most impactful in the cement subsector. Resource efficiency reduces emissions in this subsector by 26% by 2035, through a combination of various measures: clinker substitution in cement production; refurbishing existing buildings to avoid new builds; reducing construction waste; reducing over-design; and reusing components.
Energy efficiency (6% of emissions reduction in 2040). Using energy more efficiently reduces operating costs while cutting emissions.
- Energy efficiency plays at least a small role in all subsectors but is most significant in non-road mobile machinery. In our pathway, this source of emissions reduction is separate and additional to the efficiency improvement arising from electrification.
- Our pathway includes a plausible level of energy efficiency, taking some account of payback period. It is possible that in some subsectors greater abatement could be achieved at higher cost and with a high level of policy support.
Key indicators for industry
The key indicators of the changes required to deliver the Balanced Pathway for industry include metrics on the consumption of various fuels, fuel prices, and the roll-out of industrial heat pumps (Figure 7.3.3).
| Figure 7.3.3 Key indicators for the industry sector |
 Description: The key indicators for industry in the Balanced Pathway show substantial growth in the use of electricity, including industrial heat pumps. This leads to a more efficient system, requiring less energy per unit GVA. The use of low-carbon hydrogen and CCS both increase from zero today. Description: The key indicators for industry in the Balanced Pathway show substantial growth in the use of electricity, including industrial heat pumps. This leads to a more efficient system, requiring less energy per unit GVA. The use of low-carbon hydrogen and CCS both increase from zero today.Source: Historical data from DESNZ and ONS; CCC analysis. Notes: (a) GVA data calculated from UK Government figures on industry GVA in its Energy and Emissions Projections. (c) Hydrogen refers only to low-carbon hydrogen used as a fuel. (e) Heat pump capacity relates to electricity input: heat output will be higher. (f) The future price ratio is based on estimates of retail energy prices for manufacturers minus the climate change levy, which is also removed in historical data. The Balanced Pathway series also deducts the policy costs on electricity from which some energy-intensive manufacturers are currently exempt. In the analysis for the industry pathway, we use long-run variable costs which have a ratio similar to this series. (g) NRMM = non-road mobile machinery. The share of non-fossil fuel stock includes traditional equipment that switches to biofuels. |
| Box 7.3.1 Decarbonisation solutions in the Balanced Pathway for industrial subsectors |
| The mix of decarbonisation solutions is expected to differ across industrial subsectors (Figure 7.3.4).
Subsectors with lower-temperature heat demand (food and drink, vehicles, paper, and other industry): several industrial subsectors have predominantly low-temperature heat demand and few process emissions. These subsectors are particularly suitable for electric technologies such as heat pumps, electric boilers, and direct resistance heating. Electrification accounts for 91% of abatement by 2050 for these lower-temperature subsectors. The remaining 9% is from bioenergy, energy efficiency, and resource efficiency. Among these subsectors, paper has the slowest pathway due to its need for advanced alternatives able to match the heat output of combined heat and power plants. Cement and lime: this subsector differs from other industrial subsectors as its emissions are dominated by process emissions that cannot be abated by fuel switching. Fuel switching to electricity or hydrogen is also highly technically challenging for this subsector. For these reasons, this is the industrial subsector most reliant on CCS, which provides 62% of abatement in 2050. It is also the subsector with the most abatement from resource efficiency (22%), achieved through clinker substitution in cement and using less concrete in construction. The remaining abatement is achieved through increasing levels of bioenergy, which also allows this subsector to deliver 0.7 MtCO2e of CO2 removals once CCS is deployed. This subsector decarbonises rapidly in the 2030s as CCS pipelines are built to sites beyond the main coastal industrial clusters. In 2050, there are 0.6 MtCO2e of residual emissions, which represent the portion of emissions that CCS equipment has failed to capture. If CO2 removals through BECCS are taken into account, the subsector achieves negative emissions of -0.2 MtCO2e by 2050. Metals:
Chemicals: this subsector produces hundreds of products, of which the most significant in terms of emissions are petrochemicals such as ethylene. In our chemicals pathway, abatement in 2050 is delivered by CCS (47%), electrification (30%), and hydrogen (10%). The variety of chemical products and the subsector’s decarbonisation options makes it challenging to model. Small changes to assumptions could have large impacts on the contribution of each abatement type, without any large effect on the overall rate of decarbonisation. Feedback from industry representatives suggests that, compared to our pathway, they see a greater role for hydrogen and a smaller one for CCS. Residual emissions in 2050 of 1.6 MtCO2e are largely ongoing process emissions after electrification. Glass and other minerals:
Non-road mobile machinery: this subsector includes a wide range of machinery used in the mining, construction, ports, and waste sectors. Electrification delivers most abatement (52% in 2050), via both battery electric and tethered equipment. Electric options are increasingly becoming available, even for very large equipment.[303] Our pathway selects hydrogen options (22% of abatement in 2050) mostly where we deemed electric equipment to be impractical, such as large electricity generators and intensively used machinery. Energy efficiency also delivers important abatement in this subsector (25% in 2050), achieved through more efficient machines and operational improvements.[304] |
| Figure 7.3.4 Abatement and residual emissions from industrial subsectors in 2050 |
 Description: CCS contributes the largest share of abatement in chemicals and cement and lime subsectors. Hydrogen has the largest role in glass and other minerals. Electrification contributes the largest share of abatement in all other subsectors. Description: CCS contributes the largest share of abatement in chemicals and cement and lime subsectors. Hydrogen has the largest role in glass and other minerals. Electrification contributes the largest share of abatement in all other subsectors.Source: CCC analysis. Notes: (1) Abatement relates to baseline emissions in 2050. Baseline emissions for any subsector could be higher or lower than current levels. (2) We typically include BECCS in the removals sector but have included it here to show how BECCS contributes to abatement in industry. The inclusion of BECCS results in negative emissions in cement and lime and slightly lower residual emissions in chemicals. |
| Box 7.3.2 Industrial heat pumps can play an important role in decarbonising low-temperature industrial heat |
Industrial heat pumps are similar to heat pumps used to heat buildings. They can generate several times more heat energy than they use in electrical energy, with efficiencies between 200% and 700% depending on their specific application.[305] One of their advantages is that they can reuse heat that would otherwise be wasted in some industrial processes.
Notes: Heat pump efficiency based on various sources, including Danish Energy Agency (2022) Technology data for industrial process heat. |
7.3.3 Costs, cost savings, and co-impacts
Delivering the Balanced Pathway between 2025 and 2050 leads to an increase in sector costs compared to the baseline. In Section 7.3.4, we recommend policies to reduce the risk that this additional cost makes UK industry less competitive (see also Section 10.3 on imported emissions).
- Electrification and CCS are the biggest drivers of additional capital investment. CCS also results in additional operating cost costs, while switching to more efficient electric technologies will lead to operating savings. However, these operating cost savings will not be achieved if we fail to reduce industrial electricity prices and if the ratio of industrial electricity to gas prices remains at historical levels.
- Resource and energy efficiency measures reduce material and energy inputs, also leading to operating cost savings.
- Technology choice. Our pathway suggests that where electrification is an option, it is generally cheaper than CCS or hydrogen. The latter options should therefore generally be targeted at areas where electrification is impractical or not cost effective.
Our pathway also offers a range of additional benefits, including potential economic benefits for UK industry.
- Electrification can offer potential additional business opportunities and system-wide advantages.
- Greater electrification of industrial heat processes presents an opportunity for manufacturers to provide more demand management services to the national grid (Box 7.3.3). This could bring economic benefit to manufacturers and reduce electricity costs for all consumers. We have not modelled this potential benefit.
- An advantage of a pathway that relies largely on electrification is that all industrial sites are already connected to the electricity grid. By incentivising electrification, industrial decarbonisation policy can benefit a wider range of industry than the current approach focussed on industrial clusters. However, this depends on the timeliness of grid upgrades (see Box 7.3.4).
- Some electrified heating systems are safer to operate and easier to control and automate than combustion systems.
- Resource efficiency measures bring benefits beyond emissions reduction, by reducing a range of environmental impacts associated with material extraction and production.
- There is a potential competitive advantage for UK industry in decarbonising early. Domestic and global demand for high-carbon goods is set to fall, and low-carbon production will be the only way to stay competitive. Alongside competitive advantages for some subsectors, there are also risks of offshoring for others, which should be managed.
- To realise this potential growth, the Government must ensure that manufacturers are not at a competitive disadvantage with overseas producers and have sufficient incentives to invest in domestic decarbonisation.
- Recent experience, particularly in the chemicals subsector, shows a real risk of manufacturers leaving the UK for countries with cheaper energy or greater policy support. There is also a risk of ‘carbon leakage’, where domestic manufacturing migrates to countries with fewer restrictions on emissions.
| Figure 7.3.5 Costs and cost savings in the Balanced Pathway for industry, compared to the baseline |
 Description: The Balanced Pathway for industry leads to a net increase in cost. Electrification and CCS are the main drivers of additional capex. More efficient electric technologies lead to sizable opex savings, while CCS and hydrogen lead to additional opex costs. Description: The Balanced Pathway for industry leads to a net increase in cost. Electrification and CCS are the main drivers of additional capex. More efficient electric technologies lead to sizable opex savings, while CCS and hydrogen lead to additional opex costs.Source: CCC analysis. Notes: Capex is additional capital expenditure and opex is additional operating expenditure. Both are additional in-year costs in 2023 prices, relative to a baseline of no further decarbonisation action. |
| Box 7.3.3 Flexible industrial heat could support a clean energy grid |
| A highly electrified manufacturing sector could help balance the electricity grid, as some manufacturers have the potential to vary their usage in response to demand constraints or oversupply. This type of demand flexibility will become more valuable as the grid incorporates higher levels of variable renewable energy. It could reduce energy costs for industry and indeed for all electricity consumers (see Section 7.5).
Various electrified industrial processes could provide demand flexibility. One example is batch processes, such as steelmaking with electric arc furnaces, which can be timed to ease grid constraints.[309] Another is processes where heat energy can be stored for later use. This is already possible with equipment such as electric boilers, but there may be far greater potential for thermal energy storage in industry.
|
7.3.4 Key actions required to deliver the Balanced Pathway for industry
Delivering the Balanced Pathway in industry will depend on the removal of some major barriers. For many manufacturers, the UK Emissions Trading Scheme (UK ETS) carbon price, at whatever level, may be insufficient incentive for decarbonisation, especially if they have the option of moving production overseas. Manufacturers have an urgent need to understand how their different decarbonisation options will be supported in the long term. Investment decisions made today can lock in production methods for decades. The key actions that are needed are as follows:
- Make electricity cheaper relative to gas. Our industry pathway is unlikely to be delivered unless this barrier is addressed.
- Speed up the grid connection process to ensure businesses do not face barriers to moving to electric options (Box 7.3.4). The Government should work with Ofgem, network companies, and the National Energy System Operator to assess where industrial electrification could be constrained by grid capacity and develop investment strategies to remove this constraint.
- Set out how government will support businesses to make the transition to low-carbon production or operation and how UK businesses could decarbonise early and take advantage of growing global demand for low-carbon goods and services.
- Develop business models to support industrial electrification, ensuring businesses are incentivised to switch to electric technologies. This should play a similar role to existing business models for hydrogen and CCS in helping speed up early-stage deployment of electric technologies, complementing the role of the UK ETS in enabling decarbonisation in industry.
- Long-term certainty about government support for industrial electrification can also help overcome additional barriers to electrification such as the novelty of many types of electrical heating equipment, the long lifetime of industrial equipment, the cost of installation, and the lack of skills and supply chains to design and install.
- Maintain support for CCS and hydrogen. Our industry pathway shows that there is a role for CCS and hydrogen, particularly where electrification is impractical or not cost effective. It will be important that the Government’s ongoing support for these technologies and their supporting infrastructure continues.
- Strengthen the UK ETS to ensure that its price is sufficient to incentivise decarbonisation. This could include a higher carbon price floor and/or linkages with the EU ETS.
- Streamline planning and permitting for low-carbon technology and infrastructure. Long processes for planning and permitting are delaying implementation.[312]
- Set minimum standards for the whole-life carbon impact of products that are at risk of increasing the UK’s imported emissions. This could include new rules to measure and limit the embodied carbon of buildings.[313];[314]
- Introduce regulations, supported by subsidies if necessary, to drive decarbonisation of non-road mobile machinery. This could include regulatory measures with proven success in reducing road transport emissions.
| Box 7.3.4 Slow grid connection upgrades could delay industrial electrification |
| For industrial sites to electrify, they will need to connect high-powered equipment to the electricity network. In many cases this will require a grid connection upgrade. Acquiring such an upgrade can take several years, and manufacturers often cite these delays as a principal barrier to electrification.[315]
Despite widespread recognition of the problem of connection upgrades, there has been little quantification of its scale. However, research by the UK Energy Research Centre (UKERC) has begun to address this gap.[316] UKERC compared distribution network operators’ Network Development Plans to industrial electricity demand in the Committee’s Seventh Carbon Budget Balanced Pathway. Their analysis identified any potential shortfalls in network capacity in UK regions, as well as at the level of individual industrial sites and substations. UKERC found that:
It is clear that without further action grid connections could present a major barrier to industrial decarbonisation. More information is needed on the extent of the problem. We therefore welcome the UK Government’s commitment to ’work with Ofgem, network companies and the new National Energy System Operator (NESO) to understand where investment in grid infrastructure ahead of need may be required to match expected demand from electrifying sectors such as industrial electrification projects’.[317] Source: The results have been calculated for the CCC by the UK Energy Research Centre and the University of Leeds based on the method described in the research paper: Gailani A., Taylor P. (2024) Assessing electricity network capacity requirements for industrial decarbonisation in Great Britain. |
7.4 Agriculture and land use
Key messages
Today: agriculture is currently the fourth highest-emitting sector in the UK economy. In 2022, agriculture accounted for 11% of UK GHG emissions, 47.7 MtCO2e.[318] Net emissions from land use, land use change, and forestry (referred to as ‘land use’ from here on) are currently close to zero, at 0.8 MtCO2e in 2022.
CB7 period: by 2040, agricultural emissions fall by 39% in the Balanced Pathway, relative to 2022. Agriculture will account for 27% of UK GHG emissions and will be the UK’s second highest-emitting sector. By this point the land use carbon sink will be growing, turning the land use sector into a small net sink of 1.9 MtCO2e in 2040.
By 2050: the combined agriculture and land use sectors can reach Net Zero emissions through low-carbon farming approaches and carbon sequestration from woodland expansion and peatland restoration.
Our key messages are:
- Farmers and land managers are stewards of the land. They will play a crucial role in delivering the transition. They need to be sufficiently empowered to make the change, while also improving the climate resilience of agriculture and the natural environment.
- Farmers diversify their operations and incomes in our Balanced Pathway. While low-carbon farming practices and machinery reduce agricultural emissions, reaching Net Zero across the agriculture and land sectors requires a reduction in livestock numbers, particularly cattle and sheep. This both reduces GHG emissions and releases land, allowing a shift of activity into woodland creation, peatland restoration, and growing energy crops. Renewable energy provides a further potential new source of income.
- Policy must protect against risks of carbon leakage from agricultural imports. In the Balanced Pathway, a reduction in demand for meat and dairy in the UK avoids imports of these products increasing. Our analysis maintains the self-sufficiency ratio of UK food consumption met by UK production. Carbon border adjustment mechanisms may also be needed.
- Early action is vital to release land from agriculture and scale up tree planting to deliver the sequestration potential of new woodlands before 2050. This requires a mix of long-term government support and developing private sector markets, such as for nature services.
7.4.1 Emissions in agriculture and land use
Combined emissions in the agriculture and land use sectors reached 48.4 MtCO2e in 2022. This is 25% lower than 1990, when emissions totalled 64.8 MtCO2e.
Emissions in agriculture
Almost all combined emissions, 47.7 MtCO2e in 2022, came from agriculture. This is 12% lower than 1990 levels. The sector’s share of UK emissions has risen since 1990 from under 7% to 11% in 2022. The largest proportion of agriculture emissions is methane directly emitted from livestock.
- The reduction in emissions since 1990 has been mainly driven by non-climate polices. Successive reforms to the Common Agricultural Policy (CAP) in the 1990s and early 2000s saw livestock numbers fall and hence application of fertiliser on grassland decline. In addition, EU environmental regulations (for example the Nitrates and Water Framework Directives) to address non-GHG pollutants required changes in farming practices which also led to a reduction in GHG emissions.
- Nearly two-thirds (63%) of agricultural emissions (and all agricultural methane emissions) in 2022 were directly emitted from livestock, with 49% from the digestive process (enteric fermentation) of cattle and sheep and 14% from the management of livestock waste and manure. Agricultural soils, mainly from the application of organic and chemical fertiliser onto grassland and cropland, accounted for a further 24%. The remaining 12% was from energy use for stationary and off-road mobile machinery. These shares have been almost constant in the last 10 years.
Emissions in the land use sector
Emissions in the land use sector were 0.8 MtCO2e in 2022. This is 10 MtCO2e lower than 1990 levels. The land use sector represents a combination of land-based sources (including degraded peatlands, wetlands, and settlements) and sinks of emissions (including forestry and grasslands). Since 1990, land use sources of emissions have fallen by 25%, while sinks have increased by 20%.
- The dominant carbon sink is the forestry subsector, at -19.3 MtCO2e. The grassland subsector (representing grasslands on both mineral and organic soils) is a small net sink of ‑0.5 MtCO2e. Croplands are the main source of emissions (13.6 MtCO2e), driven by degraded peatlands under agriculture. Combined with emissions from wetlands (2.8 MtCO2e), settlements (3.9 MtCO2e), and other land use (0.2 MtCO2e), the sector is a net source of emissions.
- Land use emission reduction since 1990 was driven by high rates of tree planting in the last century, peaking in the 1970s. However, even though the carbon store has increased, this annual forest sink has since weakened due to the aging profile of forests and woodlands.
- Over the last decade, the reduction in land use emissions has plateaued, despite grasslands switching from a source to a small sink since 2017. This is due to the interaction between the ageing forest sink and declining planting rates during the 1990s and 2000s overriding reductions in other areas.[319]
7.4.2 The Balanced Pathway for agriculture and land use
The Balanced Pathway for agriculture
In our Balanced Pathway, agriculture emissions are projected to fall, relative to 2022 levels, by 39% to 29.2 MtCO2e by 2040 (the middle of the Seventh Carbon Budget period) and to 26.4 MtCO2e by 2050 (Figure 7.4.1). The key values that underpin this pathway are summarised in Table 7.4.1.
| Figure 7.4.1 Agriculture emissions by subsector – historical (2008–2022) and Balanced Pathway (2025–2050) |
 Description: Emissions from the four main sources in agriculture have remained broadly unchanged between 2008 and 2022, with the largest share coming from enteric fermentation. In the Balanced Pathway, emissions fall by nearly half by 2050. Description: Emissions from the four main sources in agriculture have remained broadly unchanged between 2008 and 2022, with the largest share coming from enteric fermentation. In the Balanced Pathway, emissions fall by nearly half by 2050.Source: DESNZ (2024) Provisional UK greenhouse gas emissions national statistics 2023; DESNZ (2024) Final UK greenhouse gas emissions national statistics 1990-2022; Scotland’s Rural College (2025); CCC analysis. Notes: Solid colours, to the right of the line, represent our modelled pathway emissions in each subsector from 2025. Pale shades, to the left of the line, show historical subsector emissions data up to 2022 and then our modelled expectations based on existing trends and policies for past years for which data are not yet available. |
| Table 7.4.1 Key values in the Balanced Pathway for agriculture |
||||||
|---|---|---|---|---|---|---|
| 2025 | 2030 | 2035 | 2040 | 2050 | ||
| Emissions | Emissions in year (MtCO2e) | 47.0 | 39.2 | 31.9 | 29.2 | 26.4 |
| Change in emissions since 1990 | -13% | -27% | -41% | -46% | -51% | |
| Change in emissions since 2022 | -1% | -18% | -33% | -39% | -45% | |
| Share of total UK emissions | 11% | 13% | 17% | 27% | ||
| Key drivers – quantity variables | Change in average meat consumption (versus 2019) | -3% | -11% | -20% | -25% | -35% |
| Changes in cattle and sheep numbers (versus 2023) | 6% | -8% | -22% | -27% | -38% | |
| Change in average crop yield (versus 2022) | 0.5% | 4% | 7% | 10% | 16% | |
| Percentage of low-carbon mobile energy use in the fleet | 0% | 1% | 16% | 36% | 93% | |
| Key drivers – price variables | Farm measures – faster finishing beef (opex savings £/1,000 head)* | 49,100 | 48,850 | 48,880 | 48,880 | 48,845 |
| Farm measures – grass-legume mix (opex savings £/1,000 hectares)† | 72,660 | 72,925 | 73,465 | 73,810 | 74,620 | |
| Source: Scotland’s Rural College (2025); CCC analysis. Notes: We have blanked out the share of total UK emissions in 2050 because total UK emissions have reached Net Zero at this point. All costs are in 2023 prices. *Faster finishing beef – reduces the age that beef cattle are slaughtered, thereby reducing the emissions of the animal. †Grass-legume mix – legumes such as clover fix nitrogen into the soil, thereby reducing the need to apply nitrogen fertiliser, which reduces nitrous oxide emissions. |
||||||
The Balanced Pathway for land use
In our Balanced Pathway, the land use sector’s emissions are projected to fall from 0.8 MtCO2e in 2022 to -1.9 MtCO2e by 2040 (the middle of the Seventh Carbon Budget period) and to ‑29.9 MtCO2e by 2050 (Figure 7.4.2). Land use emissions are slow to fall in the early stages of the pathway due to the time taken by new woodlands to reach peak rates of sequestration. In the Balanced Pathway, the sector becomes a net sink in 2038. Sources of emissions fall by 31%, while the land use sector sink increases by 123% by 2050. The key values that underpin this pathway are summarised in Table 7.4.2.
| Figure 7.4.2 Land use emissions by subsector – historical (2008–2022) and Balanced Pathway (2025–2050) |
 Description: Net emissions from land use have remained level at just above zero between 2008 and 2022. They represent the net emissions of sources, dominated by cropland, and sinks, dominated by forestry. In the Balanced Pathway, emissions remain flat until 2038, when the sector moves from a net source to a net sink. The size of the net sink grows quickly in the final years of the pathway. Description: Net emissions from land use have remained level at just above zero between 2008 and 2022. They represent the net emissions of sources, dominated by cropland, and sinks, dominated by forestry. In the Balanced Pathway, emissions remain flat until 2038, when the sector moves from a net source to a net sink. The size of the net sink grows quickly in the final years of the pathway.Source: DESNZ (2024) Provisional UK greenhouse gas emissions national statistics 2023; DESNZ (2024) Final UK greenhouse gas emissions national statistics 1990-2022; UK Centre for Ecology and Hydrology (2025); CCC analysis. Notes: Solid colours, to the right of the line, represent our modelled pathway emissions in each subsector from 2025. Pale shades, to the left of the line, show historical subsector emissions data up to 2022 and then our modelled expectations based on existing trends and policies for past years for which data are not yet available. |
| Table 7.4.2 Key values in the Balanced Pathway for land use |
||||||
|---|---|---|---|---|---|---|
| 2025 | 2030 | 2035 | 2040 | 2050 | ||
| Emissions | Emissions in year (MtCO2e) | 1.0 | 1.3 | 1.2 | -1.9 | -29.9 |
| Change in emissions since 1990 (MtCO2e) | -9.7 | -9.4 | -9.5 | -12.6 | -40.6 | |
| Change in emissions since 2022 (MtCO2e) | +0.3 | +0.6 | +0.5 | -2.6 | -30.7 | |
| Share of residual UK emissions offset by land use sinks* | 7% | 9% | 11% | 17% | 58% | |
| Key drivers – peatland | Proportion of upland peat in natural or rewetted condition | 30% | 37% | 48% | 60% | 79% |
| Proportion of lowland peat in natural or rewetted condition | 9% | 10% | 18% | 31% | 56% | |
| Lowland peat under raised-water level management | 0% | 0% | 1% | 4% | 10% | |
| Key drivers – woodland | Annual planting rates of new woodland (thousand hectares)† | 17 | 37 | 56 | 60 | 60 |
| Proportion of UK land under woodland† | 13% | 13% | 15% | 16% | 19% | |
| Existing broadleaf woodland being sustainably managed | 20% | 50% | 80% | 80% | 80% | |
| Key drivers – energy crops | Annual energy crop planting rates (thousand hectares) | 0 | 12 | 29 | 38 | 38 |
| Yield improvements (oven-dried tonnes) | 12 | 12 | 13 | 14 | 15 | |
| Key drivers – land use transition | Area of agricultural land converted to agroforestry (thousand hectares)‡ | 8 | 47 | 86 | 125 | 204 |
| Length of managed hedgerows (thousand kilometres) | 420 | 459 | 497 | 536 | 613 | |
| Proportion of UK agricultural land area required for land-based measures | 0% | 2% | 6% | 10% | 19% | |
| Source: UK Centre for Ecology and Hydrology (2025); CCC analysis. Notes: For this sector, we show absolute changes in emissions as opposed to percentage changes because the land use sector is a combination of sources and sinks which can vary between positive and negative. *This refers to the proportion of total UK emissions sources (that is, excluding engineered removals and land use sinks) that are offset by land use sinks. †Area includes area of bare ground required to be compliant with the UK Forestry Standard. This does not include the areas associated with agroforestry and short-rotation forestry. ‡Land under agroforestry tree cover. |
||||||
The combined impact of agriculture and land use
Delivering the Balanced Pathway for the agriculture and land use sectors will require a transformation in UK land use. One that balances the need to reduce emissions while delivering other important functions of land including food production, settlement growth, and benefits for the wider environment, nature, and society more generally. Actions guided by policy but delivered by farmers and land managers will interact across both sectors, such that the scale of emissions reduction achieved in land use will offset the remaining emissions in agriculture, turning the combined sector from a net source to approximately Net Zero. Immediate policy action is critical to releasing land early in the pathway for measures such as woodland creation where the time-period to reach peak sequestration can be decadal (Figure 7.4.3).
|
Figure 7.4.3 Net emissions in the agriculture and land use sectors in the Balanced Pathway |
|
|
 Description: Emissions associated with the combined agriculture and land use sectors fall steadily throughout the pathway until they become approximately Net Zero in 2050, due to the rapid increase in land-based sequestration in the 2040s. Agriculture remains a net source, with emissions plateauing from 2040.
Key elements of the Balanced Pathway for agriculture and land use
If properly supported by the UK’s Governments, meeting Net Zero will provide opportunities for farmers and land managers to diversify land use and management, while continuing to produce food. Effective government policy and clear incentives, both public and private, will be required to deliver this change, which can generate new revenue streams and increase the resilience of businesses. The key actions to reduce agricultural emissions include the take-up of low-carbon farming practices and technologies to reduce non-CO2 GHG emissions from crops and livestock, many of which can deliver productivity improvements, and reducing energy-related emissions from agricultural machinery. Reducing livestock numbers will support the transition of some land out of agricultural use to increase land-based sequestration from woodland creation, restoring peatlands, and planting energy crops. A shift in the average consumption of meat and dairy towards lower-carbon foods ensures imports do not increase (Figure 7.4.4).
| Figure 7.4.4 Sources of abatement in the Balanced Pathway for agriculture and land use |
 Description: The largest share of emissions reduction in agriculture and land use comes from reducing livestock numbers. Significant contributions also come from actions to decarbonise machinery and restore and rewet peatlands. Woodland creation rapidly increases its abatement share over the 2040s. Other actions include low-carbon farming practices, agroforestry and hedgerows, and energy crops. Source: DESNZ (2024) Provisional UK greenhouse gas emissions national statistics 2023; DESNZ (2024) Final UK greenhouse gas emissions national statistics 1990-2022; UK Centre for Ecology and Hydrology (2025); CCC analysis. Notes: We generally account for emissions reductions due to measures to reduce demand for high-carbon activities (including low-carbon choices and efficiencies) first, before the impact of low-carbon technologies. |
The key measures that combine to reduce emissions across agriculture and land use are:
Low-carbon farming practices and technologies (35% of emissions reduction in 2040). The take-up of low-carbon farming practices and technologies combine to reduce emissions from managing agricultural soils and livestock, and from machinery use.
- Soils and livestock measures (14% of emissions reduction in 2040). The 29 measures that we have identified include feed additives to inhibit methane in cattle, breeding and livestock health measures to reduce emissions intensity, and better management of animal waste.[320] Many of these measures imply an improvement in productivity, for example, more output per animal. In our analysis, we assume that for these productivity measures, current output is maintained, which leads to a corresponding reduction in livestock numbers of around 5% for cattle and sheep by 2040. Measures to improve soil health, while reducing nitrous oxide emissions, include the planting of crops that can reduce the need for fertiliser use and more efficient use of nitrogen.
- Decarbonising machinery (21% of emissions reduction in 2040). Energy use emissions decline in line with the fall in livestock numbers and agricultural land area due to the land release measures cited below. The remaining uses of machinery, to heat and cool agricultural buildings, decarbonise fully by 2050 through electrification, mirroring developments in the wider commercial buildings sector (see Section 7.9). Mobile machinery is electrified except for the larger vehicles, which switch to hydrogen-based options where battery size may be an issue for electrification. Should technology develop however, then electrification could be used to decarbonise the whole fleet. Bioenergy used as a transitional fuel is phased out completely by 2040.
Reducing livestock numbers (32% of emissions reduction in 2040; 68% of land released by 2040). Governments should support opportunities to diversify farm businesses and incomes. This will also release land for woodland creation and other purposes.
- Supply-side measures. The ongoing development of a domestic agricultural policy for each nation of the UK to replace the EU’s CAP will significantly reduce the level of public subsidy payable for maintaining land in agriculture. With appropriate government support and financial incentives such as the Environmental Land Management scheme in England, and its equivalents in the devolved administrations, farmers and land managers could look to diversify their income streams beyond agricultural production.
- Shift to lower-carbon foods. Average meat consumption declines by 25% by 2040 and 35% by 2050 compared to 2019 levels, with a steeper reduction in red meat consumption (40% by 2050) to reflect the higher carbon intensity of ruminant livestock. This pathway is informed by the observed downwards trend in recent years and the health benefits of reducing red meat consumption.[321] Average dairy consumption reduces by 20% by 2035 which is maintained to 2040 and 2050.
- The Balanced Pathway requires going beyond the existing UK long-term trend, which shows a gradual reduction in meat consumption. In recent years, meat purchases have fallen more steeply, with a 10% fall in overall meat consumption between 2020 and 2022. This represents a faster rate of decline than in the Balanced Pathway.[322] It is too early to tell whether this steeper-than-projected trend will continue in the long term or is a temporary response to the cost-of-living crisis, which saw an 11% decrease in overall food purchases by weight between 2020 and 2022.[323]
- In our pathway, meat products will be mainly replaced by existing alternative protein products (for example, plant-based burgers), some plant-based whole foods and, in the later years, novel alternative proteins.[324] Novel alternative proteins use technologies such as precision fermentation to create products with similar taste and texture to meat. See Chapter 8 for more details on household choices and Box 7.4.1 for a summary of diet-related findings from the Committee’s citizens’ panel.
- As a result of the above measures, the Balanced Pathway sees an acceleration in the reduction of livestock numbers and release of land from agricultural use.
- Between 2012 and 2022, livestock numbers remained broadly unchanged for sheep and cattle, rising by 2%.[325] The Balanced Pathway requires a reduction of 27% in cattle and sheep numbers between 2023 and 2040.
- This reduction is similar to that seen between 1990 and 2010, when numbers fell by just over one-quarter, largely in response to CAP reform.[326] Over the same period, grassland area fell by 5%, which indicates a decrease in stocking densities.
Other land-release measures (2% of emissions reduction in 2040; 32% of land released by 2040). In addition to reducing livestock numbers, four further measures release land out of agricultural production. All but one have a corresponding impact on agricultural emissions.
- Food waste (12% of land released by 2040). Food waste falls by 39% from farm to household by 2030 compared to 2021, and by 45% by 2040.[327]
- Livestock stocking density (12% of land released by 2040). Stocking rates on lowland grasslands increase by 10% by 2050, to accommodate the destocking of livestock from uplands and underutilisation of some grasslands. This measure does not reduce livestock numbers or agricultural emissions.
- Crop yield improvements (7% of land released by 2040). Sustainable crop yield improvements through better agronomic practices and crop breeding enable the same level of production with less land and inputs.
- Shifting horticultural production to indoor systems (0.2% of land released by 2040). 10% of horticultural products are moved to indoor systems by 2050. Reductions in nitrous oxide emissions are small due to the small land footprint of horticultural production. Focussing the shift on products grown on lowland peat, the most carbon intensive per hectare of land, would deliver higher emissions savings relating to soil carbon.
Peatland restoration and management (17% of emissions reduction in 2040).[328] Functioning peatlands in good ecological condition can accumulate carbon over many millennia, but drainage and disturbance can cause these stocks to be released. Peatlands were a net source of emissions (15 MtCO2e) in 2022. While ambitious levels of restoration and water-level management of degraded peatland soils reduce emissions, peatlands continue to be a net source throughout the Balanced Pathway due to their continued agricultural use.[329]
- Restoration of upland peatlands and forested peats (5%). Upland peatlands (mostly consisting of blanket bog) represent the largest peat resource by land area in the UK, totalling around 2.5 million hectares. In the Balanced Pathway, the total restored or near-natural area rises from the current 30% to 60% by 2040, with annual rewetting rates reaching 45,000 hectares between 2030 and 2050.
- Restoration and management of lowland peatlands (12%). Lowland peatland soils occupy a smaller area (0.4 million hectares) than upland peatlands but are more emissions intensive due to their deep drainage and intensive use in agriculture. They encompass a wide range of land uses including fen habitats, cropland, grassland, and extraction sites.
- In the Balanced Pathway, the total restored or near-natural area of lowland peatland rises from the current 9% to reach 31% by 2040.
- Lowland peatlands represent an important agricultural and horticultural resource. Actions such as paludiculture and water level management (continuous and dynamic) support continued activity, with reduced emissions, on 4% of lowland peatlands by 2040, rising to 10% by 2050.[330]
Woodland creation and management (4% of emissions reduction in 2040, rising to 15% by 2050). In the Balanced Pathway, planting new diverse woodlands increases UK woodland cover area from the current 13% to 16% by 2040 and 19% by 2050.[331]
- The pathway assumes a mix of broadleaf (65%) and conifer (35%) new woodland to avoid non-resilient monocultures and to deliver wider benefits, with 15% of the total area used as open ground to increase biodiversity in the landscape.[332] Trees are only planted on mineral soils, with organo-mineral and organic soils excluded to protect biodiverse habitats and minimise soil carbon loss from planting disturbance.
- Sustainable management of existing broadleaf woodland rises from the current 20% to 80% by 2035. We assume that all conifer woodlands are currently managed.
Energy crops (7% of emissions reduction in 2040). An appropriately sited, sustainable UK supply of bioenergy is important in contributing to Net Zero by displacing fossil fuels and removing CO2 from the atmosphere when combined with CCS technology. In our pathway, domestic energy crops provide savings in the engineered removals sector of 3 MtCO2e in 2040, and 10 MtCO2e in 2050 (see Section 7.12). The net carbon benefits retained on site in vegetation and soils following harvesting of these crops are counted in the land use sector.
- The Balanced Pathway includes three perennial crops – miscanthus, short rotation coppice, and short rotation forestry (SRF). Current areas of planting are negligible (for example, 13,000 hectares of miscanthus and short rotation coppice), while SRF is unknown.[333]
- Land allocated to energy crop planting across the three crop types reaches 0.7 million hectares by 2050, which equates to almost 3% of UK land area. This uptake aligns to estimates by the Energy Technologies Institute.[334]
- This pathway represents a transition away from biomass feedstock imports for energy combustion to using mainly UK supplies via dedicated energy crops and biomass residues by 2050 (see Section 7.7).
Agroforestry and hedgerows (2% of emissions reduction in 2040). Alongside dedicated new woodlands, low-density trees and hedgerows can be incorporated into agricultural production systems, supporting carbon sequestration.
- Our modelling assumes there is no current agroforestry activity, with rates rising by 8,000 hectares each year through to 2050. By 2050, 10% of cropland and agricultural grassland is under agroforestry practices.
- The current estimate of hedgerow extent is based on the 2007 Countryside Survey.[335] In the Balanced Pathway, the extent of hedgerows increases by 40% by 2050, which is 10% higher than the previous peak reported in 1984.
For the combined agriculture and land use sectors, Net Zero is achieved mainly through a combination of reduced agricultural methane emissions and removal and reduction of CO2 from woodland creation and peatland restoration, respectively. As methane has a relatively short atmospheric lifetime compared to CO2, its contribution to global warming (assessed using GWP*) is slightly reduced by 2050 compared to today (see Chapter 3, Figure 3.11). The agriculture and land use sectors therefore have a crucial role in halting further increases in the UK’s overall contribution to global warming.
The novel CO2 removals via enhanced weathering and the application of biochar to soils represent additional potential sources of CO2 sequestration associated with land use. Emissions reduction due to these measures in our pathway is counted in the engineered removals sector (see Section 7.12).
Key indicators for agriculture and land use
The key indicators of the changes required to deliver the Balanced Pathway for agriculture and land use include metrics on livestock numbers, meat and dairy consumption, woodland cover, the proportion of peatland in natural or rewetted condition, and the planting of energy crops (Figure 7.4.5).
| Figure 7.4.5 Key indicators for the agriculture and land use sectors |
 Description: The key indicators for agriculture and land use in the Balanced Pathway show a decrease in livestock numbers, driven by changes in the consumption of meat and dairy. This is initially rapid, before slowing from 2035 onwards. This in turn facilitates an upscaling in land use change measures, including an increase in woodland cover, rewetted peatlands, and the area of energy crops. Source: Historical data from Forest Research and Defra; CCC analysis. Notes: (a) Livestock numbers at the start of the pathway are higher than the most recent historical year due to the increase in sheep numbers in the baseline from 2022. (b and c) Consumption of meat and dairy at the start of the pathway is aligned to the existing UK long-term trend. This means it is above the most recent historical years (2021 and 2022) where levels fell more steeply, but it is too early to tell whether these reductions will continue in the long term or are just a temporary reaction to the cost-of-living crisis. (d) Historical woodland area is based on the September 2024 Woodland Statistics release. Our modelling is underpinned by the 2021 estimates of woodland area, which were lower than the most recent historical data. (e) The Balanced Pathway peatland proportions are based on the annual rewetting area, as reported in the UK GHG inventory. |
| Box 7.4.1 Findings from the citizens’ panel on a reduction in meat and dairy consumption |
| The Committee convened a citizens’ panel to explore what an accessible and affordable vision of Net Zero looks like for households (see Chapter 8 for further details). Among other topics, the panel explored how an average 35% and 20% shift away from meat and dairy consumption respectively by 2050 towards lower carbon foods could be achieved in a way that is accessible and affordable for all households.
The panel discussed a range of policy options to reduce meat and dairy consumption, including information-based policies (for example information campaigns or food labels), changes to the choice environment (for example increased availability of plant-based food and replacing a small amount of meat in pre-prepared meals with other ingredients), relative pricing policies, and supporting novel alternative proteins. Panel members:
|
7.4.3 Representation of nature in the Balanced Pathway
The Balanced Pathway represents a national transition, transforming land use across the UK to expand measures which sequester carbon and reduce emissions. The effectiveness of these measures is highly dependent on where they are in the landscape. When planning delivery, land use change measures should be placed in appropriate locations and consideration given to future climate change to build resilience and mitigate the risk of unintended consequences. We set out the principles of a resilient land use transition to mitigate this risk in Section 5.3, Box 5.1.
Measures in the Balanced Pathway can deliver emission reduction and carbon sequestration alongside benefits for nature by expanding healthy, resilient ecosystems. Existing natural habitats represent important sites for biodiversity and hold large carbon stocks that may have taken centuries to millennia to form.[336] Their protection is vital to avoid carbon loss which would undermine efforts elsewhere to create and expand new habitats.
- Peatlands provide significant benefits alongside their ability to hold vast stocks of carbon. They provide habitat for a unique assemblage of plants and animals. Their rewetting and restoration can help regulate water availability and quality across catchments, and is an important aspect of the historic landscape, particularly in the uplands.
- When sited appropriately and using suitable species, new woodlands provide a range of wider benefits such as for biodiversity, which itself enhances the resilience of the woodlands, alongside adaptation benefits such as flood and heat alleviation.[337] Careful adaptive management of woodlands, alongside other ecosystems is important to build resilience in the face of climate change, pests, and diseases, and improves productivity in terms of carbon capture and timber quality.[338]
Incorporating measures into the farmed landscape can deliver a range of ecosystem services, supporting farmers and land managers to adapt to future climate change and supporting a more resilient agricultural system.
- More efficient fertiliser use supports improvements in water quality, and in turn the ecosystem health of aquatic systems. This in turn can reduce coastal pollution and support resilience of coastal ecosystems, which store carbon, as well as helping to protect coastal communities and infrastructure from flooding and storms.
- Agroforestry and hedgerows can be incorporated on farms, supporting carbon sequestration alongside continued production. This can support improved water quality from reduced run-off into water courses, enhanced soil health and increased livestock welfare, as well as enhancing biodiversity and hence resilience. Perennial energy crops can help farmers to diversify production and enhance degraded agricultural soils.
- Alongside the restoration of peatlands, our advice also incorporates their sustainable management under continued food production in lowland settings. Incorporating a mosaic of measures including water level management, paludiculture, and restoration into farmed systems will build resilience across these landscapes, underpinning benefits for climate, biodiversity, water, food, and livelihoods.
Our measures represent a subset of land-based actions that can deliver for people, climate, and nature. Here we address additional measures that could support further emissions reduction and help nature, though challenges remain regarding quantifying their potential impact.
- The recovery of natural ecosystems at scale will encompass a spectrum of approaches that re-establish ecological processes. Rather than being driven by defined outcomes, it instead recognises the inherent value of nature and wild spaces. Relevant actions, such as woodland creation and peatland restoration, are embedded in the Balanced Pathway. However, there remain evidence gaps in the carbon transition of the full suite of habitats (for example for scrub, heath, and species-rich grasslands) that would comprise this method of ecosystem restoration.[339]
- Natural regeneration is the establishment of trees and vegetation via in-situ seed dispersal rather than by active planting. This approach has significant potential to build carbon via the expansion of trees and scrub across landscapes.[340] However, more information is required on the spatial and temporal variability of natural regeneration before it can be incorporated into emission pathways.
- Agroecology incorporates a number of ecological and sustainable principles into farming systems. Measures in the Balanced Pathway such as agroforestry, cover crops, and incorporation of legumes score highly on these principles. Further work is required to quantify the impact a transition to agroecological systems at scale would have on greenhouse gas emissions, carbon stocks, and productivity. However, evidence suggests such approaches can enhance biodiversity, improve air and water quality, build soil health, and promote resilience at the farm-scale.[341]
- Blue carbon is carbon held in marine and coastal vegetation and sediments, which can be managed to contribute to emissions reduction. Though not currently represented in the UK GHG inventory, analysis suggests its contribution to carbon sequestration would be relatively small. However, restoration of coastal habitats would deliver significant benefits for flood risk, water quality, biodiversity, fisheries, and resilience of coastal communities.[342]
7.4.4 Costs, cost savings, and co-impacts
Delivering the Balanced Pathway for agriculture and land use results in a net cost to the economy compared to the baseline (Figure 7.4.6). Costs are driven by decarbonising machinery, low-carbon farming measures, and woodland creation. Governments will need to provide support and incentives to enable farmers and land managers to take the actions required. Our analysis indicates that if farmers and land managers are sufficiently rewarded to deliver social and ecological benefits, this could offset any loss in agricultural income from diversifying land use and management (Box 7.4.2; Figure 7.4.7; see Chapter 9).[343]
- Low-carbon machinery: this has high capital costs, especially power-intensive mobile machinery (over 78 kW) switching to hydrogen options after 2030. This also leads to additional operating costs. The best technology choice remains uncertain, and less power-intensive machinery (below 78 kW) is expected to almost entirely electrify. Electrification of heating and cooling machinery delivers operating cost savings.
- Low-carbon farming measures: there are capital costs associated with some on-farm measures, but there are also savings through productivity improvements (for example livestock yield increases) and reduced costs of inputs (for example measures that reduce use of fertiliser).
- Woodland creation: this includes the costs of the trees themselves, their establishment, and the associated infrastructure such as fencing.
- Peatland restoration: costs of peatland restoration remain highly uncertain, despite improvements in costing data. Peatland restoration may be biased towards easier to restore sites earlier in the pathway, with complex, costlier restoration projects left till later.
- The restoration and water level management of lowland sites, where differences in topography and need for water level management infrastructure and technology will be highly site specific, still requires research and development.
- While costs are based on existing management projects, the costs presented here are likely to be an underestimate.
- Changes in land use: these do not appear directly in our costing analysis. Sales of land taken out of agricultural use are offset by purchases for alternative uses.
Many measures set out in the Balanced Pathway can deliver a range of benefits for health and wellbeing while also improving the climate resilience of agriculture.
- Health and wellbeing: a reduction in average meat consumption (particularly in red and processed meat) has the potential to bring health benefits, though the extent of health benefits will depend on what types of meat are replaced and what they are replaced with.
- The mix of substitution applied in the Balanced Pathway (which relies more heavily on alternative proteins than legumes and pulses) would, on average, have a health benefit, and reduce deaths from colon and rectum cancer, ischaemic heart disease, and type 2 diabetes.[344];[345]
- Negative nutritional impacts of a reduction in meat consumption only occur where a diet is unbalanced and meat products are not substituted at all, or meat products are substituted by very low-value nutrition food. Negative nutrition impacts can be avoided by choosing from a large variety of substitution options that improve the nutritional intake.[346];[347]
- Changes to diets are expected to have minimal impacts on household food costs in the short term and lead to slight reductions in food costs in the longer term as alternative proteins develop that are cheaper to buy than meat and dairy.
- Visiting woodlands and being out in nature is associated with mental and physical health benefits. The adoption of some low-carbon farming practices and increased woodland cover particularly near urban areas can improve air quality.
- Resilience of agricultural production: in addition to supporting agricultural productivity, our pathway can also improve the resilience of the farmed landscape to the impact of climate change (for example, shelter for grazing livestock from hedges and improvements to soil structure and drainage from cover crops). While we have not estimated the avoided losses to crops and livestock that these measures could deliver, this will be considered as part of our advice on the Fourth Climate Change Risk Assessment (CCRA4), to be published in 2026.
- Jobs: changes in land use will see increases in employment in some activities, in particular woodland creation, energy crops, and peatland restoration, substituting for a reduction in employment in livestock agriculture. Patterns at farm level will depend on the extent to which farmers diversify income streams or leave or change jobs altogether, including retirements.
| Figure 7.4.6 Costs and cost savings in the Balanced Pathway for agriculture and land use, compared to the baseline |
 Description: Costs in land use and agriculture are dominated by the capital expenditure associated with the reduction of emissions in agricultural machinery. Land-based actions represent an overall net cost, while reducing operating costs in low-carbon machinery and low-carbon farming measures are cost saving over the course of the pathway. Source: CCC analysis. Notes: Capex is additional capital expenditure and opex is additional operating expenditure. Both are additional in-year costs in 2023 prices, relative to a baseline of no further decarbonisation action. |
| Box 7.4.2 CCC rural land use archetypes project |
| The aim of this project was to quantify the impact of diversifying land use for 12 representative baseline rural land use ‘archetypes’ in England, Scotland, Wales, and Northern Ireland, covering 46% of UK land area. The project considered how diversifying land use beyond agricultural production could deliver a range of other benefits for adaptation and the wider environment, in addition to reducing emissions. The private and social benefits of each transition estimated for 2035 and 2050 were compared against the respective baseline (where no transition occurs) of each archetype to understand the extent to which any decline in farming income could be offset by payments for non-food production activities.
The transitions focused on changes in land use and management consistent with our Balanced Pathway (for example woodland creation, energy crop planting, peat restoration) to deliver emissions reductions and contribute to climate resilience, maintenance of food production, increased biodiversity, and other co-impacts. For some archetypes, we also included the installation of solar photovoltaics (PV), which can generate an income for the farmer, although the emissions savings are captured elsewhere in the economy. For all transitions, the farming income related to agricultural production decreases due to the fall in agricultural activity, but this was more than offset by the combined increase in income from non-farming activities (for example, energy crops and renewables, such as solar photovoltaics) and non-market improvements to the environment (for example, reducing emissions and improving water and air quality). The latter assumes that farmers receive payments for delivering these social benefits. Across the transitions, and after allowing for costs, the uplift in total net benefits (private and social) compared to the baseline by 2050 typically ranged from £500 to £1,500/hectare. This supports the case for appropriate incentives and rewards to be put in place to help those farmers and land managers that would like to make the change. Figure 7.4.7 shows the results for one particular archetype (Archetype 3: intensive grassland dominated, area equally split between south-west England and Wales, with 1% of woodland cover) undergoing two different types of transition by 2050:
Compared to the baseline, both transitions provide a net increase in private and social benefits, equivalent to £700/hectare and £630/hectare for transition one and transition two, respectively by 2050. Farming income declines due to the fall in livestock numbers under both transitions. However, under transition one, this is more than offset by the monetised payment for the delivery of social benefits, due mainly to emissions savings and air quality improvements from woodland creation. Under transition two, the increase in private benefits that is not food related (i.e. revenue from energy crops and renewables) provides an additional source of income. Source: UK Centre for Ecology and Hydrology, Eunomia, and University of East Anglia (2024) UK rural land use archetypes, part 2. |
| Figure 7.4.7 Costs and benefits of transitioning an intensive grassland archetype (2050) |
 Description: Compared to the baseline, the two transitions of an intensive grassland archetype (which entails a reduction in livestock numbers) towards land-based measures consistent with our Balanced Pathway will see an overall increase in net private and social benefits in 2050. Source: UK Centre for Ecology and Hydrology, Eunomia, and CCC analysis Notes: (1) Costs are in 2023 prices. (2) Transition one focuses on a mix of land sparing (woodland creation) and land sharing (hedge creation, agroforestry) measures, while transition two focuses on land sharing measures combined with energy crop planting and installation of renewables. (3) Bars below the x-axis represent the costs, both the private costs to the farmer (from agricultural production) and to society (due to GHG emissions for example). (4) The bars above the x-axis are the benefits, both to the farmer (private income from farming and non-farming (for example, renewables)) and the net benefits to society from reducing emissions and improving the environment (for example, improving water quality). |
7.4.5 Key actions required to deliver the Balanced Pathway for agriculture and land use
Delivering the Balanced Pathway in agriculture and land use will depend on a combination of effective government policy addressing both financial and non-financial barriers and attracting private sector investment. Our advice comes at a time of significant uncertainty in the policy landscape, with domestic agricultural and land use policy for each country of the UK yet to be fully developed. The Governments of the UK should clarify this as a matter of urgency. The key actions that are needed are as follows:
- Publish a land use framework that sets out how land can deliver multiple functions, including for climate mitigation and adaptation, sustainable food production, biodiversity, and wider environmental goals. Consideration should be given to the possible impact to rural culture and heritage, including the UK’s indigenous languages and dialects, which may have strongholds in farming communities.[348]
- Provide incentives and address barriers for farmers and land managers to diversify land use and management into woodland creation, peatland restoration, bioenergy crops and renewable energy.
- Provide long-term certainty on public funding for farming practices and technologies which reduce emissions from managing crops and livestock. As part of this, ensure low-regret and low-cost measures are taken up through regulations or minimum requirements in agricultural support mechanisms, especially when they can deliver efficiency improvements. The opportunities and impact to farmers will vary across the UK and government financial support will be required to ensure appropriate incentives and rewards are available (see Section 4.3).
- Enable a shift in average meat and dairy consumption in the UK towards lower carbon foods. The most promising levers include replacing a small amount (for example,15%) of meat and dairy content in pre-prepared meals with plant whole foods or alternative proteins; increasing choice and availability of lower carbon foods in public procurement, restaurant, and supermarket settings; and supporting more novel alternative proteins with improved taste and texture.
- Protect against the risks of carbon leakage from trade in agricultural products. This could be achieved with a carbon border adjustment mechanism.
7.5 Electricity supply
Key messages
Today: electricity supply is currently the fifth highest-emitting sector in the UK economy.[349] In 2023, electricity supply accounted for 9% of UK emissions, 37.8 MtCO2e.
CB7 period: by 2040, electricity supply emissions fall by 88% in the Balanced Pathway, relative to 2023. Electricity supply will account for 4.6 MtCO2e of UK GHG emissions and will be the UK’s ninth highest-emitting sector.
By 2050: this sector can almost completely decarbonise, with any residual emissions only coming from the small proportion of CO2 emissions not captured at gas carbon capture and storage plants.
Our key messages are:
- Emissions from electricity supply have fallen by 81% since 1990. The majority of this reduction has happened since 2012, reflecting the phase-out of coal and an increase in low-carbon generation.
- Demand for electricity will increase, especially during the 2030s, driven by the switch to electric vehicles, heat pumps, and other electric technologies. By 2050, annual electricity demand could be more than double 2023 levels.
- Reliable, low-cost, and low-carbon electricity can be delivered while coping with potentially long periods of low wind. Offshore wind forms the backbone of the future system. Storable energy, smart demand flexibility, and interconnection all help maintain security of supply, in much the same way as in the current electricity system.
- Electricity networks will need to expand to enable consumers to benefit from reliable, low-cost, and low-carbon electricity. Investment in advance of increases in demand is essential to ensure the network is an enabler and not a barrier to the transition.
- Government and relevant authorities should reform key processes and rules – including in planning, consenting, and regulatory funding – to enable rapid expansion of the country’s energy infrastructure and clear, consistent resolution of tensions between low cost of infrastructure and sensitivity to local conditions.
This section builds on the analysis published in our 2023 report Delivering a reliable decarbonised power system.
7.5.1 Emissions in electricity supply
Emissions in electricity supply were 37.8 MtCO2e in 2023. Between 1990 and 2023, the emissions intensity of electricity supply fell by 79%, from 631 gCO2e/kWh to 131 gCO2e/kWh, and electricity demand fell by 4% from 284 TWh to 274 TWh.
- The share of generation from wind and solar has rapidly increased from 3% in 2010 to 34% in 2023, displacing generation from coal and gas.
- The share of UK electricity generation from coal fell from 65% in 1990 to 1% in 2023. In September 2024, Ratcliffe-on-Soar, the last operational coal power plant in the UK, was closed.
- The remaining emissions in the electricity supply sector are largely from unabated gas use, which accounted for 30% of UK generation in 2023.
- Demand for electricity has been falling by around 1% per year since the peak in 2005.
7.5.2 The Balanced Pathway for electricity supply
In our Balanced Pathway, electricity supply emissions are projected to fall, relative to 2023 levels, by 88% to 4.6 MtCO2e by 2040 (the middle of the Seventh Carbon Budget period) and to 1.0 MtCO2e by 2050 (Figure 7.5.1). The key values that underpin this pathway are summarised in Table 7.5.1.
Emissions in electricity supply are influenced by the weather. To account for this variability, we base the Balanced Pathway on an average weather year but also test uncertainties for more extreme conditions (see Box 7.5.1).
| Figure 7.5.1 Electricity supply emissions – historical (2008–2023) and Balanced Pathway (2025–2050) |
 Description: Electricity supply emissions have fallen significantly since 2008. In the Balanced Pathway, emissions continue to fall, reaching close to zero by 2050. Source: DESNZ (2024) Provisional UK greenhouse gas emissions national statistics 2023; DESNZ (2024) Final UK greenhouse gas emissions national statistics: 1990 to 2022; CCC and AFRY analysis. Notes: (1) The pathway is modelled using historical data up to 2023. Emissions reductions in the Balanced Pathway prior to 2025 (shown in a pale shade in this chart) are based largely on existing trends; additional decarbonisation measures only begin to be applied in our modelling from 2025 (indicated in this chart with a vertical line). (2) Emissions associated with energy from waste are accounted for in the waste sector. Emissions associated with combined heat and power are accounted for in the industry and fuel supply sectors. (3) Projected emissions are based on an average weather year (see Box 7.5.1). |
| Table 7.5.1 Key values in the Balanced Pathway for electricity supply |
||||||
|---|---|---|---|---|---|---|
| 2025 | 2030 | 2035 | 2040 | 2050 | ||
| Emissions | Emissions in year (MtCO2e)* | 32.5 | 9.8 | 5.6 | 4.6 | 1.0 |
| Change in emissions since 1990 | -84% | -95% | -97% | -98% | -100% | |
| Change in emissions since 2023 | -14% | -74% | -85% | -88% | -97% | |
| Share of total UK emissions | 8% | 3% | 3% | 4% | ||
| Key drivers – quantity variables | Gross annual electricity demand (TWh) | 279 | 333 | 444 | 562 | 692 |
| Offshore wind capacity (GW) | 17 | 46 | 70 | 88 | 125 | |
| Onshore wind capacity (GW) | 16 | 26 | 29 | 32 | 37 | |
| Solar PV capacity (GW) | 20 | 38 | 70 | 82 | 106 | |
| Low-carbon dispatchable capacity (GW)† | 0 | 3 | 8 | 15 | 38 | |
| Battery storage capacity (GW / GWh) | 7 / 10 | 17 / 28 | 21 / 54 | 26 / 82 | 35 / 139 | |
| Medium-duration storage capacity (excl. hydrogen storage) (GW / GWh)‡ | 3 / 24 | 4 / 174 | 6 / 312 | 7 / 419 | 7 / 433 | |
| Unabated gas share of generation (%)§ | 29 ± 3 | 7 ± 2 | 3 ± 1 | 2 ± 1 | 0 | |
| Key drivers – price variables | Offshore wind levelised cost (£/MWh) | 51 | 38 | 38 | 35 | 31 |
| Solar PV levelised cost (£/MWh) | 46 | 34 | 30 | 29 | 27 | |
| Low-carbon dispatchable levelised cost (£/MWh)# | 163–218 | 147–188 | 161–191 | 165–194 | ||
| Source: CCC and AFRY analysis. Notes: We have blanked out the share of total UK emissions in 2050 because total UK emissions have reached Net Zero at this point. All costs are in 2023 prices. *Emissions and the share of generation from unabated gas are based on an average weather year (see Box 7.5.1). Emissions associated with energy from waste are accounted for in the waste sector. Emissions associated with combined heat and power are accounted for in the industry and fuel supply sectors. †Low-carbon dispatchable capacity refers to generation from hydrogen and gas with carbon capture and storage. ‡Storable fuels provide a significant proportion of medium- and long-term storage needs. Hydrogen storage capacities are presented in Section 7.7. §The unabated gas share of generation reflects the impact of uncertainty due to weather variation. #The price variable for low-carbon dispatchable capacity is highly dependent on fuel costs, carbon costs, and load factors – values in this table present the range of costs across gas with carbon capture and storage and hydrogen generation technologies, reflecting uncertainty in their relative long-run costs, and assume a constant load factor of 20% for illustrative purposes. |
||||||
Key elements of the Balanced Pathway for electricity supply
In the Balanced Pathway, electricity supply emissions fall to 9.8 MtCO2e by 2030, with action thereafter focused on meeting rising demand with low-carbon supply. Low-cost variable renewables, especially offshore wind, form the backbone of the future system. These are supported by storable energy, smart demand flexibility, and interconnection.
The key elements of the Balanced Pathway for electricity supply are:
Electricity demand. Gross annual electricity demand more than doubles by 2050, increasing from 274 TWh in 2023 to 692 TWh in 2050. This reflects increasing electrification of transport, buildings, and industry. The production of hydrogen from surplus generation accounts for an additional 29 TWh of electricity use in 2035 and 89 TWh in 2050.
Variable renewables (80% of generation in 2040). Renewable generation from wind and solar is well established and is the cheapest form of new electricity generation capacity.[350] The UK also benefits from extensive wind resources. As such, renewables have an essential role to play in achieving Net Zero and meeting the vast majority of demand in the Balanced Pathway. This will require strong and sustained deployment of renewables capacity.
- The UK has a proven track record in deploying offshore wind. As of 2023, the UK has installed 15 GW of offshore wind capacity, with nearly half of that installed since 2019 – a fleet only exceeded by China.[351] There is around a further 78 GW in the pipeline, of which 13 GW have secured a contract for difference and are due to start generating in the 2020s.[352]
- Deploying the offshore wind in the Balanced Pathway will require increasing the current rate of deployment from around 1–2 GW per year to 5.7 GW per year out to 2030 before then maintaining an average of 4.0 GW per year out to 2050, in addition to the repowering of older sites as they reach the end of their operating lives.
- Onshore wind and solar can be built relatively quickly. For onshore wind, the Balanced Pathway requires an average deployment rate of 0.8 GW per year, with deployment peaking at 1.9 GW in 2030, which is comparable to the historical peak of 1.8 GW in 2017. For solar, an average deployment rate of 3.4 GW per year is needed. This requires build rates to grow to around the historical peak (4.1 GW in 2015) this decade.
- There are a range of barriers that will need to be overcome to enable the levels of deployment required. This will require concerted action on several areas, including planning, grid connections, and supply chain bottlenecks.
- Maximising the potential of variable renewables in the UK will have wider implications for the land and seabed. However, planned strategically, deployment should be possible at significant levels.
- Offshore wind projects must consider constraints including seabed availability, wildlife, and radar interference. To date, 81 GW of seabed has been leased.[353] We also expect some offshore wind to be floated rather than fixed to the seabed. This means turbines can be deployed in deeper waters where there are likely to be fewer constraints.
- To deploy the 2050 levels in the Balanced Pathway would conservatively require around 1% of UK land for solar and 2% for onshore wind, with approximately 98% of the land around onshore turbines remaining available for other land uses (for example, agriculture and pasture).[354];[355] The uptake of small-scale solar (for example, on rooftops) could also significantly reduce the already relatively small land use requirements for solar.
Storable energy. The Balanced Pathway uses storable energy as the primary complement to variable renewables, including fuels such as gas, hydrogen, nuclear, and bioenergy that can be used in low-carbon ways, and grid storage such as batteries.
- Firm power (13% of generation in 2040). This refers to sources of predictable and schedulable electricity generation with relatively inflexible generation profiles. The majority of firm power in the Balanced Pathway is provided by nuclear.
- Nuclear. The Balanced Pathway reaches 11 GW of capacity by 2050, up from 6 GW in 2023, with new capacity that could be delivered with large-scale projects or small modular reactors.
- Bioenergy with carbon capture and storage (BECCS). Development of carbon capture and storage (CCS) infrastructure enables the deployment of BECCS plants. BECCS from sustainable feedstocks (see Section 7.7) provides both decarbonised electricity generation and a form of engineered CO2 removals (see Section 7.12). BECCS runs inflexibly due to the value of the removals it provides alongside the electricity, providing less than 2% of generation in 2040. There is no role for large-scale unabated biomass generation at high load-factors in the pathway beyond the expiry of existing contracts in 2027. We explore a contingency without BECCS in the electricity supply sector in Chapter 6.
- Dispatchable generation (7% of generation in 2040). This refers to sources of generation that can be planned with a high degree of confidence to provide flexible, controllable electricity. Dispatchable generation will be required to provide security of supply, in particular during periods of low production from variable weather-dependent renewables.
- Low-carbon dispatchable generation. Towards the end of the 2020s, the Balanced Pathway sees the development of CCS and hydrogen infrastructure (see Section 7.7), enabling the deployment of low-carbon dispatchable generation (for example, gas with CCS or hydrogen-fired turbines). Capacity reaches 38 GW in 2050 with an average build rate of 1.8 GW per year between 2030 and 2050. This is around half of the historical peak annual build rate for unabated gas combined cycle gas turbines of 3.7 GW.
- Unabated gas. The Balanced Pathway rapidly phases out the use of unabated gas generation, with its occasional use acting to balance the system and ensure security of supply (less than 2% of 2040 generation). The pathway therefore maintains a reserve of unabated gas capacity into at least the 2040s which can be drawn on if needed. Given the time and scope to sufficiently develop alternatives, unabated gas use is phased out by 2050.
- Grid storage. With an increasing share of variable renewables, grid storage can capture energy, typically when it is cheap, to provide electricity in periods when demand is higher and electricity is more valuable. It can operate on short-to-medium timescales to provide flexibility when it is most valuable.
- Batteries can provide flexibility by discharging power on timescales from seconds-to-hours. The Balanced Pathway deploys 35 GW of short-duration batteries (up to 9 hours) by 2050, more than a ten-fold increase on 2023 levels.
- A range of other options can provide storage over the medium term (days-to-weeks), including pumped hydro and other technologies at different stages of commercialisation (for example, compressed and liquid air storage, flow batteries, and thermal storage). Our analysis deploys 7 GW of medium-duration grid storage by 2050.
Smart demand flexibility. Smart management of demand plays an important role in the Balanced Pathway by helping to reduce costs and improve security of supply without affecting consumers’ quality of service provision.
- Residential, commercial, and industrial consumers can participate voluntarily in markets to shift and vary their demand in response to price signals. This can help to smooth peaks in demand and absorb excess supply (for example, through smart charging of EVs and pre-heating via heat pumps). Producing hydrogen via electrolysis can also help to absorb electricity surpluses when available supply exceeds demand (see Section 7.7).
- Demand flexibility lowers costs by reducing electricity generation and storage requirements (particularly at peak demand periods) and the amount of network capacity needed.
Interconnection. Connection of the electricity grid to neighbouring markets enables imports of electricity when it is cheaper to do so, and provides a market for surplus generation. Currently there is around 10 GW of interconnection capacity. In the Balanced Pathway this increases to 28 GW by 2050. Until the mainland European system is decarbonised, there is uncertainty around the carbon intensity of imported electricity. There is also the potential for neighbouring countries to be simultaneously impacted by weather extremes, which could limit cross-border trade. The modelling for this report takes these constraints into account.
Networks. Network capacity will need to be increased at pace to ensure supply is able to be transported to sources of demand as electricity generation is increasingly decarbonised and demand grows. In most cases, overhead lines should be favoured over more expensive methods such as undergrounding, given the significant cost savings for consumers and in line with the National Policy Statement for energy infrastructure.[356];[357];[358]
- Investment in the transmission network is essential to accommodate higher levels of generation that are located away from demand, including offshore wind, and to prevent cheap renewable generation going to waste. All major electricity transmission boundaries require some level of reinforcement in the Balanced Pathway, with an average doubling of capability by 2035 and a tripling by 2050.
- Investment in distribution networks will also be required as the uptake of EVs, heat pumps, and industrial electrification will lead to an increase in electricity demand in most areas. Distribution network reinforcement peaks in the 2030s as spare capacity on the network is used up and anticipatory reinforcements are made.
Overall, in the Balanced Pathway, emissions intensity of electricity supply is projected to fall by 95% from 131 gCO2e/kWh in 2023 to 7 gCO2e/kWh by 2040, and by 99% to 1 gCO2e/kWh by 2050 (Figure 7.5.2). The capacity and generation mixes are shown in Figure 7.5.3.
| Figure 7.5.2 Emissions intensity of electricity supply in the Balanced Pathway |
 Description: Emissions intensity has fallen since 2008. This trend continues in the Balanced Pathway, reaching close to zero by 2050. Source: DESNZ (2024) Provisional UK greenhouse gas emissions national statistics 2023; DESNZ (2024) Final UK greenhouse gas emissions national statistics: 1990 to 2022; DESNZ (2024) Digest of UK Energy Statistics (DUKES) 2024; CCC and AFRY analysis. Notes: (1) The pathway is modelled using historical data up to 2023. Emissions intensity reductions in the Balanced Pathway prior to 2025 (shown in a pale shade in this chart) are based largely on existing trends; additional decarbonisation measures only begin to be applied in our modelling from 2025 (indicated in this chart with a vertical line). (2) Emissions associated with energy from waste are accounted for in the waste sector. Emissions associated with combined heat and power are accounted for in the industry and fuel supply sectors. (3) Projected emissions intensities are based on an average weather year (see Box 7.5.1). |
| Figure 7.5.3 Capacity and generation mix in the Balanced Pathway |
 
Description: Variable renewables form the majority of capacity and generation in the Balanced Pathway. These are supported by storable energy, smart demand flexibility, and interconnection. |
Key indicators for electricity supply
The key indicators of the changes required to deliver the Balanced Pathway for electricity supply include metrics on the rate of installation of low-carbon generation capacity, the level of storage on the system, and the costs of renewables (Figure 7.5.4).
| Figure 7.5.4 Key indicators for the electricity supply sector |

Description: The key indicators for electricity supply in the Balanced Pathway show an increase in low-carbon technology deployment, shifted demand, and transmission network boundary capability. Costs for offshore wind and solar and the share of generation from unabated gas fall to 2050. |
Ensuring reliable electricity supply
Electricity systems need to continuously balance supply and demand. The ability to do this by flexibly adjusting generation has always been a key component of grid management, historically through use of coal- and gas-fired generation.
Variable renewables have provided an increasing proportion of UK generation over the past decade (36% in 2023), with the system being balanced by a combination of sources including generation from assets such as nuclear (14% in 2023) and unabated gas plants (30% in 2023), pumped storage, and interconnection (Figure 7.5.3). As the shift towards variable renewables continues, alternative sources of low-carbon flexibility will be needed to operate the system and provide security of supply. But the overall approach to balancing the system will remain the same.
The electricity system set out in the Balanced Pathway would ensure access to reliable electricity, including in potential long periods of low wind, while meeting increases in electricity demand.
- The pathway is designed to meet the UK Government’s standards for security of supply, modelled on an hourly basis out to 2050.[359] It is designed around a 1-in-20 adverse weather year that includes wind droughts (see Box 7.5.1).
- The Balanced Pathway electricity system is secure and robust to weather risks, through the deployment of a portfolio of storable energy, smart demand flexibility, and interconnection.
- Weather variability means there will be periods of low renewable output. These can occur across different timescales, from hours to days or weeks. There can also be seasonal or multi-year variations, such as prolonged wind droughts. Analysis commissioned for this report suggests that, in rare circumstances, there could be up to three-to-four consecutive years of challenging periods.[360]
- Figure 7.5.5 shows how different timescales of residual demand are met in the 1-in-20 adverse weather year for 2040.[361] Throughout, storable energy, and particularly storable fuels, play an important role in balancing the system, meeting the majority of residual demand.
- Grid storage (such as batteries), consumer demand shifting, and interconnectors are able to meet a large portion of shorter periods of residual demand.
- Longer periods of residual demand – including multi-year challenges – are predominantly met by generation from storable fuels, used both flexibly and inflexibly. Storable fuels provide 149 TWh of generation in 2040 in the 1-in-20 adverse year.
- The Balanced Pathway retains a reserve of unabated gas capacity into at least the 2040s, with its occasional use valuable in ensuring security of supply in adverse weather years (4% of generation in a 1-in-20 adverse year and less than 1% in a favourable year, compared to less than 2% in an average year). A system without the use of unabated gas may be possible by 2040 but is likely to increase costs and delivery risks.
| Figure 7.5.5 Meeting periods of residual demand in 2040 under a 1-in-20 adverse weather year |
 Description: Periods of residual demand are predominantly met by storable fuels, with interconnection and short- and medium-duration flexibility meeting a large portion of shorter-duration residual demand. Source: CCC and AFRY analysis. Notes: (1) Residual demand is demand required to be met after taking account of generation from variable renewables. The longest period with residual demand to be met in the analysis is around 18 days. (2) Short- and medium-duration flexibility includes grid storage and smart demand flexibility. (3) Storable fuels include gas (including with CCS), hydrogen, nuclear, and bioenergy. |
The following approaches will need to form part of future system planning to deliver a secure and reliable low-carbon system:
- Increasing technical and geographical diversity: The more diverse the source of supply, the lower the proportional impact of any single failure. Increasing geographical diversity, particularly in offshore wind capacity, can help to manage the impact of wind droughts.
- Redundancy: Adequate redundancy is required in network design, to reduce the likelihood of loss of supply to locations, and in downstream services (such as local generation and increased storage).
- Stress-testing: Understanding of future weather-related extremes needs to be factored into decisions on future energy system design. System operators can stress-test future supply using credible examples of observed low-wind conditions and up-to-date evidence on future climate effects on wind.
- Asset-level resilience: To reduce the vulnerability of generation and network assets, climate impacts such as flood risk, storms in quick succession, extreme heat, and reduced water availability must be considered in site selection and design. These should also factor into the maintenance and life extension of existing assets.
There remains a decision for government around security of supply and how much allowance to build into the system to account for uncertainties around future weather. We have modelled a range of standards by stress-testing the system to a highly adverse weather year (see Box 7.5.1).
Meeting this higher level of standard purely through supply measures would require a further 21 GW of capacity (for example, from storable fuels, grid storage, and/or interconnection) by 2050.[362] Further use of demand-side measures (such as shifting industrial demand) could reduce the level of investment required.
| Box 7.5.1 Weather patterns considered in developing the Balanced Pathway |
| As the UK moves towards a significant reliance on renewables for its energy demand (particularly offshore wind), the inherent variability of weather, as well as the possible effects of climate change, both become more important.
We commissioned a study from Newcastle University to understand how the future electricity supply system should be designed to be resilient to anticipated periods of weather-driven high electricity demand and low renewable generation, accounting for changing UK weather patterns due to climate change. The research analysed historical meteorological data covering the period 1940 to 2022 (83 weather years) and future climate projections from the UK Met Office (UKCP18) to examine the adversity of different weather years. The study also explored the potential for consecutive challenging years. The results from the commissioned research have informed the use of weather patterns in this report.
Source: Bloomfield, H. (2025) Reasonable worst-case stress test scenarios for the UK energy sector in the context of the changing climate. |
7.5.3 Costs, cost savings, and co-impacts
Upfront investment enables the costs of delivering the Balanced Pathway for electricity supply to fall over time. There are large cost savings to the economy compared to the baseline by 2050 (Figure 7.5.6). This reflects the costs and savings of decarbonising electricity generation required to meet demand in the baseline. The costs and savings associated with expanding the system to meet new demands from electrification of the economy are accounted for in end-use sectors, and are shown separately to avoid double counting.
Costs in the pathway are driven by the deployment of low-carbon technologies and supporting network infrastructure. Together, these technologies displace unabated gas generation to decarbonise the electricity system.
- Variable renewables: the prices paid for renewables through contracts for difference auctions have fallen rapidly in the past decade. This is particularly true for offshore wind, with contracts awarded for projects commissioning in 2023 being 65% cheaper than five years earlier.[364];[365]
- However, in the most recent auctions, supply chain inflation increased prices for offshore wind. While these cost increases were significant, renewables costs are expected to continue to fall over time due to experience and learning curve effects from increasing global deployment.
- In the pathway, the levelised cost of electricity (LCOE) of offshore wind falls from £51/MWh in 2025 to £35/MWh in 2040. The solar PV LCOE falls from £46/MWh in 2025 to £29/MWh in 2040.
- Electricity network reinforcement: significant anticipatory investment in both transmission and distribution networks is required. Wherever possible, when grid capacity is increased this should be to a level sufficient to avoid having to upgrade the capacity again prior to 2050 in a ‘touch the network once’ approach.
- Storable energy: the majority of investment in storable energy is from the deployment of new nuclear and dispatchable low-carbon generation (gas CCS and hydrogen-fired turbines). These technologies are significantly more expensive than variable renewables. For example, Hinkley Point C has a 35-year contract for difference with a £119/MWh strike price and low-carbon dispatchable has an LCOE of around £160-190/MWh in 2040 in the Balanced Pathway.[366] Nuclear and low-carbon dispatchable generation provide a relatively small proportion of generation (14% in 2040).
- Reduced gas usage: as the electricity system is decarbonised, unabated gas generation is displaced from the system and mainly replaced by variable renewables, which do not have any fuel costs. This results in operating expenditure savings compared to the baseline.
| Figure 7.5.6 Costs and cost savings in the Balanced Pathway for electricity supply to decarbonise baseline supply |
 Description: Upfront investment enables the costs of delivering the Balanced Pathway for electricity supply to fall over time. Source: CCC and AFRY analysis. Notes: (1) Capex is additional capital expenditure and opex is additional operating expenditure. Both are additional in-year costs in 2023 prices, relative to a baseline of no further decarbonisation action. (2) Includes all costs associated with decarbonising electricity supply to meet demand in the baseline, avoiding double counting of the costs of electrification measures in end-use sectors. |
When also including the costs of significantly expanding the system to meet increased demands from electrification of the economy, the Balanced Pathway for the whole electricity system has a net cost (Figure 7.5.7). This cost enables decarbonisation through roll-out of electric technologies in many other sectors (see Chapter 3). In several key areas, these technologies deliver operating costs savings (see Chapter 4).
| Figure 7.5.7 Costs and cost savings in the Balanced Pathway for electricity supply to decarbonise baseline supply and meet new demands |
 Description: Investment in renewables and network infrastructure are the main costs in decarbonising and expanding electricity supply. Source: CCC and AFRY analysis. Notes: (1) Capex is additional capital expenditure and opex is additional operating expenditure. Both are additional in-year costs in 2023 prices, relative to a baseline of no further decarbonisation action. (2) Includes all costs associated with both decarbonising and expanding electricity supply. Therefore, there is double counting of the costs and cost savings of electrification measures in end-use sectors. |
Electricity generation from variable renewables is cheaper than generation from unabated gas, and costs are expected to fall further in future. As the electricity system decarbonises, with wind and solar displacing unabated gas, the underlying costs of electricity supply are expected to fall over time. Delivering the Balanced Pathway results in lower annualised system costs per unit of electricity than in the baseline, despite the significant investment required to decarbonise and expand the electricity system (Figure 7.5.8).
- The annualised system cost does not include transfers between groups in society (for example, legacy policy costs and taxes) and, as such, is different from the retail price of electricity. We have included projected carbon costs in the annualised system cost to reflect the costs of the UK Emissions Trading Scheme on generators.[367]
- Policy should ensure that electricity retail prices reflect the low cost of adding low-carbon capacity, so that barriers to electrification are reduced and electricity consumers benefit from cost reductions in these technologies. Shifting some legacy policy costs away from electricity would help to make electricity retail prices cheaper. For further details on the impacts on households, see Chapter 8.
Delivering the Balanced Pathway for electricity supply also results in a range of co-impacts and wider benefits to the economy.
- Industrial opportunities: the investment required to expand renewable generation, and to develop new markets in dispatchable low-carbon and storage technologies, will help create new opportunities for firms, exports, and jobs. A strong signal from government on the long-term pathway for these new sectors will help give industry and investors confidence to undertake the long-term investments required to unlock these benefits. For further details on industrial opportunities, see Chapter 9.
- Energy security: decarbonising and expanding the electricity system will reduce the UK’s dependence on fossil fuels, protecting consumers from volatile international prices. For further details, see Chapter 10.
- Air quality: switching from use of unabated fossil fuels for electricity generation to low-carbon generation technologies, such as wind and solar, will help improve local air quality.
| Figure 7.5.8 Annualised system cost per unit of electricity in the Balanced Pathway and the baseline |
 Description: The Balanced Pathway results in a lower annualised system cost than in the baseline, which remains broadly flat to 2050. Source: CCC and AFRY analysis. Notes: (1) The annualised system cost per unit of electricity is calculated as the sum of total annualised capital expenditure and operating costs (including projected UK ETS carbon costs) of electricity generation, storage, and network capacity on the system in a given year per unit of electricity supplied. (2) The annualised system cost per unit of electricity does not include transfers between groups in society (for example, legacy policy costs and taxes) and, as such, is different to the retail price of electricity. |
7.5.4 Key actions required to deliver the Balanced Pathway for electricity supply
Delivering the Balanced Pathway in electricity supply can only be achieved through a coordinated and strategic approach to delivery. The scale of build, when taken across the range of system components, is significant. However, the UK has effectively delivered rapid transformations in energy infrastructure before and delivery here is feasible and achievable (Box 7.5.2). Delivery will require the removal of barriers to deployment of critical infrastructure and policy gaps to be remedied, at pace. This will open up the path to major new investment. The key actions that are needed are as follows:
- Ensure that the funding and auction design for the Seventh Allocation Round (and future rounds) are sufficient to secure the level of renewables capacity required to deliver a decarbonised power system.
- Reform key processes and rules, including in planning, consenting, and regulatory funding, to enable rapid expansion of the country’s energy infrastructure and clear, consistent resolution of tensions between low cost of infrastructure and sensitivity to local conditions. In most cases, overhead lines should be favoured over more expensive methods such as undergrounding.
- Provide clarity around the future of electricity market arrangements and any transition arrangements as soon as possible. Delivering the portfolio of low-carbon flexibility and generation capacities needed will require new and reformed regulations, incentives, and business models, alongside ensuring existing schemes secure the level of capacities required. These must be put in place with urgency to enable the necessary investment decisions to be taken on a timely basis and at the appropriate scale.
- Ensure that large-scale biomass power plants are not given extended contracts to operate unabated at high load factors beyond 2027. Biomass feedstocks used must be sustainably sourced.
- Ensure resilience is considered from the outset. It is critical that the system is designed to be resilient to extreme weather, including low wind years and wind droughts. This must be informed by historical precedent alongside further research on the expected effects of climate change. Building climate change resilience into this asset investment programme will require appropriate governance arrangements, systematic risk assessments, and appropriate resilience standards across the system. If climate resilience is neglected, there is significant risk of locking in increased climate vulnerability or additional costs later on.
| Box 7.5.2 Previous energy transitions in the UK |
The UK has successfully delivered rapid transformation in energy infrastructure before.
These transitions delivered significant growth in electricity supply. Generation increased from 76 TWh in 1951 to around 385 TWh in 2001, with generation doubling in the 10 years to 1961 and again to 1971.[371] |
7.6 Aviation
Key messages
Today: aviation is currently the sixth highest-emitting sector in the UK economy. In 2023, aviation accounted for 8% of UK emissions, 35.4 MtCO2e.
CB7 period: by 2040, aviation emissions fall by 17% in the Balanced Pathway, relative to 2023. Aviation will account for 29.5 MtCO2e of UK GHG emissions and will be the UK’s highest-emitting sector. The sector will also be contributing financially to engineered removals.
By 2050: this sector can reach Net Zero emissions through the roll-out of sustainable aviation fuel (SAF), improved efficiencies, electrification of planes, managing growth in aviation demand, and paying for engineered removals to offset residual emissions.
Our key messages are:
- The aviation sector needs to take responsibility for its emissions reaching Net Zero by 2050. The cost of decarbonising aviation and addressing non-CO2 effects should be reflected in the cost to fly. This will help manage growth in aviation demand in line with Net Zero.
- Low-carbon aviation technologies are at an early stage of development and the balance between them is uncertain – multiple options should be pursued. Government may need to take additional demand management measures if aviation sector emissions are not developing in line with Net Zero.
- The UK should continue to push for higher ambition through the International Civil Aviation Organisation (ICAO) and the Carbon Offsetting and Reduction Scheme for International Aviation (CORSIA). The UK should also pursue opportunities to go further, such as forming progressive alliances with countries who are aligned with the UK.
- Aviation’s non-CO2 effects must be addressed – they are likely to have a high warming effect, though the level of their exact impact on temperature change is uncertain.
7.6.1 Emissions in aviation
Emissions in aviation were 35.4 MtCO2e in 2023. This is 69% higher than 1990 levels and currently accounts for 8% of UK emissions. In 2023, 93% of aviation emissions came from international flights, 4% from domestic flights, and 3% military aviation.[372] The Government has committed to including international aviation and shipping emissions in the Sixth Carbon Budget and Net Zero.
- The most significant driver of aviation emissions since 1990 has been rising demand for international flights (which accounted for 74% of total aviation emissions in 1990) being only partly compensated for by improved efficiencies. Between 1990 to 2023, international flight passengers increased by 208%, while domestic flight passengers increased by 38%.[373]
- Survey data shows that in 2010, 78% of surveyed passengers were travelling for leisure and 22% for business.[374] By 2023, 86% of surveyed passengers were travelling for leisure and 14% for business.[375]
- In 2010, international leisure flights accounted for 72% of passengers; by 2023, this increased to 82%.
- There was a sharp drop in flights during the COVID-19 pandemic. Aviation emissions have now almost rebounded to pre-pandemic levels, with 2023 emissions reaching 90% of 2019 levels.
- Efficiency improvements such as increased plane loadings have reduced the fossil fuel intensity of aviation from 0.76 kWh/passenger-km in 1990 to 0.42 kWh/passenger-km in 2023.
- Aviation’s non-CO2 effects refer to the additional climate impacts from aviation not due to GHG emissions, such as line shaped contrails, high cloud increases, and the impacts from air pollution (see Box 7.6.3). Since 1990, the warming effect of non-CO2 effects has tripled.
7.6.2 The Balanced Pathway for aviation
In our Balanced Pathway, aviation emissions are projected to fall, relative to 2023 levels, by 17% to 29.5 MtCO2e by 2040 (the middle of the Seventh Carbon Budget period). As other sectors decarbonise, aviation’s share of UK emissions is set to increase to 27% by 2040, making it the UK’s highest-emitting sector. By 2050, aviation emissions fall to 22.7 MtCO2e, a 36% decrease from 2023 (Figure 7.6.1). The key values that underpin this pathway are summarised in Table 7.6.1.
|
Figure 7.6.1 Aviation emissions by subsector – historical (2008–2023) and Balanced Pathway (2025–2050) |
|
|

| Table 7.6.1 Key values in the Balanced Pathway for aviation |
|||||||
|---|---|---|---|---|---|---|---|
| 2025 | 2030 | 2035 | 2040 | 2050 | |||
| Emissions | Emissions in year | 36.7 | 33.5 | 30.1 | 29.5 | 22.7 | |
| Change in emissions since 1990 | +75% | +60% | +44% | +41% | +8% | ||
| Change in emissions since 2023 | +4% | -5% | -15% | -17% | -36% | ||
| Share of total UK emissions | 9% | 11% | 16% | 27% | |||
| Key drivers – quantity variables | Percentage of liquid fuel demand that is SAF | 1.3% | 6% | 12% | 17% | 38% | |
| Annual average percentage efficiency improvement | 1.3% | 1.3% | 1.3% | 1.3% | 1.3% | ||
| Change in aviation passenger numbers as a percentage of 2025 levels | -0.6% | +2% | +10% | +28% | |||
| Kilometres flown per capita per year (passenger-km) | 5,781 | 5,856 | 6,148 | 6,703 | 7,621 | ||
| Key drivers – price variables | Synthetic fuel long-run variable cost (p/kWh)* | 62 | 38 | 35 | 33 | 29 | |
| Source: CCC analysis. Notes: We have blanked out the share of total UK emissions in 2050 because total UK emissions have reached Net Zero at this point. *Aviation’s Balanced Pathway includes multiple types of SAF, each with different estimated costs. This table shows the long-run variable cost of synthetic fuel as this will likely be the marginal unit of fuel during the Seventh Carbon Budget period. The long-run variable cost includes the components of the retail price that represent actual costs to society that vary according to the level of consumption and is used throughout our fuel costing analysis. |
|||||||
Key elements of the Balanced Pathway for aviation
In the Balanced Pathway for aviation, the largest share of emissions reduction by the Seventh Carbon Budget period comes from managing forecast aviation demand growth. This is followed by SAF uptake, efficiency improvements, and the roll-out of hybrid-electric aircraft and battery-electric aircraft (Figure 7.6.2). Engineered removals, paid for by the aviation industry, begin to offset a portion of aviation emissions. These are accounted for in the engineered removals sector (see Section 7.12). Figure 7.6.2 shows indicative emissions for 2040 and 2050 if this share of removals were included.
The exact balance between these measures is uncertain, but all must be pursued to ensure that the overall emissions contribution of the aviation sector is Net Zero by 2050. If low-carbon aviation technology deployment is slower than expected, more demand management may be needed. Conversely, if technologies deploy more rapidly, aviation demand could be higher provided emissions are on track to Net Zero.
| Figure 7.6.2 Sources of abatement in the Balanced Pathway for aviation |
 Description: The largest share of emissions reduction in aviation during the Seventh Carbon Budget period is from managing forecast aviation demand growth. By 2050, it is from SAF. Contributions also come from efficiency improvements and low- and zero-emission aircraft. All residual emissions are offset by engineered removals by 2050. Source: DESNZ (2024) Provisional UK greenhouse gas emissions national statistics 2023; DESNZ (2024) Final UK greenhouse gas emissions national statistics 1990-2022; CCC analysis. Notes: (1) We generally account for emissions reductions due to measures to reduce demand for high-carbon activities (including low-carbon choices and efficiencies) first, before the impact of low-carbon technologies. (2) It was not possible to separate abatement from efficiency improvements and low- and zero-emission aircraft in Department for Transport aviation model runs for the CCC. (3) By 2050, all remaining aviation emissions are offset using engineered removals. This corresponds to aviation accounting for an indicative share of around 60% of the total UK engineered removals in 2050. This chart shows this with purple circles, which assumes that aviation also receives the same share of available engineered removals in 2040 (equating to around 13 MtCO2e of removals). This is highly uncertain as the shares of removals, SAF, efficiency improvements, and new aircraft will be determined by their individual technology development progress, relative costs, and the market. |
The key measures that combine to reduce emissions in aviation are:
Net Zero-aligned aviation demand (54% emissions reduction in 2040). Aviation demand can only grow if technology roll-out progresses and begins to abate and offset aviation emissions, with demand management playing an important role in reducing emissions in the 2020s and 2030s while availability of SAF and engineered removals is limited. In the 2040s, aviation demand starts to increase at a faster rate in the Balanced Pathway, as GDP increases and technology becomes more available.
- The Government’s high carbon value is included in the cost of flying used to forecast future demand, to account for uncertainties in technology development, likely high SAF and engineered removals costs, and non-CO2 effects.[376] Our cost analysis for engineered removals and direct air capture for synthetic fuel production is discussed in Section 7.12.
- Compared to 2025 levels, aviation passenger demand increases by 2% by 2035 (to 319 million passengers), 10% by 2040 (to 345 million passenger), and 28% by 2050 (to 402 million passengers).[377] See Chapter 8 for information on what this means for households.
- Aviation demand projections are uncertain. Our analysis uses the Department for Transport’s aviation modelling suite to forecast demand.[378] Key uncertainties include UK GDP, foreign GDP, and market elasticity assumptions (see Chapter 6).[379]
- In the Balanced Pathway, per-capita aviation passenger-kilometres in 2040 are 16% above 2025 levels, which is a considerably lower increase than in the baseline, in which per-capita demand grows by 53% by 2040.[380]
- Our analysis assumes that the aviation industry adopting the cost of aviation decarbonisation will help manage demand. Additional policy may be required if technology does not deliver at the required rate. Chapter 8 outlines the implications of aviation’s Balanced Pathway for households, Box 7.6.1 outlines findings from the Committee’s citizens’ panel on aviation, and Box 7.6.2 outlines potential policy options.
- There is a small demand reduction effect from assuming modal shift from flying to rail for some flights. The rate of business flight demand growth increases in line with recent historical data, where the growth in demand has not been as large as for leisure flights.
- To protect essential connectivity flights, we do not assume any demand management for domestic flights to or from Northern Ireland or the Scottish Highlands and Islands.
- Aviation’s non-CO2 effects increase with demand growth (Box 7.6.3). Compared to 2025 levels, warming from aviation’s non-CO2 effects is expected to increase by 7% by 2040 and, by 2050, it is expected to be 19% above 2025 levels.
Sustainable aviation fuel (33% of emissions saving in 2040). SAF meets 6% of total fuel demand in 2030, 17% in 2040, and 38% by 2050. This trajectory is lower than the Government’s SAF trajectory due to the expected supply constraints in the late 2020s and 2030s, long-term uncertainties regarding the costs and supply of SAF, particularly synthetic fuels, and projected cost effectiveness of engineered removals compared to SAF.
- Cross-economy assumptions and resource constraints, for example on the supply of sustainable biomass (see Section 7.7), impact the level of SAF available to the aviation sector. Alongside this, demand for feedstock supply will likely be highly competitive, particularly in the late 2020s and 2030s, due to demand from SAF targets in the US, EU, and China.
- Our SAF trajectory also reflects that direct air carbon capture and storage (DACCS) may be more cost effective compared to producing synthetic fuels.
- In the Balanced Pathway, we assume that domestically produced synthetic fuels and engineered removals will be available to the aviation sector from the mid-2030s.
- Our cost estimates find that DACCS is cheaper than synthetic fuels in the Seventh Carbon Budget period and out to 2050 (see Section 7.12). This is due to the multiple expensive inputs (low-carbon hydrogen and captured carbon) and energy conversion losses incurred in the synthetic fuel production process, compared to the costs of capturing and storing carbon. Despite this, we include some synthetic fuels in the Balanced Pathway, to reflect the uncertainty in costs and the need to maintain optionality at this stage.
- Current international emissions reporting guidelines are unclear regarding reporting of emissions savings derived from imported synthetic fuels. Due to this ambiguity, our analysis assumes synthetic fuels are produced in the UK.[381];[382] In practice, future SAF production and supply is likely to operate in an international market. IPCC inventory guidelines will need to be clarified to allow for imported synthetic fuels to contribute to UK territorial emissions savings.
Efficiency improvements and hybrid- and zero-emission aircraft (13% of emissions savings in 2040). Fuel, operational, and air transport movement efficiencies improve to reduce the carbon intensity of flying by 1.3% per year on average between 2025 and 2050. It is likely that hybrid-electric aircraft will enter the UK fleet around 2030, although due to modelling constraints they enter our pathway in 2040. Battery-electric aircraft enter the fleet in 2040 in our pathway. Hydrogen aircraft may contribute to meeting the UK’s Net Zero target and beyond but are insufficiently developed for inclusion in this advice.
Permanent engineered removals for the aviation sector. By 2050, all residual aviation emissions are offset using permanent engineered removals to balance the long-lived CO2 emissions from fossil fuels. This corresponds to aviation accounting for around 60% of the total engineered removals in the Balanced Pathway. If it is assumed that aviation receives around the same share of available engineered removals in 2040, this equates to around 13 MtCO2e of removals. However, this level is indicative as the shares of removals, SAF, and other measures will be determined by their individual technology development progress, relative costs, and the market. The effect of engineered removals on emissions is accounted for in the engineered removals sector (see Section 7.12).
Key indicators for aviation
The key indicators of the changes required to deliver the Balanced Pathway for aviation include metrics on the SAF uptake rate, levels of aviation demand, and non-CO2 effects (Figure 7.6.3).
| Figure 7.6.3 Key indicators for the aviation sector |
 Description: The key indicators for aviation in the Balanced Pathway show an increase in aviation demand, non-CO2 effects, SAF supply, and efficiency improvements. Synthetic fuels undergo cost reduction out to 2050. Source: Historical data from DESNZ and DfT; CCC analysis. Notes: (b) To account for non-CO2 effects on global warming lasting between 10 and 20 years, warming equivalents are calculated based on a 20-year average. Warming from non-CO2 effects therefore increase around 2040 as the lower non-CO2 effects from decreased demand during the COVID-19 pandemic are no longer within the 20-year average; (f) UK-produced synthetic fuel enters the pathway in the mid-2030s and will likely be the marginal unit of fuel. |
| Box 7.6.1 Aviation demand in the citizens’ panel |
| The Committee convened a citizens’ panel to explore what an accessible, attractive, and affordable vision of Net Zero looks like for households (see Chapter 8 for further details). Among other topics, the panel explored the acceptability and affordability of different policy options for managing aviation demand. In general, there was broad acceptance of the need to manage future demand.
Panel members:
After discussing a range of policy options to manage aviation demand, panel members:
|
| Box 7.6.2 Options for managing aviation demand growth |
| It is likely that a mixture of approaches will be required to manage aviation demand growth in line with Net Zero. Most demand management policies will increase ticket prices, either directly through taxes or indirectly through technology costs passed on by the aviation industry. Tax levers can raise revenue and allow the Government to account for distributional impacts, while other approaches leave the industry to identify the most efficient approach.
Price elasticities indicate the need for relatively large changes in price to moderate demand, though evidence on this is limited.[383];[384];[385] While future ticket prices and UK income are highly uncertain, as an example, if the Government’s high carbon value is applied to aviation emissions and airlines are assumed to pass 100% of costs onto tickets, by 2050, a return ticket from London to Alicante, Spain would increase by about £150, and a return ticket from London to New York would increase by about £300. This is an increase of 2–4% respectively of the estimated increase in annual real household income per capita between 2023 and 2050.[386];[387] The Committee’s citizens’ panel was broadly accepting of the need for this scale of ticket price increase by 2050. The main potential levers for managing aviation demand are:
Other policy levers could also play a supplementary role:
Domestic-focused policies would have a smaller overall impact:
|
| Box 7.6.3 Non-CO2 effects of aviation |
| In addition to the warming effects from CO2, further climate impacts from aviation result from nitrogen oxides, water vapor, black carbon (soot), and sulphur dioxide emissions. These pollutants affect the climate in different ways. For example, nitrogen oxides have a warming effect, while in most cases sulphates have a cooling effect. Water vapor from planes can also create contrails, which are long trails of cloud caused by aircraft flying through supersaturated air, depending on the local atmospheric conditions. These high-altitude contrails can help the formation of cirrus clouds, which have a relatively large warming effect on the global surface air temperature.
Non-CO2 effects likely have a high warming effect, though the level of their exact impact on temperature change is uncertain. Non-CO2 effects are estimated to contribute around two-thirds of aviation’s total effective radiative forcing globally – twice as much as historical CO2 emissions from aviation. But CO2 emissions are much longer-lived than non-CO2 effects.
Overall, the net aviation non-CO2 effect is to warm the climate in both the baseline and the Balanced Pathway, but its magnitude is lower in the Balanced Pathway (Figure 7.6.4).
Demand management is the most effective approach to limit warming impacts from non-CO2 effects.
|
| Figure 7.6.4 Contribution to global warming from UK aviation CO2 emissions and non-CO2 effects in the baseline and Balanced Pathway |
 Description: Global warming from UK aviation CO2 and non-CO2 effects increases in both the baseline and Balanced Pathway, but increases more in the baseline. Source: Lee at al. (2020) The contribution of global aviation to anthropogenic climate forcing for 2000 to 2018; Forster, P.M. et al (2024) Indicators of global climate change 2023: annual update of key indicators on the state of the climate system and human influence; CCC analysis. Notes: (1) The chart shows the contribution to global temperature increases due to cumulative CO2 emissions, and from total CO2 emissions and non-CO2 effects, from the UK aviation sector in the baseline and Balanced Pathway. These have been indexed to the latest observed level of greenhouse gas-induced global warming (1.57ºC in 2023), using the same approach as in Figure 3.11. (2) To account for non-CO2 effects on global warming lasting between 10 and 20 years, warming equivalents are calculated based on a 20-year average. Warming from non-CO2 effects therefore increases around 2040 as the lower non-CO2 effects from decreased demand during the COVID-19 pandemic are no longer within the 20-year average. |
7.6.3 Costs, cost savings, and co-impacts
Our costing analysis for the aviation sector accounts for changes in capital expenditure from efficiency and demand, and changes in operating expenditure from SAF, efficiency, and demand (Figure 7.6.5). Both capital and operating expenditure to generate SAF are accounted as aviation sector operating costs. Engineered removals costs are accounted for in the engineered removals sector (see Section 7.12).
- Net Zero-aligned aviation demand: the effect of demand management compared to the baseline results in less demand, leading to fewer aircraft in the fleet and lower kerosene fuel supply. This represents the direct saving from demand management and is not a macroeconomic analysis of aviation demand growth.
- Sustainable aviation fuel: SAF operating costs are driven by the level of SAF in the Balanced Pathway. Biomass and synthetic fuel SAF are the dominant SAF fuels by 2050. CCC long-run variable costs estimate that synthetic fuels will be around seven times more expensive than kerosene in 2050 and biomass SAF twice as expensive. SAF costs are highly uncertain, particularly for synthetic fuels given they have not yet entered the market.
- Efficiency improvements and low- and zero-emission aircraft: capital costs are driven by efficiency improvements and hybrid-electric aircraft, which begin to enter the fleet in 2030. Operating cost savings increase as efficiency improvements progress and new aircraft enter the fleet. There was insufficient data to include the cost of battery-electric aircraft but given the small emissions savings from these aircraft in the Balanced Pathway, this is expected to be a relatively small cost.
- Engineered removals: engineered removals costs are accounted for in the removals sector. The Balanced Pathway largely assumes a ‘polluter pays’ principle, where those sectors with residual emissions are expected to reduce their net contribution to UK emissions to Net Zero, whether through in-sector emissions reductions or using removals to offset ongoing emissions. In the Balanced Pathway, the aviation sector is responsible for around 60% of engineered removals required in 2050 and therefore would be expected to fund around 60% of the cost.
In addition, in the Balanced Pathway, noise and air pollution levels will be lower compared to the baseline, however, flying will continue to have these impacts. See Chapter 8 for more discussion of co-impacts for households.
| Figure 7.6.5 Costs and cost savings in the Balanced Pathway for aviation, compared to the baseline |
 Description: SAF operating costs and efficiency capex are cost drivers in the aviation pathway due to SAF uptake and efficiency improvements and new aircraft. Demand and efficiency opex are cost saving due to fewer planes, lower fuel use, and improved efficiencies. Source: CCC analysis. Notes: Capex is additional capital expenditure and opex is additional operating expenditure. Both are additional in-year costs in 2023 prices, relative to a baseline of no further decarbonisation action. |
7.6.4 Key actions required to deliver the Balanced Pathway for aviation
Delivering the Balanced Pathway in aviation requires effective government policy, sustained progress in building technologies and markets, and the aviation industry strengthening action to support its own decarbonisation. The key actions that are needed are as follows:
- Develop and implement policy – such as the existing SAF mandate and the UK ETS – that ensures the aviation sector takes responsibility for mitigating its emissions and ultimately achieving Net Zero for the sector by 2050. This includes paying for permanent engineered removals to balance out all remaining emissions. By 2050, the sector should be paying the full cost of making aviation emissions Net Zero, with contributions scaling up prior to that. Other complementary policies should also be put in place, such as an effective UK ETS carbon price to stimulate both SAF production and engineered removals.
- Ensure robust contingencies are in place to address any delays in decarbonisation, including through demand management. The next ten years are crucial for the development and deployment of aviation technology. If technology is not on track in the near term to deliver what is required for the Seventh Carbon Budget and Net Zero, or if aviation sector emissions are not in developing line with Net Zero, government and industry will need to be ready to implement more demand management policy (see Chapter 6). Government also has a role to ensure the distributional impacts of demand management are considered (see Chapter 8).
- Commit, as a minimum, to preventing the additional warming impacts from aviation beyond GHG emissions (known as non-CO2 effects) increasing after 2050. Begin to monitor these impacts and support investigation, development, and trial of mitigation options that complement rather than substitute for CO2 mitigation.
- Seek to strengthen the ambition and effectiveness of ICAO objectives and CORSIA. Form alliances with countries who are aligned with the UK to go further than ICAO on both emissions and non-CO2 effects. For instance, the UK and other countries could align ETS scopes to include some or all international flights. See Section 10.1.3 for discussion of the interaction between offsetting mechanisms in the aviation sector and the use of international credits.
- Consider the case for continued support for innovation in efficiency improvements and new aircraft technology. There is a strategic case for the UK to be at the forefront of the development of efficiency improvements in aviation and zero-emission aircraft. The UK has a world-leading and mature aerospace sector with the experience and capability to get new aircraft concepts to market. Current zero-emission aircraft concepts would also be able to service essential services and connectivity flights such as those for the Scottish Highlands and Islands and between Northern Ireland and Great Britain.
7.7 Fuel supply
Key messages
Today: fuel supply is currently the seventh highest-emitting sector in the UK economy. In 2023, fuel supply accounted for 7% of UK emissions, 31.1 MtCO2e.
CB7 period: by 2040, fuel supply emissions fall by 83% in the Balanced Pathway, relative to 2023. Fuel supply will account for around 5.4 MtCO2e of UK GHG emissions and will be the UK’s sixth highest-emitting sector.
By 2050: this sector largely decarbonises through falling activity in the oil and gas sector and electrification and CCS in production.
Our key messages are:
- Fossil fuel supply emissions will be declining over time (even without new policy in the sector) due to shrinking North Sea oil and gas production and reducing demand from the electrification of transport, buildings, and industry.
- Government should work with communities, workers, and businesses in the oil and gas industry to develop proactive transition plans that enable access to secure employment and business opportunities.
- A mix of hydrogen production options will be needed to meet hydrogen demand, including from clean electricity and use of natural gas with CCS.
- Government should fast-track low-regret hydrogen infrastructure development, including networks and storage. These investments have long lead-times and action will need to start soon to enable them to be available from the 2030s.
- Sustainable bioenergy has an important but limited role in enabling decarbonisation, met by increasing domestic supply of energy crops and a declining long-term role for imports.
- Government should publish a common sustainability framework for biomass, along with robust procedures for monitoring, reporting, and verification, to ensure bioenergy use is low carbon and does not have adverse impacts such as on land use, nature, and food security.
7.7.1 Emissions in the fuel supply sector
Emissions in the fuel supply sector were 31.1 MtCO2e in 2023, 60% lower than 1990 levels.
- Emissions are currently dominated by fossil fuel production and refining, and to a lesser extent gas distribution. They are predominantly CO2 (84%), with a smaller contribution from methane (16%).
- The reduction in emissions since 1990 has been driven by an 87% reduction in methane emissions due to the phasing out of coal production and a reduction in leakage from natural gas supply. CO2 emissions have fallen by 33% due to reduced North Sea oil and gas production and refining.
7.7.2 The Balanced Pathway for fuel supply
In our Balanced Pathway, fuel supply emissions are projected to fall, relative to 2023 levels, by 83% to 5.4 MtCO2e by 2040 (the middle of the Seventh Carbon Budget period) and to 1.6 MtCO2e by 2050 (Figure 7.7.1). This includes reductions in production emissions in fossil fuel supply as well as a small amount of additional emissions in the supply of low-carbon fuels. The key values that underpin this pathway are summarised in Table 7.7.1.
| Figure 7.7.1 Fuel supply emissions by subsector – historical (2008–2023) and Balanced Pathway (2023–2050) |
 Description: Fuel supply emissions have almost halved between 2008 and 2023, with solid fuel production (coal) almost phased out. In the Balanced Pathway, emissions continue to fall, reaching close to zero by 2050. Source: DESNZ (2024) Provisional UK greenhouse gas emissions national statistics 2023; DESNZ (2024) Final UK greenhouse gas emissions national statistics: 1990 to 2022; CCC analysis. Notes: (1) Solid colours, to the right of the line, represent our modelled pathway emissions in each subsector from 2025. Pale shades, to the left of the line, show historical subsector emissions data up to 2023 and then our modelled expectations based on existing trends and policies for past years for which data are not yet available. (2) Emissions from biomethane injection into the gas grid are negative as this displaces emissions from fossil gas used economy wide. These savings reduce over time as fossil gas use declines in buildings, industry, and electricity supply, alongside introducing carbon capture technology to biomethane production. We account for this abatement in the fuel supply sector, rather than spreading it across all gas users; total economy-wide emissions are unaffected. |
| Table 7.7.1 Key values in the Balanced Pathway for fuel supply |
||||||
|---|---|---|---|---|---|---|
| 2025 | 2030 | 2035 | 2040 | 2050 | ||
| Emissions | Emissions in year (MtCO2e) | 27.4 | 15.8 | 8.5 | 5.4 | 1.6 |
| Change in emissions since 1990 | -65% | -80% | -89% | -93% | -98% | |
| Change in emissions since 2023 | -12% | -49% | -73% | -83% | -95% | |
| Share of total UK emissions | 7% | 5% | 5% | 5% | ||
| Key drivers – quantity variables | Oil production (mtoe) | 32 | 24 | 17 | 13 | 7 |
| Gas production (mtoe) | 28 | 16 | 10 | 6 | 2 | |
| Low-carbon hydrogen production: electrolysis (TWh) | 0 | 3 | 23 | 33 | 72 | |
| Low-carbon hydrogen production: methane reformation with CCS (TWh) | 0 | 11 | 14 | 26 | 29 | |
| Electrolyser capacity (GW) | 0 | 1 | 8 | 10 | 20 | |
| Methane reformation with CCS capacity (GW) | 0 | 1 | 2 | 4 | 7 | |
| Hydrogen storage capacity (TWh)* | 0 | <1 | 2 | 3 | 5-9 | |
| Key drivers – price variables | Low-carbon hydrogen production: electrolyser (PEM) capital cost (£/kW) | 596 | 264 | 196 | 185 | 185 |
| Low-carbon hydrogen production: methane reformation with CCS capital cost (£/kW) | 554 | 520 | 488 | 458 | 403 | |
| Source: NSTA (2024) March 2024 Projections of UK Oil and Gas Production and Expenditure; CCC analysis. Notes: We have blanked out the share of total UK emissions in 2050 because total UK emissions have reached Net Zero at this point. (2) All costs are in 2023 prices. *Range for hydrogen storage capacity reflects uncertainty in the balance of gas CCS and hydrogen in low-carbon dispatchable generation in electricity supply. |
||||||
Key elements of the Balanced Pathway for fossil fuel production
Emissions are produced directly from the operation of oil and gas platforms, oil refineries, and gas distribution. Decarbonisation of end-use sectors reduces demand for oil and gas, and the associated refining and distribution emissions. Abatement measures are then applied to decarbonise the remaining production activity (Figure 7.7.2).
| Figure 7.7.2 Sources of abatement in the Balanced Pathway for fuel supply |
 Description: The largest share of emissions reduction in fuel supply is from fuel switching, and the second largest source is CCS in oil refineries. Smaller contributions also come from reduced flaring and venting on offshore platforms, and decreased methane leakage from gas distribution. Source: DESNZ (2024) Provisional UK greenhouse gas emissions national statistics 2023; DESNZ (2024) Final UK greenhouse gas emissions national statistics: 1990 to 2022; CCC analysis. Notes: (1) We generally account for emissions reductions due to measures to reduce demand for high-carbon activities (including low-carbon choices and efficiencies) first, before the impact of low-carbon technologies. (2) Emissions starting point is lower than the latest historical emissions because we account for abatement from biomethane injection into the gas grid in the fuel supply sector, rather than spreading across all gas users; total economy-wide emissions are unaffected. (3) The increased emissions from production of low-carbon fuels are included as a reduction in the size of the ‘Fuel switching’ wedge. |
The key elements that combine to reduce emissions in fossil fuel supply are:
Reducing emissions in the baseline. Declining production from the UK’s mature North Sea basin means emissions fall in the baseline by around 40% by 2040 compared to 2025 levels, including the production emissions from potential new oil and gas fields (see Section 10.2).
Switching away from fossil fuels across the economy (29% of emissions reduction in 2040). In the Balanced Pathway, overall economy-wide oil and gas demand reduces by 65% from 2025 to 2040, as end-use sectors move away from fossil fuels to low-carbon energy sources. This reduces emissions from refining fossil fuels.
Emissions reductions in production processes and distribution (71% of emissions reduction in 2040). After taking account of the reduction in production and refining emissions due to declining baseline activity and cross-economy fuel switching, only around 13 MtCO2e of emissions remain by 2040. In the Balanced Pathway, around 60% of these remaining emissions are abated, meaning overall emissions fall to 5.4 MtCO2e in 2040.
- Oil and gas platforms: the majority of abatement results from electrification of offshore oil and gas platforms, and from reducing methane flaring and venting.
- Electrification of assets such as generators and compressors on offshore platforms delivers 1.2 MtCO2e of abatement in 2040.
- 0.4 MtCO2e of emissions are abated by 2040 by reducing flaring and venting.
- Oil refineries: CCS is the main emissions reduction measure for remaining refinery production, abating 3.6 MtCO2e in 2040. Refineries also serve the chemicals industry – abatement of these processes is covered in Section 7.3.
- Gas distribution: 2.1 MtCO2e of emissions are abated in 2040 due to an overall reduction in gas production and from a reduction in methane leakage.
Key elements of the Balanced Pathway for low-carbon fuels
In addition to decarbonising fossil fuel supply, low-carbon fuels (including hydrogen, bioenergy, and synthetic aviation and shipping fuels) are required for use in sectors where electrification is not feasible. This section sets out how these fuels are produced and their role in the Balanced Pathway.
Low-carbon hydrogen
The role for the hydrogen supply sector is to enable decarbonisation in the wider economy and energy system, displacing use of unabated fossil fuels. Hydrogen will also need to be transported and stored, to allow supply to match with demand. Our modelling co-optimises electricity and hydrogen production, given the interactions between these two systems (see Section 7.5). Overall, in the Balanced Pathway hydrogen demand increases to nearly 60 TWh in 2040 (see Chapter 10), with supply primarily a mix of electrolysis (54%) and fossil methane reformation with CCS (44%), with the remainder from bio-hydrogen.
- Electrolysis: this method produces hydrogen by using electricity to split water into its hydrogen and oxygen molecules. When using zero-carbon electricity there are no CO2 emissions from the production process. This is the main source of hydrogen (33 TWh in 2040) in the Balanced Pathway.
- Supply of surplus zero-carbon electricity for use in electrolytic hydrogen production is likely to be limited, particularly in the short-to-medium term. This is due to constraints on the roll-out of renewables and the rate of electrification of the wider economy, for which use of zero-carbon electricity from renewables should be prioritised given the much higher emissions-saving potential (see Chapter 10). In addition, availability of hydrogen storage is likely to be constrained up to the 2040s.
- There is not sufficient electrolytic hydrogen to meet all hydrogen demand in our pathway, so other sources of low-carbon hydrogen will be needed.
- Fossil methane reformation with CCS: this method splits methane gas molecules into CO2 and hydrogen, with CCS applied to capture 95% of the resulting emissions. While scalable, it is not zero-carbon, so the resulting ‘blue’ hydrogen (27 TWh in 2040) helps to meet demand and plays a role in providing flexible backup for meeting hydrogen demand in low-wind years.
- The main constraint on blue hydrogen production is the availability of CCS. In the Balanced Pathway, blue hydrogen production is situated in industrial clusters and becomes available as CCS is deployed from 2028.
- The emissions impact of blue hydrogen production is limited (less than 0.5 MtCO2e in all years to 2050 in the Balanced Pathway – see Figure 7.7.1). These increased emissions are captured within the fuel switching category in Figure 7.7.2, and they are offset by engineered removals in our overall pathway (see Section 7.12).
- Biomass gasification with CCS: in this method, biomass is gasified to produce bio-hydrogen, with the biogenic CO2 being captured and stored. This therefore provides a source of CO2 removals. Bio-hydrogen production is not projected to comprise a major proportion of future hydrogen supply (2 TWh in 2040), due to constraints on sustainable biomass feedstock availability and alternative uses in other forms of bioenergy with CCS (BECCS – see below). However, keeping open the option of deploying bio-hydrogen will be important given the value of the CO2 removals it provides.
- Hydrogen infrastructure: a new infrastructure for transportation and storage of hydrogen will be required for the delivery of the Balanced Pathway, to connect supply and demand both geographically and over time.
- Networks: a hydrogen transmission network will be needed to connect production with sources of storage and demand, and to provide system resilience and encourage competition between hydrogen producers.
- We have modelled a transmission network which connects industrial clusters, starting in the north of England in the early 2030s and expanding to Scotland, Wales, and other parts of England over the remainder of the decade.
- Outside of some localised industrial applications we do not model a hydrogen distribution network. Given the declining role of natural gas, in the longer term the gas distribution network will likely need to be decommissioned.
- Storage: there will be an important role in the future energy system for long-term storage of both natural gas and hydrogen. These will help provide low-carbon sources of generation for balancing the electricity system and managing low-wind periods, through use in gas CCS and hydrogen power stations (see Section 7.5). The Balanced Pathway has 3 TWh of hydrogen storage in 2040, primarily provided by salt caverns. This storage capacity could increase three-fold by 2050, depending on the balance of hydrogen-powered electricity in low-carbon dispatchable electricity generation.
- Networks: a hydrogen transmission network will be needed to connect production with sources of storage and demand, and to provide system resilience and encourage competition between hydrogen producers.
Bioenergy supply
Sustainable bioenergy plays an important role in the Balanced Pathway and, when combined with CCS, can provide a valuable source of CO2 removals. However, supply of sustainable bioenergy is likely to be limited both in the UK and globally, meaning that its use must be prioritised in the highest-value applications and sustainability standards must be met. Sustainable bioenergy depends on minimising losses of land carbon stocks, supply chain emissions, and adverse biodiversity and land use impacts. The Balanced Pathway shows overall primary domestic bioenergy supply growing to around 100 TWh in 2040 (Figure 7.7.3), driven by increasing energy crop production and diversion of waste materials. We assume a declining role for imported biomass in the longer term, given global governance and sustainability challenges.
- Most growth in domestic bioenergy supply comes from increasing production of perennial energy crops (miscanthus, short rotation coppice, and short rotation forestry – see Section 7.4), with smaller contributions from forestry and agricultural residues, and waste materials.
- Domestic feedstocks are expected to play a larger role than biomass imports, with a declining role for imports. The share of domestic bioenergy supply grows from around 60% in 2025 to 85% in 2040. By 2050, net imports are close to zero.
- Total bioenergy supply is around half the level assumed in our Sixth Carbon Budget advice, reflecting limited progress in tree planting, lower estimates of forestry residue availability, and an approach to minimise imports considering land use and biodiversity implications (see Section 7.4).
|
Figure 7.7.3 Domestic bioenergy supply to 2050 in the Balanced Pathway |
|
|

Synthetic fuel production
Synthetic fuels combine low-carbon hydrogen with a source of CO2 recovered from the atmosphere (via direct air capture, for example) to make a carbon-neutral fuel. In the Balanced Pathway, 13 TWh of synthetic fuels are produced in 2040, which requires 18 TWh of low-carbon hydrogen and 3 MtCO2 of CO2 via direct air capture (see Section 7.12). Under current accounting rules, we assume these fuels are produced domestically (Box 7.7.1).
- Production of synthetic fuels requires a combination of physically inefficient processes: for example, catalytically converting low-carbon hydrogen and captured CO2 into syngas, and then transforming the syngas into liquid hydrocarbon fuels via a Fischer-Tropsch process. Given these energy conversion losses, synthetic fuels are likely to remain expensive, particularly compared to DACCS (see Section 7.6 and Section 7.12).
- Deployment of synthetic fuels will therefore be limited both by the availability of the required inputs and by cost. As a result, they are only likely to be economical for use in extremely high-value activities or where their use displaces high-carbon alternatives for which other low-carbon options are not yet available (for example, aviation).
- As costs and technology development are uncertain, we include some synthetic fuels in the Balanced Pathway for both aviation and shipping, to reflect the value in maintaining optionality in the pathway optionality at this stage (see Section 7.6 and Section 7.10).
| Box 7.7.1 Definition and accounting of synthetic fuels |
We define synthetic fuels as those produced using hydrogen and a source of carbon recovered from the atmosphere (via direct air capture, for example). They are liquid hydrocarbons that can directly replace fossil fuels in jet engines and shipping vessels.
The deployment of synthetic fuels in the Balanced Pathway is influenced by the current international emissions accounting framework:
|
Imported fuels
The majority of fuels currently used in the UK are traded internationally, and the UK is a net importer of both oil and gas (see Chapter 10).[393] In addition, electricity is traded through interconnection with European countries. The future role for internationally traded low-carbon commodities is unclear, given uncertainty around policy, technology development, costs, and demand, both in the UK and globally. Our approach to imports in the Balanced Pathway varies by type of low-carbon fuel:
- Ammonia: given the global nature of the shipping market, shipping fuels are currently predominantly supplied via international bunkering hubs. The Balanced Pathway assumes a continuation of this approach, with ammonia for use in shipping similarly supplied by the international market. This therefore means domestic hydrogen is not required for production of ammonia for use in UK shipping in our pathway.
- Biofuels: a proportion of SAF production, well below the upper limit in the existing SAF mandate (35% in 2040), is assumed to be based on HEFA biofuels, some of which we assume to be imported.[394] This helps manage the sector’s transition away from fossil fuels and increases diversity of SAF production routes (across biomass, waste, and synthetic fuels).
- Biomass: there is a limited and declining role for biomass imports as domestic supply increases to meet sector needs over time.
- Hydrogen: given its low energy density, hydrogen is relatively difficult and costly to transport. Our modelling therefore assumes hydrogen is produced domestically. However, there is potential for imports of electricity (to produce green hydrogen) or fossil gas (to produce blue hydrogen) to be used in production of hydrogen.
- Synthetic fuels: given current emissions accounting rules, we assume these are produced domestically (Box 7.7.1). In the Balanced Pathway, these fuels are used in aviation and shipping. Because these are global sectors, and given the underlying economics of synthetic fuel production, in practice it is likely that most synthetic fuels will be imported.
7.7.3 Costs and cost savings
Delivering the Balanced Pathway for fuel supply results in a net cost to the economy compared to the baseline (Figure 7.7.4). This is mostly driven by the costs associated with expanding supply of low-carbon fuels, with additional costs coming from decarbonising fossil fuel supply.[395]
| Figure 7.7.4 Costs and cost savings in the Balanced Pathway for fuel supply, compared to the baseline |
 Description: Fuel supply capital and operating expenditure are positive throughout the Balanced Pathway and increase over time, driven mainly by the costs associated with low-carbon hydrogen supply and synthetic fuel production in the final years of the pathway. Source: CCC analysis. Notes: (1) Capex is additional capital expenditure and opex is additional operating expenditure. Both are additional in-year costs in 2023 prices, relative to a baseline of no further decarbonisation action. (2) Capital expenditure for fossil fuel production is front-loaded predominantly for electrification of offshore assets. (2) Low-carbon hydrogen investment begins in the late 2020s and is steady though to 2045 before gas network infrastructure decommissioning costs begin to be incurred. (3) Bioenergy production capital expenditure (without CCS) is low and steady throughout the period. |
7.7.4 Key actions required to deliver the Balanced Pathway for fuel supply
Delivering the Balanced Pathway in the fuel supply sector will require policy to incentivise the decarbonisation of fossil fuel production, and to bring forward the supply of low-carbon fuels. The key actions that are needed are as follows:
- Ensure incentives are in place for electrification of oil and gas platforms and CCS use in refineries.
- The North Sea Transition Authority (NSTA) has announced plans for new offshore oil and gas platforms built from 2030 to be fully electrified, and for new platforms built before 2030 to be electrification ready.[396] Technical deployment scenarios developed by the NSTA estimate first power beginning between 2029 and 2032.[397] Further action to remove barriers around grid connections and consenting pathways will be needed, for both new and existing offshore platforms.
- Funding for CCS Track 1 clusters has been confirmed, but these do not include any refinery CCS projects. These should be developed for the next round of CCS clusters.[398]
- Ensure rapid development of hydrogen infrastructure (including storage and networks). This has long lead-times and therefore low-regret developments need to be fast-tracked in order to be available in the 2030s.
- Work with communities, workers, and businesses in the oil and gas industry to develop proactive transition plans that enable access to secure employment and business opportunities. These efforts should feed into local or regional plans. Plans will also be needed for the future of the gas distribution network, which may need to begin decommissioning before 2050.
- Publish a common sustainability framework for biomass, along with robust procedures for monitoring, reporting, and verification. This should prioritise domestic supply and should provide clarity on which feedstocks are provably sustainable, both in terms of their climate impact and interactions with wider environmental objectives.
7.8 Waste
Key messages
Today: the waste sector is currently the eighth highest-emitting sector in the UK economy. In 2022, waste accounted for 6% of UK emissions, 24.9 MtCO2e.[399]
CB7 period: by 2040, waste emissions fall by 67% in the Balanced Pathway, relative to 2022. Waste will account for around 8.3 MtCO2e of UK GHG emissions and will be the UK’s sixth highest-emitting sector.
By 2050: emissions will have fallen primarily through increased recycling, waste prevention, and CCS. This is one of the sectors with remaining emissions in 2050, from hard-to-abate processes in wastewater, legacy landfill emissions, and uncaptured CO2 from energy from waste (EfW).
Our key messages are:
- Recycling rates, which have stalled since 2010, will need to increase to 68% by 2035. Planned policies are unlikely to achieve this. Greater clarity is required on government plans around recycling, reuse, and resource efficiency.
- Local authorities, who manage around 40% of waste, will need funding and policy certainty to deliver improved recycling and manage additional costs from using CCS with EfW.[400];[401];[402]
- New EfW plants should only be licensed if a viable route to connecting to CCS can be established. Continuing to build EfW without access may lead to stranded assets.
- Investment in the wastewater sector is needed to roll out technologies such as advanced anaerobic digestion to both municipal and industrial wastewater treatment plants. Improvements in wastewater treatment can also help prevent sewage spills, improving water quality in UK rivers.
7.8.1 Emissions in waste
Waste is split into two categories: fossil waste from fossil-carbon sources, for example plastics; and biogenic waste from biological sources, for example food waste. Fossil waste generates CO2. By contrast, biogenic waste returns to the atmosphere the CO2 that was absorbed when the biogenic material was grown, leading to no new emissions, unless the waste decomposes into methane. This occurs when biogenic waste is sent to landfill.
Emissions from EfW are included in the waste sector as the primary use of EfW is to manage waste. However, the electricity generated from EfW plants is included as part of the electricity generation mix (see Section 7.5).
Emissions in waste were 24.9 MtCO2e in 2022. This is 66% lower than 1990 levels.[403]
- The largest share of emissions comes from landfill methane emissions. In the last ten years, EfW has become the second largest share of emissions, superseding wastewater.
- Waste sector emissions fell significantly between 2000 and 2014 as the UK’s landfill tax reduced biodegradable waste being landfilled.[404]
- Landfill methane capture rates also increased significantly in the period up to the early 2010s, due to policy support provided under the Renewables Obligation scheme.[405]
- Wastewater treatment has seen modest improvements in emissions as sewage treatment has shifted to improved anaerobic digestion systems.[406]
- In the last ten years, progress in decarbonising the waste sector has stalled. Recycling rates have plateaued and a continued decrease in methane emissions from landfill has been offset by an increase in emissions from incineration, mostly EfW.[407]
7.8.2 The Balanced Pathway for waste
In our Balanced Pathway, waste emissions are projected to fall, relative to 2022 levels, by 67% to 8.3 MtCO2e by 2040 (the middle of the Seventh Carbon Budget period) and to 5.1 MtCO2e by 2050 (Figure 7.8.1). The key values that underpin this pathway are summarised in Table 7.8.1.
| Figure 7.8.1 Waste emissions by subsector – historical (2008–2022) and Balanced Pathway (2025–2050) |
 Description: The largest share of waste emissions comes from landfill, followed by energy from waste (EfW) and wastewater. In the Balanced Pathway, emissions fall to close to zero across most subsectors. Residual emissions from wastewater, legacy landfill emissions, and uncaptured carbon from energy from waste remain in 2050. Source: DESNZ (2024) Provisional UK greenhouse gas emissions national statistics 2023; DESNZ (2024) Final UK greenhouse gas emissions national statistics 1990-2022; CCC analysis. Notes: (1) Solid colours, to the right of the line, represent our modelled pathway emissions in each subsector from 2025. Pale shades, to the left of the line, show historical subsector emissions data up to 2022 and then our modelled expectations based on existing trends and policies for past years for which data are not yet available. (2) Provisional 2023 emissions data are not used as these are not available for GHGs other than CO2, which make up the majority of emissions in this sector. |
| Table 7.8.1 Key values in the Balanced Pathway for waste |
||||||
|---|---|---|---|---|---|---|
| 2025 | 2030 | 2035 | 2040 | 2050 | ||
| Emissions | Emissions in year (MtCO2e) | 25.3 | 18.8 | 12.3 | 8.3 | 5.1 |
| Change in emissions since 1990 | -65% | -74% | -83% | -89% | -93% | |
| Change in emissions since 2022* | +2% | -24% | -50% | -67% | -79% | |
| Share of total UK emissions | 6% | 6% | 7% | 8% | ||
| Key drivers – quantity variables | UK combined recycling rate† | 47% | 57% | 68% | 67% | 67% |
| Share of EfW capacity with CCS | 0% | 22% | 47% | 80% | 100% | |
| Per-capita food waste reduction from 2021 | 17% | 39% | 42% | 45% | 51% | |
| Near elimination of waste from landfill | 2028: biodegradable waste | 2045: all waste | ||||
| Source: CCC analysis. Notes: We have blanked out the share of total UK emissions in 2050 because total UK emissions have reached Net Zero at this point. All costs are in 2023 prices. *There is a small increase in emissions before 2025, due to projected growth in energy from waste (EfW) based on recent trends. †The combined recycling rate is the recycling rate for waste from households and waste from commercial and industrial waste combined. The recycling rate in our modelling falls by 0.1% between 2035 and 2040 as waste arisings continue to increase with population growth but there are no further improvements in recycling after 2035. This is enough to reduce the rounded figure by 1%. |
||||||
Key elements of the Balanced Pathway for waste
The largest share of emissions reduction in the Balanced Pathway for waste comes from reducing waste sent to landfill and to EfW. This is achieved by resource efficiency, increased recycling rates, and a reduction in food waste. In addition, CCS is installed to capture 90–95% of emissions from EfW (Figure 7.8.2).
| Figure 7.8.2 Sources of abatement in the Balanced Pathway for waste |
 Description: The largest share of emissions reduction in waste is from waste reduction. Contributions also come from CCS at EfW plants, improved landfill methane capture, and wastewater treatment, with minor contributions from composting improvements. Source: DESNZ (2024) Provisional UK greenhouse gas emissions national statistics 2023; DESNZ (2024) Final UK greenhouse gas emissions national statistics 1990-2022; CCC analysis. Notes: (1) Historical emissions are shown only to 2022 because provisional 2023 emissions data are not published for GHGs other than CO2, which make up the majority of emissions in this sector. (2) We generally account for emissions reductions due to measures to reduce demand for high-carbon activities (including low-carbon choices and efficiencies) first, before the impact of low-carbon technologies. In 2028, abatement from waste reduction reduces in the short term due to the near elimination of biodegradable waste sent to landfill before action on resource efficiency and recycling is sufficient to counteract the shift of biodegradable waste from landfill to EfW. In 2045, the near elimination of all waste to landfill is introduced, which also increases waste to EfW, leading to further abatement from CCS. |
The key measures that combine to reduce emissions in waste are:
Waste reduction from waste prevention, recycling, and diverting waste from landfill (61% of emissions reduction in 2040). Emissions decrease as the amount of waste sent for disposal decreases. This is achieved by increased recycling rates, improving resource efficiency, reducing food waste, and a near elimination of waste sent to landfill.
- Resource efficiency improvements lead to a 5% decrease in total non-food related waste by 2040. Resource efficiency measures in the construction, vehicles, and textiles manufacturing sectors have the largest impact on waste arisings.
- Food waste reductions by 2030 are consistent with the UN Sustainable Development Goal 12.3.[408];[409];[410];[411] Our pathway sees a 39% reduction in total food waste per capita by 2030 and a 45% reduction by 2040, from 2021 levels.
- The proportion of food waste collected for anaerobic digestion increases from roughly 60% in 2024 to 90% in 2030, enabled by mandatory weekly household food waste collections in England due to be introduced from 2026.[412] The rest of the UK already collects household food waste separately. In Wales and Northern Ireland, all households have separate food waste collections, and Scotland has a statutory requirement to collect household food waste separately.[413]
- The Balanced Pathway assumes a significant improvement in combined recycling rates across household and non-household waste to 68% by 2035, up from 47% in 2021.
- This will require the UK household recycling rate to increase from the current 45% (2021) to 57% by 2035, a rate already achieved in Wales.[414]
- The recycling rate for non-household waste needs to increase from an estimated 49% in 2021 to 74% by 2035.[415];[416];[417];[418] Commercial and industrial waste has a higher potential for recycling than other non-household waste due to higher purity.
- The near elimination of biodegradable waste sent to landfill is assumed from 2028, in line with the UK Government’s proposed ambition for England.[419] The near elimination of all waste sent to landfill is assumed from 2045, in line with the date at which CCS is installed in most EfW plants.
CCS at EfW plants (25% of emissions reduction in 2040). CO2 emissions decrease through waste reduction and installation of CCS.
- Roll-out of EfW with CCS starts in 2028, with two plants in the HyNet cluster due to come online in the late 2020s.[420] EfW with CCS increases throughout the 2030s as EfW without CCS declines, until there are no EfW plants without CCS by 2045.
- CCS will likely be more economically viable for EfW plants located near industrial clusters with access to CO2 storage locations. Currently, the majority of EfW plants (we estimate around 83%) are located away from industrial clusters, while the minority (around 17%) are located near industrial clusters.
- Plants located outside industrial clusters would require pipework construction to link the plant to the nearest CCS infrastructure network, or non-pipeline transport options, pushing up the cost of decarbonisation.
- Our modelling does not include any options for carbon capture and use (CCU), where carbon emissions are permanently stored through mineral carbonation, although this could play a role.
- CCS is assumed to capture 90% of CO2 emissions until 2040 and 95% of CO2 emissions from 2041, which explains some of the residual waste emissions in 2050.
- There is an overall decrease in EfW capacity from current levels as the amount of waste disposed of in EfW plants falls due to improvements in recycling and reuse.
- Burning biodegradable waste in an EfW plant fitted with CCS delivers CO2 removals (BECCS). Our waste pathway delivers around 5 MtCO2e of removals by 2050.
- These removals balance out the residual emissions remaining in the waste sector. These residual emissions mostly come from hard-to-abate process emissions in wastewater, mechanical biological treatment, legacy methane emissions from landfill, and uncaptured CO2 from EfW with CCS.
- We account for abatement from BECCS in the engineered removals sector (see Section 7.12), rather than the waste sector.
Landfill methane capture (9% of emissions reduction in 2040). Even with decreasing use of landfill for disposal, legacy methane emissions will need to be addressed by improving methane capture rates for use in power or in the gas grid, while feasible. Landfill methane capture rates increase to 80% by 2050.
Wastewater treatment improvements (5% of emissions reduction in 2040). Nitrous oxide emissions from industrial and municipal wastewater treatment are addressed through covering and containment, technologies such as membrane aerated biofilm reactors, and enhanced emissions monitoring. Methane emissions are addressed through the deployment of advanced anaerobic digestion and upgrading biogas to biomethane for use as a natural gas substitute.
- Advanced anaerobic digestion is already in widespread use, deployed across half of wastewater treatment sites.[421] In our pathway, it is rolled out to all plants by 2030. Membrane aerated biofilm reactors are rolled out from 2030 to 10% of sites by 2045.
- Enhanced monitoring and real-time control reduce emissions by allowing identification and treatment of issues within treatment plants. Digital twins (virtual models of treatment plants based on real-time data) reduce process emissions through optimisation. These measures, along with biomethane gas to grid and covering and containment, are rolled out from 2025 to 70% of sites.
- Industrial wastewater improvements lag five years behind the earliest deployment in the municipal wastewater sector due to reduced incentives and regulatory pressure.
Composting improvements (1% of emissions reduction in 2040). Composting plays an important part in recycling food and garden waste. The use of pumped air to improve compost aeration and product quality is rolled out to appropriate sites.
- Around 30% of composting sites are suitable for aeration, which is rolled out to all these sites by 2030.
7.8.3 Costs and cost savings
Delivering the Balanced Pathway for waste results in a net cost to the economy compared to the baseline (Figure 7.8.3). This cost is dominated by CCS installations at EfW plants, with smaller contributions from recycling infrastructure and wastewater improvements.
| Figure 7.8.3 Costs and cost savings in the Balanced Pathway for waste, compared to the baseline |
 Description: The Balanced Pathway for waste results in a net cost to the economy, the majority of which comes from energy from waste (EfW) with carbon capture and storage (CCS). Source: CCC analysis. Notes: (1) Capex is additional capital expenditure and opex is additional operating expenditure. Both are additional in-year costs in 2023 prices, relative to a baseline of no further decarbonisation action. (2) There are two spikes of high additional capex in our pathway caused by landfill bans, in 2028 and in 2045, which increase the waste sent to EfW plants, particularly in 2028 when waste reduction efforts are still scaling up. (3) Capex and opex for landfill and recycling include costs from landfill, landfill methane capture, and recycling. |
7.8.4 Key actions required to deliver the Balanced Pathway for waste
Delivering the Balanced Pathway in waste will depend on a combination of effective government policy and action from households and businesses. Consistent policy will enable public and private bodies to make long-term decisions on waste infrastructure, moving away from EfW and landfill to increased recycling and reuse. Improving household and business waste separation will enable appropriate recovery and/or disposal. Delivery of CCS technology and infrastructure will then enable lower emissions if disposal is necessary. The key actions that are needed are as follows:
- Ensure policies enabling improved recycling and waste reduction are in place ahead of the near elimination of biodegradable waste sent to landfill and the inclusion of EfW in the UK ETS. This should include improving waste collections to ensure better consistency across the country.
- Prevent EfW capacity expansion unless a viable route to connecting CCS can be established. EfW plants will need access to CCS infrastructure in order to decarbonise. Building new plants in areas where this is not likely to be viable may lead to stranded assets.
- Enable improved monitoring of wastewater emissions and encourage investment in technology development and deployment to reduce emissions from wastewater.
- Provide funding and policy certainty for local authorities. Around 40% of waste is managed by local authorities. Supporting them to improve recycling through policy certainty and improved long-term funding will be key to decarbonising the waste sector.
7.9 Non-residential buildings
Key messages
Today: non-residential buildings is currently the ninth highest-emitting sector in the UK economy. In 2023, non-residential buildings accounted for 5% of UK emissions, 20.8 MtCO2e.
CB7 period: by 2040, non-residential buildings emissions fall by 87% in the Balanced Pathway, relative to 2023. Non-residential buildings will account for 2.7 MtCO2e of UK GHG emissions and will be the UK’s 10th highest-emitting sector.
By 2050: this sector can almost completely decarbonise through rapid electrification.
Our key messages are:
- Heat pumps are suitable for the vast majority of non-residential buildings. They can be deployed individually within buildings or at a larger scale to supply a heat network where heat is distributed to a number of buildings. The exact mix is uncertain.
- The public sector decarbonises heating earlier than the commercial sector, with government leading by example and providing confidence to help develop heat pump supply chains and anchor loads for heat networks. Long-term commitments and funding are necessary to back the public sector’s decarbonisation aims.
- The high price of electricity compared to gas is a barrier to heat pump uptake. The Government should address the balance of policy costs, shifting these away from electricity prices. It should also consider if further policy is needed to drive the transition in the commercial sector.
- Energy efficiency measures are cost effective now and many are cost saving, so should be deployed rapidly.
7.9.1 Emissions in non-residential buildings
Emissions in non-residential buildings were 20.8 MtCO2e in 2023. This is 27% lower than 1990 levels. Non-residential buildings currently account for 5% of UK emissions.
- Reductions in emissions have been driven by the public sector, where emissions have fallen by 47% since 1990. The majority of these reductions took place between 1990 and 2014, with emissions having been relatively flat over the past decade.
- Reductions between 1990 and 2014 were driven largely by improvements in energy intensity.[422]
- The Government aims to build on this by reducing emissions from public sector buildings by 75% by 2037, compared to a 2017 baseline. So far, emissions have fallen by around 9% since 2017, which is partly due to warmer-than-average temperatures and a possible contribution from high gas prices in recent years.
- Emissions in the commercial sector remain at a similar level to 1990. Improvements in the energy intensity of commercial buildings have been offset by growth in the commercial sector.[423];[424];[425]
7.9.2 The Balanced Pathway for non-residential buildings
In our Balanced Pathway, non-residential building emissions are projected to fall, relative to 2023 levels, by 87% to 2.7 MtCO2e by 2040 (the middle of the Seventh Carbon Budget period) and to 0.7 MtCO2e by 2050 (Figure 7.9.1).[426] The key values that underpin this pathway are summarised in Table 7.9.1.
| Figure 7.9.1 Non-residential buildings emissions by subsector – historical (2008–2023) and Balanced Pathway (2025–2050) |
 Description: More than half of non-residential buildings emissions are currently from commercial buildings, with the remainder from public buildings. Emissions fall rapidly in the Balanced Pathway, and reach close to zero by 2050. Source: DESNZ (2024) Provisional UK greenhouse gas emissions national statistics 2023; DESNZ (2024) Final UK greenhouse gas emissions national statistics 1990-2022; CCC analysis. Notes: (1) Solid colours, to the right of the line, represent our modelled pathway emissions in each subsector from 2025. Pale shades, to the left of the line, show historical subsector emissions data up to 2023 and then our modelled expectations based on existing trends and policies for past years for which data are not yet available. (2) The grey line shows temperature-adjusted historical emissions. |
| Table 7.9.1 Key values in the Balanced Pathway for non-residential buildings |
||||||
|---|---|---|---|---|---|---|
| 2025 | 2030 | 2035 | 2040 | 2050 | ||
| Emissions | Emissions in year (MtCO2e) | 21.5 | 14.9 | 6.3 | 2.7 | 0.7 |
| Change in emissions since 1990 | -24% | -48% | -78% | -90% | -98% | |
| Change in emissions since 2023* | +3% | -29% | -70% | -87% | -97% | |
| Share of total UK emissions | 5% | 5% | 3% | 3% | ||
| Key drivers – quantity variables | Share of commercial heat that is delivered by low-carbon technology† | 35% | 42% | 69% | 83% | 100% |
| Share of public sector heat that is delivered by low-carbon technology† | 3% | 22% | 70% | 95% | 100% | |
| Energy savings due to additional energy efficiency (TWh) | 2.1 | 34.5 | 50.7 | 52.6 | 56.5 | |
| Key drivers – price variables | Additional cost of an air-to-water heat pump over a gas boiler (levelised cost £/MWh)‡ | 63.2 | 59.1 | 54.7 | 52.0 | 47.6 |
| Additional cost of an air-to-water heat pump over an oil boiler (levelised cost £/MWh)‡ | 48.9 | 41.7 | 37.4 | 34.7 | 30.4 | |
| Source: CCC analysis. Notes: We have blanked out the share of total UK emissions in 2050 because total UK emissions have reached Net Zero at this point. All costs are in 2023 prices. *Emissions in 2023 were lower than expected due to a warmer-than-average year and high energy prices. †The share of heat delivered by low-carbon technology includes heat pumps, low-carbon heat networks, electric resistive heating, and biomass boilers. ‡The additional cost of an air-to-water heat pump compared to technologies it replaces is presented as a levelised cost per unit of heat delivered. This is over the lifetime of the technology and includes the upfront installation cost and ongoing fuel costs and maintenance costs. |
||||||
Key elements of the Balanced Pathway for non-residential buildings
The largest source of emissions reduction is the electrification of heating. There are also significant emissions reductions associated with deploying energy efficiency measures (Figure 7.9.2).
| Figure 7.9.2 Sources of abatement in the Balanced Pathway for non-residential buildings |
 Description: The largest share of emissions reduction in non-residential buildings is from the switch to low-carbon electric heating, followed by energy efficiency improvements. Contributions also come from the electrification of catering and other fossil fuel equipment and reduced emissions from anaesthetics. Source: DESNZ (2024) Provisional UK greenhouse gas emissions national statistics 2023; DESNZ (2024) Final UK greenhouse gas emissions national statistics 1990-2022; CCC analysis. Notes: (1) The chart includes historical data both for actual emissions and temperature-adjusted emissions, which account for the impact of year-to-year fluctuations in temperature on heating demand. (2) Our analysis for this sector was based on commercial and public building energy demands in 2022, which is why there is a small gap between the starting point for our analysis and the latest actual emissions data. (3) We generally account for emissions reductions due to measures to reduce demand for high-carbon activities (including low-carbon choices and efficiencies) first, before the impact of low-carbon technologies. (4) Low-carbon heating is mostly electric, but also includes a small amount of low-carbon heat coming from waste heat used in heat networks in addition to electricity. |
The key measures that combine to reduce emissions in non-residential buildings are:
Low-carbon heating (49% of emissions reduction in 2040). Current heating systems are replaced by low-carbon alternatives, where this is not already the case. Most heating is delivered by efficient heat pumps, whether this be through a district heat network or individual systems. By 2040, 88% of non-residential heating is delivered by low-carbon sources, compared to 24% today.
- The exact mix between heat networks and individual low-carbon heating systems will depend on a range of factors and decisions around planning. We present an illustrative mix. In both cases, heat pumps are the main source of heat.
- Heat networks involve generating heat in a centralised location and then distributing it to nearby buildings. They are suited to areas with high heat densities. Non-residential buildings with high heat demands can play an important role in providing anchor loads for networks that also serve residential buildings. Heat networks deliver 22% of heat demand in non-residential buildings by 2040 in the Balanced Pathway.
- Among the share of non-residential buildings not assigned to heat networks in our Balanced Pathway, we consider the suitability of different technologies – based on existing heating, ventilation, and air conditioning (HVAC) systems in the stock – and choose the most cost-effective option where multiple choices are available.
- Gas and oil boilers are generally replaced by air-to-water heat pumps which, are the main alternative where there is a wet distribution system.[427] Around 80% of non-residential heat demand that is not currently provided by a low-carbon heat technology is in a building with a wet distribution system. Air-to-air heat pumps could be an alternative option, with the additional benefit of also being able to provide cooling. These may be taken up if their lower unit costs compared to air-to-water heat pumps were sufficient to compensate for the additional cost, disruption, and risk in changing distribution systems.
- Existing electric resistive heating with a dry distribution system is replaced by efficient air-to-air heat pumps which can provide heating and cooling, can be cost saving, and are already widespread in some commercial segments.
- Localised gas heating systems convert to cost saving air-to-air heat pumps (in place of local gas warm air heating) and to electric resistive heating (in place of gas radiant heating).
- Biomass boilers are replaced by air-to-water heat pumps, freeing up biofuels for use where there are fewer alternatives (see Section 10.2).
- Heat pump installations pick up pace from the late 2020s as supply chains develop. In the public sector, the growth is rapid, plateauing by around 2038. The growth is more gradual in the commercial sector, with new installations continuing through to the mid-2040s.
- The Balanced Pathway includes some limited early scrappage, meaning that some gas and oil boilers are replaced before the end of their expected lifetime. In the public sector, gas boilers are replaced four years before the end of their expected lifetime, from 2028, while in commercial buildings we assume replacements happen two years early, from 2032. This earlier scrappage in the public sector reflects the aim for it to lead in decarbonising and scaling up supply chains for low-carbon heating.
Energy efficiency (35% of emissions reduction in 2040). Deployment of a wide range of measures across various uses (including heating, ventilation, and catering) saves energy use in public and commercial buildings.
- The Balanced Pathway assumes that all cost-effective energy efficiency measures are taken up by 2032, since these are established technologies and complement the installation of low-carbon heating. Energy efficiency measures continue to provide energy savings of 31% in public buildings and 22% in commercial buildings out to 2050.
- Energy management and building instrumentation and control measures (for example, building management systems, zone and timing controls, and management practices) account for 60% of energy efficiency emissions reductions in the Balanced Pathway.
- Building fabric measures, such as insulation, contribute around 26% of energy efficiency emissions reductions. The remaining 14% of energy efficiency emissions reductions come mainly from heating and hot water measures.
- In addition to reducing fossil fuel use and delivering emissions savings, energy efficiency measures lead to a reduction in electricity demand. This is from the measures described above (where there is currently electric heating), plus a range of electrical efficiency measures such as in ventilation and lighting.
Electrification of catering (9% of emissions reduction in 2040). Electrification of catering comes from replacing gas and oil catering equipment with electric equivalents. For all types of catering equipment, replacements are electric by 2030 at the latest. By 2040, the vast majority of catering equipment in use is electric.
Electrification of other uses of fuels (5% of emissions reduction in 2040). Remaining fossil fuel uses in hospitals and leisure facilities are fully electrified by 2045.
Anaesthetics (1% of emission reduction in 2040). The Balanced Pathway includes a 40% reduction in nitrous oxide emissions from anaesthetics used in healthcare by 2032 compared to levels in 2019/20, through the use of waste reduction measures. This is in line with what the NHS expects to be achievable while maintaining patient care.
7.9.3 Costs and cost savings
Delivering the Balanced Pathway for non-residential buildings results in a net cost to the economy compared to the baseline (Figure 7.9.3). Investment in energy efficiency and low-carbon heating lead to capital costs which decrease over time. Energy efficiency improvements provide sustained operating cost savings, as do some of the electrification measures.
| Figure 7.9.3 Costs and cost savings in the Balanced Pathway for non-residential buildings, compared to the baseline |
 Description: Capital costs are high up to 2032 with the installation of energy efficiency measures and the early part of heat electrification. Capital costs are more stable after this point, and sustained operating cost savings from energy efficiency lead to a roughly cost-neutral pathway in later years. Source: CCC analysis. Notes: (1) Capex is additional capital expenditure and opex is additional operating expenditure. Both are additional in-year costs in 2023 prices, relative to a baseline of no further decarbonisation action. (2) Capital expenditure is incurred when a technology is first installed, but also when that technology needs replacing at the end of its lifetime (which accounts for the increase in capex again in the late 2040s). |
7.9.4 Key actions required to deliver the Balanced Pathway for non-residential buildings
Delivering the Balanced Pathway in non-residential buildings will depend on a combination of effective government policy and continuing progress in developing key markets. Government has an important role to play in leading the way with public sector decarbonisation, putting in place necessary planning frameworks for heat networks and creating a market conducive to the rapid uptake of heat pumps. The key actions that are needed are as follows:
- Introduce a comprehensive multi-year programme for decarbonisation of public sector buildings. This should set out strategic plans for when best to take the required decarbonisation actions in buildings across the public estate and should be supported by long-term capital settlements. This will help to develop supply chains and labour pools which will also help commercial and residential buildings decarbonise.
- Make electricity cheaper by removing levies and other policy costs from electricity bills to help incentivise consumers to switch to lower-carbon electric options.
- Develop and implement an engagement strategy to provide clear information to businesses about how the UK can meet its emissions targets and the role they can play. It should provide trusted information, signposting to available sources of advice and support. Smaller commercial operations may need access to low-cost finance to help them to transition.
- Ensure mechanisms are in place to provide clarity on where heat networks are to be developed, so as not to delay the deployment of heat pumps within buildings.
- Ensure rented buildings are energy efficient. Regulations could require landlords to improve the efficiency of rented properties where that is cost effective.
- Ensure that new non-residential buildings are highly energy efficient and zero-carbon by amending Building Regulations and preventing new connections to the gas grid.
- Phase out fossil fuel catering equipment and other fossil fuel equipment. Electric alternatives for catering equipment are readily available. Fossil fuel catering equipment could be phased out by regulations on their sale.
7.10 Shipping
Key messages
Today: shipping is currently the 10th highest-emitting sector in the UK economy. In 2023, shipping accounted for 3% of UK emissions, 11.2 MtCO2e, according to GHG inventory estimates. Using the Department for Transport’s (DfT’s) emissions model, current emissions are estimated to be higher, at 14.1 MtCO2e in the latest year based on historical port freight traffic data (2022).[428];[429]
CB7 period: by 2040, shipping emissions fall by 62% in the Balanced Pathway, relative to 2022. Shipping will account for 5.4 MtCO2e of UK GHG emissions and will be the UK’s eighth highest-emitting sector.
By 2050: the shipping sector can almost completely decarbonise through improved ship efficiencies and a switch to low-carbon fuels and electricity.
Our key messages are:
- The UK should continue to push for ambition at the International Maritime Organisation (IMO).[430] Additional to this, the UK should pursue opportunities to go further, such as forming progressive alliances with parties outside of the IMO process to establish robust international actions and mechanisms to tackle international shipping emissions.[431]
- A range of fuel types and efficiency improvements will be needed to decarbonise shipping, reflecting the diverse nature of the sector. The Government must ensure the right incentives are in place for shipping companies and individuals to improve efficiencies and adopt low-carbon fuels or electricity.
- Fuel switching will drive shipping decarbonisation to 2050, but the balance of different fuels is uncertain. Low-carbon ammonia and synthetic methanol are the dominant fuels used in our pathway.
- Low-carbon ammonia and synthetic fuels are not yet produced at scale. The Government and the IMO will need to support development of low-carbon fuel production and markets.
7.10.1 Emissions in shipping
Emissions in shipping were 11.2 MtCO2e in 2023, according to the GHG inventory. Using DfT’s emissions model (which we have used as the starting point for our pathway), current emissions are estimated to be higher, at 14.1 MtCO2e in the latest year based on historical port freight traffic data (2022). This is 33% lower than 1990 levels, using the inventory estimates. Figures in the rest of this chapter are based on DfT’s emissions model (and inventory estimates for naval and inland waterways and leisure) unless otherwise specified. The shipping sector currently accounts for 3% of UK emissions. International shipping contributed around 51% of shipping emissions in 2022, domestic shipping around 46%, and naval shipping around 3%.
- Many ships that contribute to domestic shipping emissions also go on international voyages, and just 21% of domestic shipping emissions (excluding inland waterways and leisure shipping) came from ships that only operate domestically in 2022.[432]
- Inland waterways and leisure shipping is a subset of domestic shipping, contributing around 7% of shipping emissions in 2022. Limited data exist on the fleet, but it includes a variety of vessel types, such as personal watercraft, canal boats, and barges.
- Emissions reductions have been due in part to decreased activity.[433] Shipped tonnage at major and minor ports in 2022 was 7% below 1990 levels, and 20% below 2000 levels.[434] The largest reductions were in domestic shipping and from a 57% fall in shipped tonnage of crude oil at major ports, compared to 2000.[435] UK international sea passenger movements decreased by 53% between 1990 and 2022, and domestic passenger movements reduced by 10% between 2003 and 2022.[436] It is likely that efficiency improvements from larger ship sizes and technical and operational measures also contributed, but available data are limited.
- Ship types and sizes vary substantially, from small private leisure craft to large cargo ships. Around 50% of domestic shipping emissions and 92% of international shipping emissions in 2022 came from vessels over 5,000 gross tonnes. Around 35% of domestic shipping emissions and 77% of international shipping emissions in 2022 came from cargo ships. Around 22% of domestic shipping emissions and 19% of international shipping emissions in 2022 came from cruises and ferries.[437]
- Emissions fell by 16% between 2019 and 2020 due to the COVID-19 pandemic, according to the GHG inventory.[438] This was largely driven by a decline in internationally shipped tonnage and the number of sea passengers.[439];[440] Shipping emissions, shipped tonnage, and passenger numbers had all started to rebound by 2022, but it remains to be seen whether and when shipping emissions might increase beyond pre-pandemic levels.
7.10.2 The Balanced Pathway for shipping
In the Balanced Pathway, shipping emissions are projected to fall, relative to 2022 levels, by 62% to 5.4 MtCO2e by 2040 (the middle of the Seventh Carbon Budget period) and to 0.5 MtCO2e by 2050 (Figure 7.10.1). The key values that underpin this pathway are summarised in Table 7.10.1.
| Figure 7.10.1 Shipping emissions by subsector – historical (2008–2023) and Balanced Pathway (2025–2050) |
 Description: Around half of shipping emissions come from each of international and domestic shipping. In the Balanced Pathway, emissions across both subsectors fall quickly from 2025 to reach close to zero by 2050. Naval shipping emissions start declining from 2035. Source: DESNZ (2024) Provisional UK greenhouse gas emissions national statistics 2023; DESNZ (2024) Final UK greenhouse gas emissions national statistics: 1990 to 2022; DfT and CCC analysis. Notes: (1) Solid colours, to the right of the vertical line, represent our modelled pathway emissions in each subsector from 2025. Pale shades, to the left of the line, show historical subsector emissions data from the GHG inventory up to 2018 and then estimates from DfT’s emissions model from 2019 to 2024 (which we use as the basis for our modelled pathway, other than for naval shipping and inland waterways and leisure shipping, which are based on the inventory). (2) For comparison, the grey line shows total emissions as reported by the inventory from 2008 to 2023. |
| Table 7.10.1 Key values in the Balanced Pathway for shipping |
||||||
|---|---|---|---|---|---|---|
| 2025 | 2030 | 2035 | 2040 | 2050 | ||
| Emissions | Emissions in year (MtCO2e) | 14.2 | 9.8 | 7.7 | 5.4 | 0.5 |
| Change in emissions since 2022 (using DfT’s model, as in the pathway, for 2022)* | +0% | -31% | -46% | -62% | -96% | |
| Change in emissions since 2023 (using the GHG inventory for 2023)* | +27% | -12% | -31% | -52% | -95% | |
| Share of total UK emissions | 3% | 3% | 4% | 5% | ||
| Key drivers – quantity variables | Proportion of energy use that is low carbon | 0% | 5% | 21% | 49% | 97% |
| Proportion of ships (by gross tonnage) with engines and propulsion systems capable of running on low-carbon fuels | 1% | 93% | 96% | 99% | 100% | |
| Proportion of ships (by gross tonnage) that have adopted at least one efficiency measure | 19% | 99% | 99% | 99% | 98% | |
| Emissions intensity of shipping (gCO2e per gross tonne nautical mile) | 12.8 | 8.5 | 6.3 | 3.9 | 0.2 | |
| Freight tonnage shipped (Mt) | 456 | 463 | 473 | 492 | 538 | |
| Source: DfT and CCC analysis. Notes: We have blanked out the share of total UK emissions in 2050 because total UK emissions have reached Net Zero at this point. All costs are in 2023 prices. *The table shows changes from current emissions on two bases – first compared to 2022 emissions as estimated using DfT’s emissions model, which we use as the basis for our modelled pathway (other than for naval shipping and inland waterways and leisure shipping), and second compared to 2023 emissions as reported in the GHG inventory. We do not show changes compared to 1990 levels for this sector because an estimate of 1990 emissions using DfT’s emissions model is not available, so the resulting comparisons would not be possible on a like-for-like basis. |
||||||
Key elements of the Balanced Pathway for shipping
The UK’s shipping sector can decarbonise almost entirely by 2050. In the pathway, uptake of technologies and operational measures that improve the energy efficiency of vessels are the primary source of decarbonisation for shipping until 2040. By 2050 fuel switching to low-carbon fuels and electricity for propulsion and onboard vessel energy use are the biggest sources of decarbonisation (Figure 7.10.2). The Balanced Pathway and the baseline for shipping are based on the same shipping activity forecast from the Department for Transport, where shipped freight tonnage increases by 11% by 2040 from 2022.
Given the diversity of vessels, a range of fuels and efficiency-improving technologies and operational measures will need to be used. The mix of fuel types and efficiency measures in the Balanced Pathway is chosen based on estimates of future costs and compatibility with vessel types. The exact balance of these fuel types and efficiency measures is uncertain, but a broad range of options must be pursued to ensure shipping emissions reach close to zero by 2050.
| Figure 7.10.2 Sources of abatement in the Balanced Pathway for shipping |
 Description: The largest share of emissions reduction in shipping until 2040 is from efficiency improvements, before low-carbon fuels become the largest driver of abatement in later years. Source: DESNZ (2024) Provisional UK greenhouse gas emissions national statistics 2023; DESNZ (2024) Final UK greenhouse gas emissions national statistics: 1990 to 2022; DfT and CCC analysis. Notes: (1) The light grey line shows historical emissions data based on GHG inventory estimates. The dark grey line shows historical emission estimates based on the DfT’s emissions model. We have used the latter as the basis for our pathway modelling (other than for naval shipping and inland waterways and leisure shipping, which are based on the inventory), which is why our pathway begins at a higher level of emissions than the shipping value in the published inventory. (2) We generally account for emissions reductions due to measures to reduce demand for high-carbon activities (including low-carbon choices and efficiencies) first, before the impact of low-carbon technologies. |
The key measures that combine to reduce emissions in shipping are:
Fuel switching (52% of emissions reduction in 2040). Existing and new ships take up engines and other propulsion systems capable of running on low-carbon fuels and electricity. The rate at which ships switch to these fuels is determined by the pace at which the technologies and fuels become available and cost effective, as well as the impact of assumed fuel standard regulations. Low-carbon fuels and electricity make up 54% of total energy use in 2040 and 98% in 2050.
The Balanced Pathway includes a variety of fuels, all of which are likely to play a role in decarbonising shipping. The fuels used most in our pathway are low-carbon ammonia and synthetic fuels (produced through combining low-carbon hydrogen with CO2 from direct air capture). The balance of these fuels is uncertain: it will depend on suitability across vessel types and the relative costs.
- Ammonia (22% of shipping energy use in 2040). Low-carbon ammonia is not yet used in ships and enters the shipping energy mix in our pathway from 2028. Ammonia is globally traded today, but it is toxic and requires specific handling skills and storage systems, and is therefore only used on cargo ships in our pathway.[441];[442]
- Synthetic fuels (17% of shipping energy use in 2040).[443];[444] Synthetic fuels enter the energy mix in the mid-2030s when domestic direct air capture becomes available. Due to their relative costs, synthetic methanol plays the largest role in the Balanced Pathway, with limited uptake of synthetic methane and synthetic marine diesel oil. Synthetic fuels can be used on cargo ships but are mainly used for ship types that carry passengers in our pathway.
- Fossil methanol (18% of shipping energy use in 2040). Fossil methanol is used as a transition fuel in the Balanced Pathway, with uptake increasing from 2025 and then beginning to decrease in the early 2030s. Several shipping companies are ordering ships with methanol engines today.[445] These engines can switch to run on synthetic methanol when that becomes available.
- Electricity (6% of shipping energy use in 2040). Electricity contributes to decarbonisation of inland waterways and leisure shipping, domestic ferries, and some service and offshore vessels.
- By 2050 in the Balanced Pathway, half of the inland waterways and leisure vessel fleet decarbonises by switching to electric drive – technology which is already being deployed today.[446] The other half of this fleet switches to biofuels.
- Shore power refers to the process of supplying ships with electricity to power essential vessel functions when the ship is at berth, instead of using auxiliary engines powered by fossil fuels. Due to the complexity of modelling shore power, the Balanced Pathway does not include this. However, shore power has potential to significantly reduce air pollution from vessels at berth and might enable faster emissions reduction in shipping.[447]
- Biofuels (3% of shipping energy use in 2040). Biofuels play a small role in decarbonising shipping in the Balanced Pathway. They are used to reduce emissions from some existing inland waterways and leisure vessels with long lifetimes, where they can act as ‘drop-in fuels’ in existing engines, with no or limited modification.[448] They do not feature in other segments of the shipping sector.
Efficiency improvements (48% of emissions reduction in 2040). This measure consists of a variety of technological and operational measures that improve the energy efficiency of a ship, such as wind assistance, propeller ducts, rudder bulbs, and speed optimisation.
- While some efficiency measures are cost effective and being adopted globally today, no efficiency measures are assumed to have been adopted by 2024 in the Balanced Pathway due to insufficient data on uptake in the UK.[449] Uptake scales up quickly from 2025 onwards, with 99% of ships by gross tonnage (excluding naval and inland waterways and leisure shipping) having adopted at least one efficiency measure by 2030.
- Naval shipping is assumed not to take up any efficiency measures in the pathway, due to restricted information about the naval fleet and its operational patterns.
- Inland waterways and leisure shipping are assumed not to take up any efficiency measures, due to limited evidence about the existing fleet.
7.10.3 Costs and cost savings
Delivering the Balanced Pathway for shipping results in a net cost to the economy compared to the baseline (Figure 7.10.3). The additional costs are mainly driven by the higher cost of low-carbon fuels.
| Figure 7.10.3 Costs and cost savings in the Balanced Pathway for shipping, compared to the baseline |
 Description: Net costs in the Balanced Pathway for the shipping sector are positive relative to the baseline from 2025 and generally growing over the period to 2050. Costs are driven by opex: savings from improved efficiency are offset by higher costs of low-carbon fuels. Source: CCC analysis. Notes: Capex is additional capital expenditure and opex is additional operating expenditure. Both are additional in-year costs in 2023 prices, relative to a baseline of no further decarbonisation action. |
7.10.4 Key actions required to deliver the Balanced Pathway for shipping
Delivering the Balanced Pathway in shipping will depend on a combination of effective government policy, international regulatory action, and continued progress in building key markets. Government policy is needed to support the establishment of low-carbon shipping fuel markets and to drive uptake of efficiency measures and low-carbon fuels. The key actions that are needed are as follows:
- Seek to strengthen and implement the IMO objectives. In parallel, collaborate with other parties to establish multilateral partnerships to address international shipping emissions.
- Include domestic and international shipping emissions in the UK ETS in line with the EU ETS and ensure there are incentives and infrastructure for decarbonisation of all vessel types – from private leisure vessels to large-scale freight ships.[450]
- Reduce emissions at berth. The Government should develop policies to reduce emissions at berth, for example by supporting the development of shore power at UK ports.
7.11 F-gases
Key messages
Today: fluorinated gases (F-gases) is currently the 11th highest-emitting sector in the UK economy. In 2022, F-gases accounted for less than 2% of UK emissions, 7.6 MtCO2e.[451]
CB7 period: by 2040, F-gases emissions fall by 73% in the Balanced Pathway, relative to 2022. F-gases will account for 2% of UK GHG emissions and will be the UK’s 11th highest-emitting sector.
By 2050: emissions from the F-gases sector will be mostly eliminated as a result of changing the gases used in a range of everyday equipment (such as refrigeration) to lower-emission alternatives. A small amount of residual emissions remains, mostly from industrial processes and other uses.
Our key messages are:
- The UK will need to regulate to replace F-gases with less harmful alternatives. The Balanced Pathway mainly reduces emissions in refrigeration, air conditioning, heat pumps, and inhalers. The gases used in this equipment will be different, but the way we use it will not significantly change. The 2024 EU regulations is an example of the regulatory standards that the UK will need to achieve.[452]
7.11.1 Emissions in F-gases
F-gases emissions were 7.6 MtCO2e in 2022. This is 49% lower than 1990 levels.[453] F-gases are released in very small volumes relative to other GHGs but have a global warming potential (GWP) up to 23,500 times greater than CO2. F-gases are used as refrigerants, aerosols, solvents, insulating gases, or blowing agents for foams, and they can also be emitted as fugitive emissions from other manufacturing processes.[454]
- The largest source of emissions in 2022 was from leakage in refrigeration and air conditioning systems (74%). F-gases emissions also come from metered-dose inhalers (12%), often used for patients with asthma. Other applications include compounds used in electric power systems, military warning systems, fire protection systems, halocarbon production in everyday materials (from solvents to medicines to plastics), and aerosol foams.
- Since 1990, emissions rose to a peak in 1997 and have since fallen to lower levels.
- In 1990, F-gases emissions were dominated by industrial processes which saw significant emissions decreases in the late 1990s due to improved equipment in power plants.
- A subsequent increase in use in air conditioning and refrigeration appliances saw emissions in that subsector increase until the mid-2010s.[455] The F-gas Regulation (2015) then reduced emissions by phasing down the amount of hydrofluorocarbons (HFCs) that can be placed on the market.[456]
7.11.2 The Balanced Pathway for F-gases
In our Balanced Pathway, F-gases emissions are projected to fall, relative to 2022 levels, by 73% to 2.0 MtCO2e by 2040 (the middle of the Seventh Carbon Budget period) and to 1.6 MtCO2e by 2050 (Figure 7.11.1). The key values that underpin this pathway are summarised in Table 7.11.1.
| Figure 7.11.1 F-gases emissions by subsector – historical (2008–2022) and Balanced Pathway (2025–2050) |
 Description: The largest sources of F-gases emissions are from refrigeration and from air conditioning and heat pumps. In the Balanced Pathway, emissions from inhalers, refrigeration, and air conditioning and heat pumps fall to near zero by 2050, with a small amount of residual emissions from other F-gases. Source: DESNZ (2024) Provisional UK greenhouse gas emissions national statistics 2023; DESNZ (2024) Final UK greenhouse gas emissions national statistics 1990-2022; CCC analysis. Notes: (1) Solid colours, to the right of the line, represent our modelled pathway emissions in each subsector from 2025. Pale shades, to the left of the line, show historical subsector emissions data up to 2022 and then our modelled expectations based on existing trends and policies for past years for which data are not yet available. (2) Subsector categories in the pathway for refrigeration and air conditioning and heat pump differ from historical data due to modelling limitations. This is why the historical and pathway subsector breakdowns do not exactly line up. |
| Table 7.11.1 Key values in the Balanced Pathway for F-gases |
||||||
|---|---|---|---|---|---|---|
| 2025 | 2030 | 2035 | 2040 | 2050 | ||
| Emissions | Emissions in year (MtCO2e) | 6.0 | 3.8 | 2.7 | 2.0 | 1.6 |
| Change in emissions since 1990 | -59% | -74% | -81% | -86% | -89% | |
| Change in emissions since 2022 | -21% | -50% | -64% | -73% | -79% | |
| Share of total UK emissions | 1% | 1% | 1% | 2% | ||
| Source: CCC analysis. Notes: We have blanked out the share of total UK emissions in 2050 because total UK emissions have reached Net Zero at this point. All costs are in 2023 prices. |
||||||
Key elements of the Balanced Pathway for F-gases
Emissions reductions in the F-gases sector come from changes to refrigerants used in air conditioning, heat pumps, and refrigeration as well as the use of alternative propellants in metered-dose inhalers (Figure 7.11.2).
| Figure 7.11.2 Sources of abatement in the Balanced Pathway for F-gases |
 Description: The largest share of emissions reductions in in F-gases by 2040 comes from the use of lower GWP refrigerants and propellants in refrigeration, air conditioning and heat pumps, and inhalers. Source: DESNZ (2024) Provisional UK greenhouse gas emissions national statistics 2023; DESNZ (2024) Final UK greenhouse gas emissions national statistics 1990-2022; CCC analysis. Notes: (1) Historical emissions are shown only to 2022 because provisional 2023 emissions data are not published for GHGs other than CO2. (2) We generally account for emissions reductions due to measures to reduce demand for high-carbon activities (including low-carbon choices and efficiencies) first, before the impact of low-carbon technologies. |
The key measures that combine to reduce F-gases emissions are:
Refrigeration (37% of emissions reduction in 2040). This involves using lower global warming potential (GWP) refrigerants in refrigeration systems that are due to be replaced. This means that any leakage from refrigeration systems will have a lower impact in CO2e terms.
- Some examples of these applications are in commercial and industrial refrigeration, such as centralised and distributed systems for supermarkets, coolers, and freezers.
- Some emissions reductions also come from better end-of-life recovery.
Air conditioning and heat pumps (36% of emissions reduction in 2040). This involves better end-of-life recovery of F-gases in air conditioning and heat pumps as well as the use of lower GWP refrigerants.
- The F-gases baseline assumes take-up of heat pumps in line with the Balanced Pathway for buildings, to avoid undercounting appliances containing F-gases. The F-gases Balanced Pathway then accounts for actions needed to mitigate F-gases emissions from those appliances.
Inhalers (27% of emissions reduction in 2040). This involves replacing the use of high-GWP propellants in inhalers with lower-GWP propellants.
- This can involve using dry powder inhalers (for patients who can switch to these devices) or using metered-dose inhalers with alternative propellants (for patients who cannot switch to dry powder inhalers).
- While the propellants or mechanisms used will change in our pathway, the way in which these are used and their medical effectiveness will generally not be affected.
- A range of alternative propellants are already available and have been on the EU market for many years. In addition, there is currently intense research activity around inhalers, and two metered-dose inhaler manufacturers have announced that they will bring lower-GWP products for asthma and Chronic Obstructive Pulmonary Disease treatment to the EU market starting from 2024/25.[457]
- There is a risk that abatement in healthcare and anaesthetics could increase emissions through increased lifecycle emissions of replacement products.
The majority of the unabated emissions in 2050 come from other sources of F-gases. This includes emissions from electric power systems, military warning systems, fire protection systems, halocarbon production in everyday materials (from solvents to medicines to plastics), and aerosol foams. Further abatement for this is either impractical or not currently cost effective.
7.11.3 Costs and cost savings
Delivering the Balanced Pathway for F-gases results in a cost saving to the economy compared to the baseline. There are small cost increases in the short term, but savings grow steadily due to cost reductions as air conditioning and heat pump technologies become cheaper.
| Figure 7.11.3 Costs and cost savings in the Balanced Pathway for F-gases, compared to the baseline |
 Description: In the Balanced Pathway, net costs fall by 2050, particularly the additional capital costs of reducing F-gases emissions from air conditioning and heat pumps. Source: CCC analysis. Notes: (1) Capex is additional capital expenditure and opex is additional operating expenditure. Both are additional in-year costs in 2023 prices, relative to a baseline of no further decarbonisation action. (2) The shape of the costs before and after 2036 reflects stylised assumptions across these periods based on the most recent EU impact assessment from March 2022. (3) The baseline includes heat pump deployment throughout the period from 2025 to 2050. This describes the emissions from F-gases assuming no further policy beyond 2023 occurs. (4) Activity beyond 2023 is included in emissions and costs in the pathway. |
7.11.4 Key actions required to deliver the Balanced Pathway for F-gases
Delivering the Balanced Pathway in F-gases will depend on a clear regulatory framework that stimulates the necessary innovation and deployment for decarbonisation. The key actions that are needed are as follows:
- Regulate to replace F-gases with lower-emission alternatives. Regulation would provide the necessary incentives for research and development into lower-GWP alternative products. It would provide UK supply chains with the certainty they need to train and grow their workforces. The Government should consider the case for regulatory alignment with the EU, which would reduce costs since many of the products and equipment involved are imported from the EU. It will be important to ensure that any new regulation allows enough time for the sector to prepare for any changes.
7.12 Engineered removals
Key messages
Today: engineered removals are measures which remove CO2 from the atmosphere to permanent storage. Aside from small-scale testing, there have been no engineered removals recorded to date in the UK.
CB7 period: by 2040, engineered removals will account for -21.3 MtCO2e of UK GHG emissions.
By 2050: engineered removals will play a crucial role in offsetting residual emissions that cannot credibly be cut, predominantly from aviation.
Our key messages are:
- Engineered removals start to contribute to the Balanced Pathway around 2028 and grow to reach -35.8 MtCO2e in 2050. This is predominantly bioenergy with carbon capture and storage (BECCS), with some direct air carbon capture and storage (DACCS), enhanced weathering, and biochar.
- Engineered removals are a necessity to deliver Net Zero as some sectors, including aviation, cannot reach zero emissions by themselves. They are also required to meet interim targets, and by the Seventh Carbon Budget period contribute around 6% of total emissions abatement in the Balanced Pathway.
- The Balanced Pathway reduces emissions across all sectors of the economy as far as is credibly possible in line with cost effectiveness and feasibility constraints. This minimises the use of engineered removals, given the uncertainties and relatively high expected costs associated with them.
- Engineered removals are not yet deployed at scale. They will take time to scale up and work to do this must accelerate now.
7.12.1 Emissions in engineered removals
Globally, some engineered removals are taking place and there is a growing pipeline of projects under development, using a variety of approaches.[458]
7.12.2 The Balanced Pathway for engineered removals
In our Balanced Pathway, engineered removals are projected to start contributing around 2028. They grow to reach -21.3 MtCO2e by 2040 (the middle of the Seventh Carbon Budget period) and ‑35.8 MtCO2e by 2050. The key values that underpin this pathway are summarised in Table 7.12.1.
| Table 7.12.1 Key values in the Balanced Pathway for engineered removals |
||||||
|---|---|---|---|---|---|---|
| 2025 | 2030 | 2035 | 2040 | 2050 | ||
| Emissions | Emissions in year (MtCO2e) | 0.0 | -2.6 | -12.7 | -21.3 | -35.8 |
| Share of residual UK emissions offset by engineered removals* | 0% | 1% | 6% | 14% | 43% | |
| Key drivers – price variables | Average DACCS cost per tonne (£/tCO2e) | 391 | 365 | 322 | ||
| Average BECCS cost per tonne (£/tCO2e)† | 344 | 325 | 328 | 349 | ||
| Source: City Science (2025) Assessing the feasibility for large-scale DACCS in the UK; CCC analysis. Notes: Emissions in year refers to all engineered removals across subsectors. All costs are in 2023 prices. *This refers to the proportion of total UK emissions sources (that is, net emissions excluding engineered removals and land use sinks) that are offset by our pathway’s roll-out of engineered removals. †‘Average BECCS cost per tonne’ reflects a weighted average of costs across BECCS subsectors – the upward trend reflects higher-cost subsectors accounting for a larger share of the BECCS total over time. Reported abatement costs for BECCS do not include the value of the energy or fuel output by the process and therefore are not intended to reflect the likely cost of a carbon credit generated from these activities. |
||||||
Key elements of the Balanced Pathway for engineered removals
Engineered removals in the Balanced Pathway ramp up from 2028, with contributions first made by BECCS (across several sectors), then later from DACCS and enhanced weathering and biochar (Figure 7.12.1).
| Figure 7.12.1 Sources of abatement in the Balanced Pathway for engineered removals |
 Description: Engineered removals scale up from zero currently to make a steadily growing contribution in the 2030s and 2040s, with the largest contributions from BECCS (across a range of sectors), followed by DACCS. Source: CCC analysis. |
The key elements in the scale-up of engineered removals are:
Large-scale CO2 transport and storage infrastructure. CO2 transport and storage infrastructure is a key dependency for the two largest engineered removals technologies – BECCS and DACCS. As such, they are very likely to be located in carbon capture and storage (CCS) clusters and rely on effective and timely development of that infrastructure.
- The UK has access to high-quality permanent geological storage sites in the North Sea, which represents one of the largest such resources in Europe.[459] This could present an advantage for early UK CCS and engineered removals projects (Box 7.12.1).
- CO2 transport and storage infrastructure will be shared by removals and other projects that rely on capturing carbon, including the application of CCS at emitting sites in the industry, electricity supply, and waste sectors.
BECCS (89% of engineered removals in 2040). BECCS is the burning or converting of a biomass resource in a process with CCS applied. By capturing biogenic CO2 and sending it to permanent geological storage, BECCS is a net negative emissions process.[460] It can be applied in several sectors: in the Balanced Pathway it features in the electricity supply, industry, waste, and fuel supply sectors.
- Across sectors that use biomass, BECCS deployment begins between 2028 and 2035, depending on technology readiness, policy, and infrastructure needs. In total, annual removals from BECCS grow to reach -19 MtCO2e in 2040 and -25 MtCO2e in 2050.
- BECCS deployment is primarily driven by technological feasibility of the abatement options available in sectors that use biomass, subject to constraints on the amount of biomass that can be sustainably supplied (see Section 7.7 and Section 10.2).
- The Balanced Pathway sees a transition away from imported biomass towards domestically produced biomass feedstock (residues and dedicated energy crops). While biomass is likely to remain part of a global market, this approach demonstrates that the UK can become increasingly self-sufficient for the required demand, which is important given uncertainty about global supply and concerns about its sustainability. Producing most of the required biomass domestically will allow the UK to apply and verify the highest standards of sustainability (see Section 7.7 for further detail on biomass supply and Section 7.4 for details of our assumptions on energy crop production).
- Across sectors, BECCS provides value both through its contribution to energy or fuel production (for example, firm electricity generation) as well as the removals it generates.
- The electricity supply sector contributes the largest share of total BECCS in the Balanced Pathway. We assume power BECCS begins substantive deployment in 2032, reflecting an assessment of the timescales required to develop the policy support (including the current status of business model development) and enabling infrastructure. It grows out to around 2040 and remains broadly flat thereafter), reflecting the potential to retrofit existing biomass combustion plants. In Chapter 6, we discuss potential alternative options if the Government were to choose not to include power BECCS in its plan to deliver the Seventh Carbon Budget.
- Removals from BECCS play an important role in the Balanced Pathway reaching Net Zero. To reach Net Zero by 2050 with a reduced role for removals from BECCS would require greater use of some combination of DACCS, sustainable aviation fuels, and demand management in sectors with residual long-lived emissions, especially aviation. All of these present significant practical challenges and have uncertain costs.
- The total level of BECCS is around 50% lower in 2050 than in our Sixth Carbon Budget advice. This is driven by a combination of factors:
- A lower level of economy-wide residual emissions, in part driven by inventory updates (see Chapter 3), which reduces the need for engineered removals overall compared to our Sixth Carbon Budget advice.
- The desire to limit biomass use to ensure the highest sustainability standards can be applied to the biomass used and demonstrate how the UK could be largely self-sufficient in biomass production, with only a limited role for imports.
- Higher levels of other removal technologies relative to levels in the Sixth Carbon Budget analysis (see below).
DACCS (8% of engineered removals in 2040, growing to 22% by 2050). DACCS is a group of technologies designed to extract CO2 directly from the atmosphere through chemical and physical methods and send it to permanent geological storage. These technologies will be scaling up at pace in the Seventh Carbon Budget period and grow substantially by 2050.
- DACCS deployment is driven by the need to balance residual emissions in 2050 to achieve Net Zero, subject to scale-up feasibility constraints. Deployment begins in 2035, reflecting a combination of global technological readiness and UK-specific policy and infrastructure timelines. Capacity scales up in the late 2030s and 2040s to reach 8 MtCO2e in 2050.
- As DACCS provides no direct good or service other than CO2 removal (unlike, for example, electricity produced with power BECCS), the key driver of DACCS in the long term is the need to balance residual emissions from the rest of the economy, other than agriculture and land use (which are modelled as balancing each other). DACCS in the Balanced Pathway is set to balance residual emissions in 2050 to deliver Net Zero, after removals from BECCS, enhanced weathering, and biochar have been accounted for.
- The pathway between 2035 and 2050 reflects a balance of the scale-up needed to achieve the 2050 level, an assessment of maximum feasible build-out rates, and competing demands for direct air capture capacity from synthetic fuel production (see Section 7.7).
- There is potential for DACCS to scale up more quickly and to a higher overall level than we have assumed in our pathway (see Chapter 6), but feasible roll-out rates and costs are highly uncertain.
- DACCS technologies that are currently deployed or at a more mature development stage fall into two groups: liquid solvent and solid sorbent. Both solid and liquid DACCS are energy-intensive processes, albeit their energy demands are small in an economy-wide context (the energy required by the total amount of DACCS in our pathway equals 2% of economy-wide final energy demand in 2050). In the Balanced Pathway, high-temperature process heat required by liquid DACCS is provided by natural gas (with associated combustion emissions captured within the DACCS process), while lower-temperature process heat required by solid DACCS is provided by industrial heat pumps.
- Globally, there are now a number of small-scale plants that are operational or under construction, including Climeworks’4 ktCO2e per year capacity Orca facility (operational since 2021) and 36 ktCO2e capacity Mammoth facility (began operations in 2024) in Iceland, and Carbon Engineering and 1PointFive’s 0.5 MtCO2e capacity STRATOS facility in Texas (due to start operations in 2025).[461];[462];[463] Projects accounting for a total of over 60 MtCO2e of direct air capture capacity are under consideration worldwide as of 2024, but what proportion of these will proceed to operation is uncertain.[464]
Enhanced weathering and biochar (3% of engineered removals in 2040, growing to 8% by 2050). These techniques rely on land- and water-based CO2 storage. Enhanced weathering involves speeding up the natural process of rock weathering through grinding and spreading rock on land to accelerate its reaction with CO2 in the atmosphere to form bicarbonates. These bicarbonates are gradually washed via rivers into the sea, where the carbon is stored for centuries or more. Biochar as a removal involves processing biogenic waste materials which have removed atmospheric carbon and then heating these wastes in the absence of oxygen to form a stable carbon-rich biochar, which is resistant to breaking down and can be spread onto and absorbed by soils.
- Research programmes have supported improved modelling and field trials for both enhanced weathering and biochar in the UK.[465];[466] Assessments of the technical potential range from 3 MtCO2e to around 30 MtCO2e for enhanced weathering in 2050 and 0 MtCO2e to 20 MtCO2e for biochar.[467];[468]
- Given the high level of uncertainty, as well as the considerable policy and monitoring, reporting, and verification development needed to enable these methods to be included in the UK GHG inventory, we assume a small contribution in the Balanced Pathway, from the lower end of these potentials.
- In the Balanced Pathway, enhanced weathering and biochar are grouped into a single subsector, reflecting uncertainty on their relative roles. Deployment begins in 2030, scaling up to reach 3 MtCO2e in 2050.
- Evidence is relatively limited in terms of wider resource requirements (again justifying conservative total contributions). However, it is likely that at these low levels of enhanced weathering, rock supply could be met with limited need to expand existing quarrying capacity.[469]
More speculative GHG removal approaches do not feature in the Balanced Pathway. Research is ongoing into CO2 removal approaches such as ocean alkalinity, ocean fertilisation, and carbon-negative cement. These were considered insufficiently developed, or judged to have too large potential negative co-impacts, for inclusion in the Balanced Pathway.
| Box 7.12.1 UK DACCS in an international context |
| UK suitability for DACCS The UK has several positive features which could support the development of a domestic DACCS industry, including plentiful and accessible geological CO2 storage and a supportive policy agenda.
Potential for international DACCS More than any other abatement measure in the Balanced Pathway, there is a rationale for avoiding over-prescription with DACCS’ geographic siting.
The Balanced Pathway illustrates the potential to site DACCS in the UK and its wider implications. However, it is possible that funding DACCS removals internationally might be lower cost. Such an approach must be carefully considered.
We therefore do not recommend planning to use international DACCS at this stage, but it could be considered if the right conditions develop. Source: City Science (2025) Assessing the feasibility for large-scale DACCS deployment in the UK; CCC analysis. |
| Box 7.12.2 International DACCS case studies |
| The following case studies briefly explore the prospects for DACCS deployment in four geographies with potentially beneficial conditions. In each case there will be additional challenges to consider – this does not intend to provide a comprehensive assessment or endorsement of DACCS in these locations.
United States (Gulf coast) Texas is one of the few locations with active DACCS development underway, including a large (0.5 MtCO2 per year) plant planned to enter operation in 2025. Favourable factors in the US include:
Middle East (United Arab Emirates) With an established enhanced oil recovery market, DACCS developers are exploring the possibility of deploying DACCS in the UAE.[472] Favourable factors in the UAE include:
China While there is limited evidence of development of any large-scale DACCS projects in China so far, research is underway in independent facilities. Favourable factors in China include:
Kenya Developers are exploring DACCS in Kenya. Favourable factors in Kenya and the wider Great Rift Valley include:
Source: City Science (2025) Assessing the feasibility for large-scale DACCS deployment in the UK; CCC analysis. |
7.12.3 Costs, cost savings, and co-impacts
Delivering the Balanced Pathway for engineered removals results in a net cost to the economy (Figure 7.12.2). While the Government has an important role in supporting near-term scale-up, the majority of these costs should be borne by those industries which cannot reduce emissions to zero, particularly the aviation sector.
- BECCS and DACCS costs in the Balanced Pathway are dominated by operating expenditure, largely driven by the cost of biomass for BECCS and energy for DACCS. Capital expenditure is driven by plant construction and carbon capture infrastructure. These totals include costs associated with direct air captured CO2 for synthetic fuel production – not itself a removal but dependent on the same infrastructure (Box 7.12.3).
- Abatement costs in the Balanced Pathway for engineered removals are high and uncertain relative to other low-carbon technologies. This emphasises the need to avoid over-reliance on engineered removals to limit economy-wide costs.
- Costs per tonne of CO2 removed in 2050 range from an average of around £350/tCO2e across BECCS subsectors, to an average of £320/tCO2e for DACCS, to £95/tCO2e for enhanced weathering and biochar. However, reported abatement costs for BECCS do not include the value of the energy or fuel produced by the process, so the net cost of BECCS removals would be less than this. As these technologies are yet to be deployed at scale, all removals costs are highly uncertain.
Who pays for engineered removals is a policy choice. The Balanced Pathway largely assumes a ‘polluter pays’ principle, where those sectors with residual emissions, notably aviation, are expected to reduce their contribution to Net Zero, whether through in-sector emissions reductions or using removals to offset ongoing emissions. In the near term, however, government support will be needed.
- In the Balanced Pathway, the aviation sector is responsible for around 60% of the engineered removals required in 2050 and therefore would be expected to fund around 60% of the cost. The UK ETS, which already covers domestic and European aviation, or an equivalent mechanism, offers a reasonable means through which these costs could be allocated if engineered removals were added to the market.
- The waste, industry, and fuel supply sectors are the next largest sources of residual emissions in 2050, with small residuals in other sectors (see Chapter 3).[473] In most cases, including industrial subsectors, fuel refineries, and energy from waste plants, we expect most residual emissions will be included within the UK ETS or an equivalent mechanism. This would create a link to engineered removals if they also enter the UK ETS as proposed, clarifying a funding mechanism for residuals in these sectors. In other areas, such as wastewater, where there are no existing plans to integrate into the UK ETS, the Government should clarify long-term funding plans to balance residual emissions.
| Figure 7.12.2 Costs and cost savings in the Balanced Pathway for engineered removals, compared to the baseline |
 Description: Total costs in the engineered removals sector increase from the late 2020s, peaking in the 2040s. BECCS opex and DACCS opex are the largest contributors to sector-wide costs. Source: CCC analysis. Notes: (1) Capex is additional capital expenditure and opex is additional operating expenditure. Both are additional in-year costs in 2023 prices, relative to a baseline of no further decarbonisation action. (2) Capex for enhanced weathering and biochar is assumed to be incurred every five years, with each investment relating to the capacity required for the subsequent five years’ operation. |
| Box 7.12.3 Interdependencies between DACCS and synthetic fuel production |
| Total direct air capture capacity in the Balanced Pathway reflects both the removals required to offset residual emissions in 2050 and scale up to that level (DACCS), and the CO2 feedstock required to produce synthetic fuels for aviation and shipping. We only consider the emissions savings from the first of these within the engineered removals sector. The impacts of the latter are discussed in Section 7.6 and Section 7.10. We consider the total demand across both uses in determining feasible deployment rates (Figure 7.12.3).
There are interdependent uncertainties underpinning the amount of DACCS and CO2 feedstock required. Demand for engineered removals from aviation, for example, depends on in-sector emissions reductions through demand management, efficiency improvements, new aircraft, and sustainable aviation fuel (SAF). SAF in turn requires CO2 feedstock in part provided by direct air capture; greater uptake of SAF, therefore, would imply a lower total demand for engineered removals but a corresponding increase in direct air capture capacity for synthetic SAF. There is another factor to consider in direct air capture’s role. Current international emissions reporting guidelines are unclear regarding reporting of emissions savings derived from imported synthetic fuels. Due to this ambiguity, our analysis assumes synthetic fuels are produced in the UK. In practice, future synthetic fuel production and supply is likely to operate in an international market. IPCC inventory guidelines will need to be clarified to allow for imported synthetic fuels to contribute to UK territorial emissions savings. |
| Figure 7.12.3 Direct air capture capacity in the Balanced Pathway, broken into CO2 for storage and feedstock |
 Description: Beginning in the mid-2030s, there is a steady scale-up of both DACCS and DAC feedstock capacity, reaching similar total levels by 2050, with DAC split roughly equally between aviation and shipping. Source: CCC analysis. |
7.12.4 Key actions required to deliver the Balanced Pathway for engineered removals
Delivering the Balanced Pathway in engineered removals will depend on a combination of effective government policy and continuing progress in building key markets. With the public good of CO2 removal being the primary value that these measures create (especially DACCS, where CO2 removal is its sole purpose), government policy will be fundamental to drive their deployment. The key actions that are needed are as follows:
- Publish a common sustainability framework for biomass, along with robust procedures for monitoring, reporting, and verification. This should prioritise domestic supply and should provide clarity on which feedstocks are provably sustainable, both in terms of their climate impact and interactions with wider environmental objectives.
- Finalise business models for engineered removals. This should include providing clarity on the near-term funding pathway, including setting out the responsibilities of the public and private sectors.
- Ensure CO2 transport and storage infrastructure is developed in good time to support engineered removals. Acceleration is needed to ensure CO2 storage can begin in 2028 as planned. Clarity is also required around how engineered removals projects will integrate with CCS clusters. The Government ran a call for evidence on dispersed CCUS sites in 2024 and intends to consult on proposals for non-pipeline CO2 transport. This is welcome and should not be delayed.[474]
- Plan for the medium to long-term policy framework. Incorporating engineered removals into the UK ETS, alongside those sectors that are most likely to have residual emissions, is a viable approach and already under consideration. But it may not be suitable for every sector with residual emissions, in particular agriculture and land use, which we model as balancing one another.
Chapter 8: Households
Introduction and key messages
This chapter sets out how the Balanced Pathway will involve households. It includes the results of a citizens’ panel and analysis of the financial and non-financial impacts on households.
Our key messages are:
- The key changes households can make will be to buy heat pumps and electric cars when it is time to replace fossil fuel boilers or cars, and in some cases to insulate their homes. This will involve installation work in homes, but households will benefit from more efficient technologies, less draughty homes, and cleaner air.
- Many households will make overall savings over the transition period due to the greater efficiency of low-carbon technologies. This requires policy to help with upfront costs of home heating and insulation, reduce electricity prices, and manage distributional impacts.
- Households will eat less meat and dairy on average in our pathway. With appropriate policy, and supported by a range of affordable and attractive alternative options, this shift can improve health outcomes.
- Flying will remain around today’s levels in our pathway until sufficient technological solutions are developed, at which point there may be scope for some increases in flying in later years of the pathway. The pace of development of decarbonisation solutions for the aviation sector is uncertain. Less than 10% of people fly abroad more than three times a year, while half the population does not fly abroad at all in any given year.
- Our citizens’ panel felt the Net Zero transition could be made accessible and affordable to all households, provided that policies and business action make household low-carbon choices easy, attractive, and affordable, and trusted information is provided.
- The transition can benefit people who are disadvantaged by reducing fuel poverty, improving air quality in disadvantaged areas, and improving workforce diversity in growing sectors. Net Zero policies should include targeted outreach and support for home heating and improved accessibility of public transport and active travel.
8.1 Household low-carbon choices
In this section, we summarise the low-carbon choices households make in our Balanced Pathway. Our approach to determining the level of household choices is set out in Chapter 2. In the following sections, we present the findings from our citizens’ panel (see Section 8.2), what household low-carbon choices mean for costs and savings of different households (see Section 8.3), wider costs and benefits (see Section 8.4), and impacts for disadvantaged groups (see Section 8.5).
8.1.1 Household low-carbon choices
Household contributions to the Balanced Pathway
The transition from now until 2050 will involve changes that directly involve households, contributing a third of total emissions reduction (136 MtCO2e) by 2040 (the middle year of the Seventh Carbon Budget period) (Figure 8.1). The most significant changes involving household choices cover four areas: cleaner and more efficient home heating, cleaner and more efficient road travel, keeping flying close to today’s levels until technology develops, and a reduction in average meat and dairy consumption.
- Electric cars and low-carbon heating: from an emissions perspective, the most impactful one-off purchase decisions households will make are purchasing an electric car (42% of emissions reduction by households in 2040) and a low-carbon heating system (30% of emissions reduction by households in 2040).
- Meat, dairy, and flying: by the Seventh Carbon Budget period, emissions from agriculture and flying are a significant proportion of remaining emissions, with limited alternatives to reduce emissions. Households consuming on average less meat and dairy than today results in a 6% emissions reduction by households in 2040. By 2050, this enables a similar sized emissions reduction by freeing up land to enable tree planting.[475] Keeping flying close to today’s levels results in a 6% emissions reduction by households in 2040 compared to the baseline, with further impacts on reducing non-CO2 effects.
- Energy efficiency and modal shift: installing energy efficiency measures to better insulate homes will be important for some households (4% of emissions reduction by households in 2040) and helps reduce the need for additional renewable electricity generation. Modal shift (replacing some car journeys with public transport, cycling, and walking) is important for emissions reduction early in the transition before cars are electric (3% of emissions reduction by households in 2040).
- Other household actions: there are some other actions which play a smaller role in the emissions reduction (which together account for 8% of emissions reduction by households in 2040). These include energy-saving practices in homes; reducing waste and recycling more; switching to more energy efficient electrical appliances (for example, more efficient fridges); and switching to electric cooking appliances.[476]
Government and businesses should work together to make these choices easy, attractive, and affordable for households, provide trusted, accurate information about reliability and suitability of low-carbon heating technologies, and engage the public with a vision for households and their role in the transition.
| Figure 8.1 Emissions reduction in 2040 that relies on household low-carbon choices |
 Description: A third of the emissions reduction in 2040 is due to household low-carbon choices. The most significant of these in terms of emissions reduction are switching to electric vehicles and switching to low-carbon heating systems. The other actions are an average reduction in meat and dairy consumption, keeping flying close to today’s levels, energy efficiency measures in homes, modal shift, and ‘other’ (which includes a range of smaller household measures). Source: Climate Change Committee (CCC) analysis. Notes: (1) This only includes the emissions reduction directly associated with household low-carbon choices. For example, shifts to electric vehicles by businesses are not included, nor are changes that affect households (for example, construction of energy infrastructure) but are not driven by a household choice. (2) ‘Other’ includes smaller measures: reducing waste, recycling, energy-saving practices in homes, switching to energy efficient household appliances, household resource efficiency measures, and speed limiting. (3) The charts show the proportion of emissions reduction in 2040 relative to the baseline. |
Variation across households
Low-carbon choices will vary by household. For example, many households do not fly, and switching to public transport may be more feasible for urban households.[477] While all home heating and nearly all cars will be electrified by 2050, the timing of when the switch happens will vary. Figure 8.2 shows the current emissions per individual from driving, home energy use, meat and dairy consumption, and flying, for three illustrative individuals, who have energy use and activities representative of the lowest-income quintile, median-income quintile, and the upper-income quintile.
- Driving: for households that have petrol or diesel cars, driving plays a significant role in emissions. This varies largely based on how often and far people drive and the efficiency of the car. On average, higher-income households drive more.[478]
- Home energy use: home heating is a significant contributor to household emissions across most households that have fossil fuel heating. There is variation based on building characteristics, with greater emissions from larger and less insulated homes and those with oil boilers.
- Meat and dairy: variation in emissions is driven by the diet choices of each household. Emissions from meat and dairy consumption show little variation by income on average.
- Flying: a large variation in household emissions is driven by frequency and length of flying. Half of the population do not take any flights abroad in a given year, while less than 10% of people fly abroad more than three times a year.[479]
| Figure 8.2 Estimated current emissions from home energy use, driving, flights, and meat and dairy consumption of three illustrative individuals |
 Description: Emissions vary by individual. If we take three illustrative individuals with energy use and activities typical of the lowest income quintile (Person A), of a median income quintile (Person B), and the upper income quintile (Person C), we see that for all three, emissions from home energy use, driving, and meat and dairy consumption are a significant source of individual emissions. A large variation in individuals’ emissions is driven by frequency and length of flying, with Person A not flying at all and Person C flying four times per year. Source: CCC analysis. Notes: (1) This does not show the full emissions of individuals as emissions from other sources are excluded. (2) Emissions are estimated based on published data of activity levels across income groups. They are not based on total household emissions in the UK and are intended to be illustrative. (3) We show three illustrative individuals with energy use and activities typical of the lowest-income quintile (Person A), a median-income quintile (Person B), and the highest-income quintile (Person C). They each have gas boilers, drive petrol cars, and consume meat and dairy. Person A does not fly, Person B takes one return flight a year to Spain, and Person C takes four return flights a year (three times within Europe and one long haul outside of Europe). (4) Emissions from inbound flights and meat and dairy imports are not included in the UK’s carbon budgets, but still contribute to international emissions. (5) In the Balanced Pathway, household low-carbon choices will generally reduce the emissions from home energy use and transport to zero. A portion of emissions will reduce from meat and dairy consumption. |
8.1.2 Driving
Electric cars and modal shift (42% and 3% of household emissions reduction in 2040 respectively).
- The transition involves households replacing petrol and diesel cars with cleaner and more efficient electric cars, generally at the point when the old car requires replacing. Electric cars will make up all new car sales by 2035 and feed through to the second-hand car market. Almost all cars on the road (apart from cars that are over 15 years old or classic cars) by 2050 will be electric cars (Table 8.1).
- Our pathway also includes a shift away from private car use to other modes of transport (modal shift), with 7% of car kilometres shifted to public transport, cycling, and walking by 2035. The reduction in car kilometres is primarily achieved in more built-up urban areas.
Costs, savings, and distributional impacts
Electric cars are expected to reach price parity with petrol and diesel cars between 2026 and 2028 and bring with them lower running costs. Impacts on household bills are discussed in Section 8.3.
Citizens’ panel
The citizens’ panel (see Box 7.1.1 and Section 8.2) were generally familiar with electric cars and comfortable with phasing out the use of petrol and diesel cars. They thought that investment in charging infrastructure and public transport (especially to reduce ticket prices) is necessary. In addition, they said concerns about upfront costs and reliability of electric cars in the second-hand market need addressing.
Policy implications
These shifts can be achieved through improved infrastructure for charging electric cars and public and active travel (including reducing the cost of local public charging and public transport), improved information and a clear plan for the second-hand market. Government should also monitor the potential rebound effect due to EVs (increased driving as a result of lower driving costs). See Section 7.1 for further discussion of policy actions.
8.1.3 Home energy use
Low-carbon heating and energy efficiency measures in homes (30% and 4% of household emissions reduction in 2040 respectively).
The transition involves households replacing fossil fuel boilers for home heating with cleaner and more efficient low-carbon technologies such as heat pumps or heat networks using a low-carbon heating source.[480] Many households will install energy efficiency measures such as insulation.
- In the Balanced Pathway, after 2035 no new fossil fuel heating systems are installed and all homes have a low-carbon heating system fitted by 2050 (Table 8.1). In our pathway, this happens when an old heating system is reaching the end of its life.
- For some households (17%), ‘big’ energy efficiency measures (for example, cavity wall, solid wall, loft, and floor insulation) will help reduce emissions and generate savings. The Balanced Pathway includes 5.5 million such big energy efficiency measures by 2040. All suitable households will install ‘small’ energy efficiency measures (for example, draught-proofing windows and doors and hot water tank jackets where applicable).
Costs, savings, and distributional impacts
Low-carbon heating technologies carry higher upfront costs than their fossil fuel equivalents. Once installed, they tend to be cheaper to run as they are more efficient and can offer additional savings when households make use of heat flexibility and time-of-use heat pump tariffs.[481] Impacts on household bills are discussed in Section 8.3.
Citizens’ panel
The citizens’ panel (see Box 7.2.1 and Section 8.2) were initially mostly unfamiliar with heat pumps and had questions and concerns about the technology, cost, reliability, and installation process. Once questions were answered, the panel felt this household choice could be affordable and accessible, provided upfront costs were addressed with grants, information campaigns addressed concerns about the technology, and there was a clear plan for renters.
Policy implications
The shift can be achieved through support to help with the upfront costs of low-carbon heating and insulation, making electricity cheaper, ensuring streamlined and more reliable installation processes (via improvements to the planning system, standards, and skills policy), policies tailored to the private rented sector that consider landlord incentives and renter protection, and improved information. See Section 7.2 for further discussion of policy actions.
Meat and dairy
Reduction in average meat and dairy consumption (6% of household emissions reduction in 2040).
The transition involves less meat and dairy in the average UK diet, with the aim to reduce UK livestock numbers and free up land for measures such as woodland creation, while not increasing imports of meat and dairy.
- By 2040, 25% of meat (30% of red meat) and 20% of dairy is replaced with lower-carbon foods, compared to 2019 consumption levels (Table 8.1).
- The reduction in meat and dairy consumption is an average across the UK population, so it can vary by person depending on characteristics such as current consumption, age, health, and cultural or personal preference.
- In the Balanced Pathway, households replace some meat and dairy with a mix of whole foods such as legumes, plant-based alternatives, and more novel alternative proteins.
- This reduction in meat and dairy goes beyond the existing long-term consumption trend, which, if projected forward, would lead to a 5% reduction in meat and an 8% reduction in dairy consumption by 2030 (compared to 2019).[482];[483] In our Balanced Pathway, we assume a gradual average reduction over a 25-year period for meat and over a 10-year period for dairy (Table 8.1).
Costs, savings, and distributional impacts
We do not expect significant distributional impacts from our pathway related to an average reduction in meat and dairy consumption.
- Changes to household food spending as a result of climate policy are expected to be small compared to general food price fluctuations. Impacts will depend on policy choices, but products such as legumes and plant-based meats are already available at prices cheaper than meat, and we assume further development and cost reductions in alternative proteins.
- This applies to a range of household diets across different characteristics including income decile, age, ethnicity, disability status, number of children, and region.
Citizens’ panel
The citizens’ panel (see Box 7.4.1 and Section 8.2) were generally supportive of an average reduction in meat and dairy consumption but raised concerns about people who may be less willing or able to shift to lower-carbon foods. They supported information on the emissions impact of foods, reducing the price of convenient meat and dairy alternatives, and policies that shift people to a healthier diet at the same time. They were fairly supportive of replacing a small amount of meat in ready meals with other ingredients, and government support for alternative proteins.
Policy implications
Meat and dairy alternatives can be made attractive and affordable through information provision, increasing choice and availability of lower-carbon foods in public procurement, restaurant, and supermarket settings, changes to product composition, expanding alternatives such as alternative proteins, and ensuring lower-carbon alternatives are cheaper than meat and dairy products. See Section 7.4 for further discussion of policy actions.
8.1.5 Flying
Keeping flying close to today’s levels until technology develops (6% of household emissions reduction in 2040).
Flying remains at around today’s levels until technological solutions can be deployed at the required scale to decarbonise aviation in line with Net Zero. Once there is more certainty on the scale and deployment of technological solutions, there may be some increases in flying.
- In the Balanced Pathway, the aviation sector reaches Net Zero emissions through a combination of measures to directly reduce emissions from flying, engineered removals, and managing aviation demand. Aviation sector decarbonisation solutions are at an early stage of development.
- In the Balanced Pathway, demand starts to increase once aviation decarbonisation technology is developed. We assume this is from around 2035, with flying increasing by 10% by 2040 and 28% by 2050 compared to 2025 levels (Table 8.1).[484] This is less flying than is projected to occur in a scenario with no policy to limit growth in flying.[485] However, the pace of development of decarbonisation solutions for the aviation sector is uncertain.
- Leisure flights by households account for most flights (86%) and have driven growth in flights in recent decades. We assume lower growth of both business and leisure flights compared to the baseline of no further decarbonisation action (see Section 7.6).
Costs, savings, and distributional impacts
Government, industry, and household choices will shape who flies.
- Leisure flying is unequally distributed across income groups, with high-income households much more likely to fly frequently. Half of the population does not fly abroad in any given year. Less than 10% of people fly abroad more than three times a year, and we estimate they are responsible for almost half of passenger flights abroad.[486] For those households that fly frequently, one of the most significant actions they can take is to fly less.
- The costs of decarbonising flying will be carried by the aviation industry and so will likely be reflected in ticket prices (see Section 8.3), which would increase average ticket prices compared to today’s levels. The Government’s choice of policy levers and industry decisions will influence which flights have higher costs. Government should ensure distributional impacts are considered.
- Under some potential policies, such as a frequent flier levy, the minority of households who fly multiple times a year would be discouraged from flying so frequently.
Citizens’ panel
The citizens’ panel (see Box 7.6.1 and Section 8.2) viewed flying as a ‘luxury’ choice, but wanted to ensure households can travel abroad on holiday once a year. They generally accepted that policy is needed to manage demand for aviation and that this will likely mean an increase in ticket prices, which they preferred to be targeted towards frequent fliers and the most polluting flights.
Policy implications
It is up to government which policies to use to ensure flying stays close to today’s levels until technology develops. See Section 7.6 and Box 7.6.2 for further discussion of policy actions.
8.1.6 Other household low-carbon choices
- Households have an important role to play in influencing imported emissions (in addition to territorial emissions), through reducing consumption of high-carbon imported goods. Reducing meat consumption will reduce imported emissions, as a third of our meat is imported.[487] Similarly, keeping flying close to today’s levels will also affect the UK’s imported emissions, as our territorial inventory only counts flights departing from the UK, not flights taken by UK citizens elsewhere (see Chapter 10).
- Uptake of small-scale renewables by households or communities can contribute to emissions reduction. While large-scale solar is more cost effective, small-scale solar could provide valuable benefits particularly where local grid capacity is constrained.
- Wider public engagement on other aspects of the transition, including energy infrastructure (for example, transmission towers or pylons), will also be key (see Chapter 5). There is strong public concern about climate change and a desire for government leadership.[488];[489] Government should develop policies in a way that works for people.
| Table 8.1 Key values in the Balanced Pathway for household low-carbon choices |
||||||
|---|---|---|---|---|---|---|
| Grouping | Variable | 2025 | 2030 | 2035 | 2040 | 2050 |
| Driving | Percentage of electric cars in the fleet* | 6% | 29% | 57% | 80% | 97% |
| Modal shift (percentage of car-km switched to public or active travel) | 1% | 4% | 7% | 7% | 7% | |
| Car-km avoided from modal shift per capita | 51 | 292 | 451 | 460 | 465 | |
| Total car-km per capita† | 6,322 | 6,345 – 6,488 | 6,387 – 6,761 | 6,509 – 7,024 | 6,572 – 7,352 | |
| Home heating | Percentage of homes with heat pumps | 2% | 6% | 26% | 52% | 80% |
| Percentage of homes with a low-carbon electrified heating system | 9% | 16% | 39% | 68% | 100% | |
| Deployment of ‘big’ energy efficiency measures (cumulative, millions)‡ | 0.2 | 4.6 | 5.5 | 5.5 | 5.5 | |
| Meat and dairy | Change in average meat consumption (as a percentage of 2019 levels) | -3% | -11% | -20% | -25% | -35% |
| Change in average dairy consumption (as a percentage of 2019 levels) | -4% | -12% | -20% | -20% | -20% | |
| Meat consumption (grams/person/week)§ | 1,011 | 928 | 834 | 782 | 678 | |
| Dairy consumption (grams/person/week) | 1,918 | 1,758 | 1,598 | 1,598 | 1,598 | |
| Flying | Change in aviation terminal passenger demand as a percentage of 2025 levels | -0.6% | +2% | +10% | +28% | |
|
Notes: *This shows the overall proportion of the car fleet that is electric, including both household and business vehicles. We make different modelling assumptions for each group, which leads to a slightly faster uptake of electric cars among business fleets. We do not include hybrids in this proportion. †The lower range captures an assumed increase in driving in the baseline and a reduction in driving due to modal shift. The upper range in addition includes an increase in driving due to lower running costs of electric cars. Car-km includes business travel. ‡’Big’ energy efficiency measures include loft insulation, wall insulation, and floor insulation. Some households may install more than one of these. §For illustration, a meat main (for example, a large doner kebab, a 6oz steak, or a cooked breakfast) contains around 130 grams of meat (cooked weight). The average reduction of meat consumption by 2040 would equate to on average having two fewer meat mains per week.[490] |
||||||
8.2 Citizens’ panel
We convened a citizens’ panel to explore the question of what an accessible and affordable vision of Net Zero would be for households, given the household low-carbon choices set out above and the associated costs and cost savings set out below (see Section 8.3).
The citizens were on board with the key choices households will need to make. They wanted to see a range of government policies to make these choices accessible, attractive, and affordable for households. The citizens wanted government support for upfront costs and trusted public information to explain what is needed and to address misconceptions about Net Zero and key household choices. With the right balance of policies, most citizens felt the Net Zero transition could be made accessible and affordable to all households.
8.2.1 Approach
A citizens’ panel is a group of citizens, broadly reflective of the UK population, convened to explore the preferences and opinions of the public – once they have been informed and discussed a topic together in depth.
The Committee commissioned Ipsos to deliver a citizens’ panel in Birmingham to deliberate what households would need for six key household low-carbon choices to be accessible and affordable for all households.
- The panel consisted of 26 members of the public from Birmingham and surrounding areas (urban and rural). Panel members were selected to be broadly reflective of the UK population in terms of key characteristics including age, ethnicity, income, living situation, views on climate change, and political affiliation. The panel met a total of seven times for three-to-six-hour panel sessions, with a mix of face-to-face and online meetings.
- The six household low-carbon choices included in deliberations were: a switch to electric cars, modal shift (reducing some car-kilometres by shifting journeys to public transport, walking, or cycling), a switch to heat pumps, home insulation (such as loft or cavity wall insulation), a reduction in average meat and dairy consumption, and keeping flying close to today’s levels until technology develops.
- The emphasis of the workshops was on exploring which policies were (and were not) viewed as making the six household choices acceptable and affordable for households experiencing different circumstances (rather than focussing on identifying an acceptable level for household choices).
- The sessions began with a learning phase, where citizens were informed about climate change, Net Zero, and key household low-carbon choices. Subsequent sessions focussed on each household choice, where citizens learnt about what these choices would involve and considered a range of policy options, including their fiscal implications and evidence on their effectiveness. Panel members then discussed what policies would (and would not) make choices accessible and affordable for themselves and for other households, and were also able to suggest additional policies.
8.2.2 Overall findings
By the end of the panel, over two-thirds of panel members said they thought each of the household choices could, with the right policies in place, be achieved in a way that is accessible and affordable for all households. In the final session, panel members predominantly commented that they felt positive and hopeful about the Net Zero transition.
A full citizens’ panel report and summary for policymakers set out the findings in detail on our website.[491];[492] Findings from the panel for each of the six household low-carbon choices that were explored are captured in Chapter 7 in Boxes 7.1.1, 7.2.1, 7.4.1, and 7.6.1. As part of the deliberations on buildings and transport, panel members were able to view findings of the Committee’s distributional modelling (see Section 8.3) and agree on their own set of policies to make household choices for home heating and driving accessible and affordable for all households, which is summarised in Box 8.1.
Here, we summarise the main overarching insights from the process.
- People were on board with the household low-carbon choices provided there was an important role for government to support households in making informed choices and to help with upfront costs. People supported the idea of government setting dates after which no new gas boilers or petrol and diesel cars can be sold.
- People wanted proactive information and public engagement from government to provide guidance and education on climate change, Net Zero, and the emissions reduction potential of the different household choices and to dispel misinformation around low-carbon technologies. While increasing awareness and information are insufficient as a sole driver of change, the panel saw them as an important prerequisite for change.[493];[494]
- Different policies were acceptable for choices seen as necessities, as opposed to luxuries. For what the panel saw as necessities (heating homes and driving related to commuting), public spending to support households was viewed as more acceptable and increases in price (such as fuel prices) were of concern. For flying, which was seen as more optional, an increase in ticket prices was seen as acceptable, while spending public money on reducing emissions through removals was viewed as being unacceptable.
- People seemed more comfortable with options that are more familiar. Panel members felt most comfortable with the idea of switching to an electric car, which they were familiar with. Heat pumps, a technology people were less familiar with, raised more concerns. Similarly, the panel felt relatively comfortable with existing plant-based meat and dairy alternatives, but less so with more novel alternative proteins. Panel members expressed a high level of suspicion around engineered removals technologies, which they were not familiar with.
- Upfront costs were key, and much more important than overall savings for household affordability and purchase decisions. If a household choice was not affordable, it was not viewed as acceptable. When considering affordability, the panel focused mainly on upfront costs. Savings in running costs would need to be large and to pay back the additional upfront cost relatively quickly (for example, over a period of between three and five years) to override decisions made based on upfront costs. They suggested upfront costs could be spread out through mechanisms such as interest-free loans. Concern about upfront costs was particularly pronounced for heat pumps and home insulation and less so for electric cars, due to the large savings in running them.
- Panel members wanted government to explore ways in which the private sector (such as airlines and energy suppliers) can contribute towards paying the costs of switching to low-carbon technologies. This was emphasised when panel members felt companies could make a profit from the activity or switch (for example, energy suppliers). While there was an appreciation that costs covered by companies often come back to the consumer, panel members were clear that options for companies to carry some of the costs should be explored.
- People wanted to protect those with limited choice and/or on a low income, but also generally accepted the idea that higher-income households may make bigger savings. Policies which penalise those that cannot afford to switch (for example, making gas more expensive without helping low-income households switch to heat pumps) were seen as unacceptable. Some of the panel wanted to avoid excluding those earning more from grants. The panel viewed it as inevitable and acceptable that higher-income households often make bigger savings overall: while investing in new technologies means they benefit from lower running costs earlier, they also take the risk of investing in new technology first.
- People were concerned about protecting farmers’ livelihoods when discussing a reduction in average meat and dairy consumption. Panel members said that farmers are already often in a difficult position financially. They were surprised to learn about subsidies for livestock farmers and wanted to see public spend also going to producers of plant-based alternatives so these would reduce in price.
8.3 Distributional impacts
In this section, we discuss the impacts of the transition on household spending, as well as the distribution of costs and savings across different household archetypes. We assess the main direct impacts of the Balanced Pathway on household expenditure, discussing changes in surface transport and home heating in detail and summarising impacts on food and flying.
There will also be some indirect impacts on households from other sectors, however the impacts of these indirect effects on households are uncertain and are not included in this section. As a result, total costs are different to those in Chapter 4 which cover the whole economy. However, all costs are consistent, but for households, we convert whole-economy costs into retail prices.
8.3.1 Costs and savings for a typical household
In this section, we assess the change in bills and upfront costs for a typical household.[495] We have estimated total bills based on median energy consumption and retail energy prices, and have annualised the upfront capital costs involved in buying new heating systems and cars. Our assessment of overall costs with policy support is based on analysis explained in Section 8.3.2.
For the typical household, bills will be lower in 2050 than in 2025 for heating and driving (Figure 8.3), with minimal changes to food costs and with flying costs increasing. Upfront policy support will be needed to help with the upfront costs of changing how households heat their homes. Provided this happens, Net Zero will lead to savings overall when considering upfront costs and bills together, compared to a baseline of no further climate action, over the period 2025 to 2050.
- Home energy use: by 2050, a typical household energy bill (excluding driving) will be around £940 per year, compared to around £1,650 in 2025.[496] However, installing heat pumps and improving home energy efficiency will require additional investment – equivalent to £730 per year when annualising £15,000 additional spend over the technology lifetime – which policy will need to address.[497] Depending on the level of policy support, a typical household will experience somewhere between £100 in savings to £150 in additional costs per year, on average, from 2025 to 2050.[498]
- Transport: by 2050, a typical household’s driving fuel costs will be around £220 per year, compared to around £790 in 2025 (excluding fuel duty – see Section 8.3.2). This is largely due to a switch to electric cars, with energy costs already three times lower for electric than petrol cars per mile (assuming home charging – see Section 8.3.5). Electric cars are currently more expensive upfront than petrol cars, but this price premium is falling quickly and new electric cars are expected to cost less upfront by 2026 to 2028. Depending on the level of policy support, a typical household will experience around £550 in savings per year, on average, from 2025 to 2050.
- Food and drink: changes to meat, dairy, and vegetable consumption will vary for different households, but costs are expected to change by less than 5% as a result of Net Zero. Slight reductions in food costs are expected in the longer term as alternative proteins develop.
- Flying: effects on costs of flying will vary depending on how much each household flies, with half of households not flying abroad in a given year. While future ticket prices and UK income are highly uncertain, as an example, if the Government’s high carbon value is applied to airline emissions and airlines are assumed to pass 100% of costs onto tickets, by 2050, a return ticket from London to Alicante, Spain, would increase by about £150, and a return ticket from London to New York would increase by about £300. This is 2–4% respectively of the estimated absolute increase in annual real household income per capita between 2023 and 2050.[499]
| Figure 8.3 A ‘typical’ household’s annual spend on home energy, transport, and food in 2025 and 2050, without further policy support |
 *This shows costs before policy support, with upfront support needed in practice to address upfront heating system costs. Heat pump capital and installation costs also vary significantly by household type and size. Description: The most significant changes in a typical household’s spend between 2025 and 2050, before we take policy support into account, will be a reduction in energy and fuel bills and additional upfront costs for changing to a low-carbon heating system. There will be minimal changes to spend on food and drink. |
8.3.2 Home energy use and transport: approach to modelling
Distributional modelling: in the following sections, we assess the impact on different households’ costs and savings of two illustrative policy packages that enable households to switch to low-carbon heating and electric cars, to insulate homes, and to switch some driving to public and active travel. We used our Net Zero Distributional Model to assess the impact of our Balanced Pathway for residential buildings and surface transport on costs for households and the Exchequer, under two policy packages.
Household archetypes: the model assigns each household in the UK to an archetype, based on characteristics such as income and energy consumption. Each archetype represents a proportion of the population, with their overall characteristics reflective of the total UK population. These archetypes do not represent every household in the UK, but are illustrative of the key characteristics that determine the distribution of costs and savings. We refer to archetypes A1–A6 as low income, A7–A10 as middle income, and A11–A15 as high income.
Two policy packages: we modelled two illustrative policy packages to test the potential impacts of the Balanced Pathway (Table 8.2). These are not comprehensive or recommended policy packages, but explore choices available to policymakers and potential costs and savings for households and the Exchequer.
- In policy package one, households are incentivised to decarbonise through increasing costs of high-carbon options, shifting electricity policy costs mostly onto gas, and supply-side measures, decreasing the relative price of low-carbon technologies. Low-income households are provided with targeted grants for energy efficiency measures and heat pumps.
- In policy package two, all households are provided with upfront grants for energy efficiency measures and heat pumps. Electricity policy costs are shifted mostly onto taxation, and increased public spending is funded by higher levels of general taxation for households.
- We also show the impacts of our pathways for households without policy support (‘before policy’). We do not consider this to be a realistic scenario, as households do not have sufficient incentive to take up heat pumps without policy support in many cases, but we use this as an illustrative comparison to show the impacts of policy packages. We compare these costs and savings to a baseline of no further decarbonisation action.
Exchequer impacts: both packages have the same net impact on the Exchequer, as net spending is balanced through changes to general taxation and captured as a household cost. We only include changes that are a direct consequence of modelled policies (for example, to fund grants).
Fuel duty: we exclude fuel duty from all calculations for petrol, diesel, and electric cars. This is because we assume there will be policy in place to maintain current levels of taxes, but we leave the approach as a choice for government.
Impact on technology uptake: the choice of policy package does not impact uptake in the model. Our modelling assumes households follow the same uptake rates of low-carbon technologies under each policy package, both in line with the Balanced Pathway. We have constructed both policy packages to have the same impact on average household economic incentives (see Section 8.3.3).
| Table 8.2 Summary of policy packages tested in the Net Zero Distributional Model |
|||
|---|---|---|---|
| Policy type | Policy | Policy package one | Policy package two |
| Upfront grants | Grants for low-carbon heating | Low-income households | All households |
| Grants for home insulation | Low-income households | All households | |
| Grants for electric cars | No | No | |
| Supplier obligations | Boiler manufacturer obligations | Yes | No |
| Car manufacturer obligations | Yes | Yes | |
| Tax incentives | Reduced policy costs on electricity | Yes, mostly to gas bills | Yes, mostly to taxes |
| Increased tax on petrol and diesel cars (vehicle excise duty) | Yes | No | |
| Increased tax on heating fossil fuels | Yes | No | |
| Public investment | Investment in EV charging infrastructure | Yes | Yes |
| Investment in public transport and active travel infrastructure | Yes | Yes | |
| Phase-out dates | Phase-out date for new fossil fuel boilers* | Yes | Yes |
| Phase-out date for new petrol and diesel cars* | Yes | Yes | |
| Note: *Phase-out dates do not directly impact on the distribution of costs and savings in our modelling. We include them here as we assess them to be a key component of policies to ensure sufficient confidence and incentives for the roll-out of heat pumps and electric cars. | |||
8.3.3 Home energy use and transport: incentives to switch
Households will need low-carbon options to be affordable and attractive in order to transition to new technologies. In both policy packages, a household gains £2,000 on average when switching to a heat pump instead of a gas boiler, over the lifetime of the technology.[500]
Households will require support to help with the additional upfront costs of low-carbon heating, via grants, financing options, or other means. Upfront costs will vary by household.
- Policy package one provides grants for low-income households (A1–A6), which are close to £6,500 in 2025, falling to around £2,000 by 2050. Policy package two provides heat pump grants to all households (around £9,000 in 2025, falling to around £5,000 by 2050). We assume archetypes without grants borrow at commercial rates (A7–A10) or use money from savings (A11–A15).
- Although, on average, this ensures a household saves £2,000 over the lifetime of the heating system, this will not address the full additional costs for all archetypes as costs of home heating vary based on factors such as building type and heating system.
- For example, in our buildings sector modelling, most low-carbon heating systems and accompanying one-off home retrofit measures have a combined annualised additional cost of between £300 and £1,300 per year over the lifetime of the technology. The precise level of grant or other financial mechanism (such as low-interest loans) is a choice for government.
Without policy action, the price of running a heat pump will not reach parity with the price of running a boiler until 2035 (Figure 8.4). Electricity is currently around four times more expensive than gas, cancelling out the efficiency gains of heat pumps (heat pumps are three-to-four times more efficient than gas boilers). This is partly due to the inclusion of policy costs in electricity bills, many of which are not directly related to the cost of generating electricity currently. Renewables deployment is expected to reduce the price of electricity over time, but without addressing policy costs, this will only be enough to reach price parity in running costs by the mid-2030s (Figure 8.4).
To address this, both policy packages move policy costs off electricity bills onto a mixture of gas bills and taxation.[501]
- In policy package one, policy costs are moved onto gas bills initially, before shifting onto general taxation from 2045 to avoid placing high costs on the small number of households remaining on the gas grid. This immediately makes a heat pump cheaper to run than a gas boiler but increases the average dual fuel bill for those using gas boilers in the short term.
- In policy package two, policy costs are funded through a mixture of gas bills and taxation. Price parity between heat pump and gas boiler running costs is immediately reached without increasing the average dual fuel bill (which sees a decrease in electricity costs and an equivalent increase in gas costs).
The public spending implications of both policy packages fall within the range of public expenditure we set out in Chapter 4. Policy package two has a more significant component of public expenditure, due to universal grants and removing electricity policy costs, which is modelled as an increase in general taxation across household archetypes. Policy package one sees expenditure on grants and electricity policy costs broadly balance with revenue from taxes on fossil fuels.
| Figure 8.4 Annual energy bills for average dual fuel consumer and a heat pump user under different policies |
   Description: Once some policy costs are removed from electricity, the annual energy bill for a typical household with a heat pump becomes lower than the annual energy bill of a typical household with a gas boiler. Source: CCC analysis using Ofgem data. Notes: (1) Figures shown are for Ofgem’s median household energy consumption with a gas boiler, compared to a heat pump user with equivalent heat demand, under different policy scenarios. (2) Home energy costs in this figure include heating, cooking, lighting, other home energy use, and standing charges, but exclude car charging costs as these are captured in other analysis. (3) Energy prices include the cost of decarbonising electricity and network investment. (4) We do not include any costs related to decommissioning of the gas grid in energy bills; to the extent these occur, they are captured in our fuel supply sector costing. (5) Effects of other policies in policy packages (such as additional taxes on gas beyond rebalancing of policy costs from electricity) are not included here. |
8.3.4 Home energy use and transport: overall costs and savings
Under both policy packages, most households save over the transition period (2025 to 2050) compared to a baseline of no further decarbonisation action, largely due to reduced transport costs (Figure 8.5). However, this is not the case for some households who do not drive.
- Transport: for changes to transport, most household archetypes (12 of 15 archetypes) receive net savings of up to 2.1% of net household income per year. Households without cars (archetypes A1, A3, and A13) face net costs of up to 0.1% of income per year as they do not receive the benefit of reduced driving costs, but still face higher taxation to fund public investment in EV charging infrastructure, public transport, and active travel.
- Home energy use: for changes to home heating, approximately half of the archetypes (between six and nine of the 15 archetypes, depending on the policy package) receive net savings of up to 2.4% of income and others face net costs, all of which are no more than 1% of household income. Larger costs are faced by archetypes that are unsuitable for heat pumps, communal heat pumps, or heat networks (archetypes A3 and A13) as they install direct electric heating, resulting in higher bills than other technologies due to lower efficiency (despite lower upfront costs). Archetypes switching away from direct electric heating (archetype A10) experience the highest overall savings (over the period from 2025 to 2050).
- Overall: both policy packages provide overall savings for most household archetypes (11–12 of the 15 archetypes). Total impacts range from costs of 1% to savings of 4% of household income.
Both policy packages lead to most lower-income household archetypes saving the same amount or more than higher-income household archetypes, in terms of average impacts as a proportion of income over the transition period. Some differences exist in impacts for middle-income archetypes.
- Compared to their overall impacts before policy, once either policy package is applied, archetypes A1, A2, A4, and A6 see an increase in overall savings (over the period from 2025 to 2050), with minimal difference for archetype A5, while archetypes A11–A15 either see a small increase in overall costs or minimal difference (Figure 8.5). This is largely driven by the provision of grants for archetypes A1–A6 in both policy packages and the higher level of taxation assumed for higher-income households.
- Archetype A3 is an outlier to this trend as this archetype does not have a car and switches from a gas boiler to direct electric heating. As a result, this archetype does not benefit from a grant or savings in driving costs but faces higher running costs from direct electric heating. We assume only households who cannot install an individual or communal heat pump, or connect to a heat network, install direct electric heating.
- The policy packages differ in their effect on household archetypes A7–A10, with most of these archetypes seeing an improvement in overall costs and savings (over the period from 2025 to 2050) under policy package two, and the opposite under policy package one. Unlike in policy package two, under policy package one, middle-income households (archetypes A7–A10) do not receive grants and are assumed to borrow to fund upfront investments, at commercial interest rates.
Generally, household archetypes experience larger savings overall (over the period from 2025 to 2050) if they switch to a heat pump or electric car sooner (2025 to 2035) rather than later (2040 to 2050). This is the case under both policy packages, assuming they are implemented from 2025. However, there are some uncertainties around this, as we have not directly modelled second-hand car market dynamics.
| Figure 8.5 Change in costs and savings by sector, household archetype, and policy package (2025–2050) |
  |
 |
| Description: Under both policy packages that we model, most household archetypes save over the transition period (2025 to 2050) compared to a baseline of no further decarbonisation action, largely due to reduced transport costs. However, some outliers exist. Source: CCC analysis. Notes: (1) ‘ASHP’ stands for air source heat pump and ‘HP’ stands for heat pump. (2) The figure shows overall buildings and transport costs for 15 different household archetypes averaged over the period from 2025 to 2050 (as a proportion of income), with and without policy support. (3) The ’Before policy’ scenario is not a realistic scenario as households lack incentives to make changes, and is used as a comparator only. (4) Households face a mixture of costs and savings from buildings, and larger savings from transport, leading to savings overall. (5) Mileage labels reflect total mileage for each household, not mileage per car. |
8.3.5 Home energy use and transport: other characteristics
While the transition can bring net savings for most households, various factors drive different cost impacts for households beyond those discussed above (such as heating system and building type).
- EV uptake timing: higher-income households are assumed in the model to make the switch to electric cars earlier, as others wait for second-hand markets to develop. Early adoption of electric cars is expected to indirectly reduce costs for later adopters through supporting cost learning curves and growing the second-hand market for electric cars (although we have not explicitly modelled this). Continuing to drive a petrol or diesel car towards the end of the transition will be more expensive and could be challenging as petrol stations become less prevalent.
- Timing of switch to low-carbon heating: for low-carbon heating, we do not assume a link between timing of low-carbon heat installation and income. Policy choices will shape when different households switch. Households remaining on the gas grid in the late 2040s could experience higher bills if fossil fuels face additional taxes, as in policy package one.
- Access to off-street parking: charging electric cars at home is currently cheaper than charging on-street, with slow and fast charging on-street costing 56 p/kWh and 80 p/kWh compared to 25 p/kWh for home charging (and 8 p/kWh for off-peak charging).[502] In our model, we assume these costs fall with increased investment in EV charging networks. If this does not happen, costs would increase for archetypes without off-street parking (archetypes A4 and A5).
- Private rented sector: in our model, when a grant is available for a privately rented property, we assume only the residual investment costs are passed onto tenants, but when a grant is not available, the full investment costs are. This means we see no specific pattern in overall cost and savings for renters compared to owner occupiers. In practice, the exact impact of landlords investing in low-carbon technology on rent is uncertain. However, if landlords do not invest until late in the transition, private renters will experience higher total energy bills across the transition period – particularly under policy package one.
- Rurality: costs in our model are not directly affected by rural or urban location. However, rural households tend to drive more and live in larger homes with higher energy demand which is reflected in our archetypes.[503];[504] In general, rural households require larger upfront investment to decarbonise their homes due to greater need to install energy efficiency and high-power heating systems. Archetype A10 is rural, lives in a large home, and requires large upfront investment, but also receives larger savings once they have decarbonised.
- Access to energy flexibility: households who can shift energy demand to off-peak hours through changing habits or energy storage will be able to access cheaper electricity rates than those with inflexible demand. This incentivises households to reduce demand during peak hours. Certain groups may have less access to flexible demand (see Section 8.5).
- Other characteristics: there are other household characteristics such as age, disability, and ethnicity that may not directly impact costs but are likely to indirectly affect them due to secondary effects. This is discussed further in Section 8.5.
Policy options in addition to those modelled in the two packages discussed here include tailored support, such as support for low-income households, those taking up direct electric heating, and households with high capital investment requirements (such as some rural households).
8.3.6 Home energy use and transport: citizens’ policy package
An early version of our two policy packages was shared with our citizens’ panel, who reviewed the cost and savings impacts that the packages were estimated to have on five of the 15 household archetypes over time. Their feedback, and the policy package they then proposed, is set out in Box 8.1 below.
| Box 8.1 Policy packages in the citizens’ panel |
| The Committee convened a citizens’ panel to explore what an accessible and affordable vision of Net Zero looks like for households (see Section 8.2). Among other topics, the panel shared views on early versions of policy packages one and two and came up with their own preferred citizens’ policy package.
The vast majority (23 out of 26) of the panel thought that if this citizens’ policy package was implemented, the transition would be accessible and affordable for all households. The package was most similar to policy package two, but with adjustments. Adjustments included making home heating grants means-tested, including zero-interest loans and scrappage schemes for cars, and passing some costs on to energy companies. The citizens’ policy package was as follows: Means-tested tapered grants for home heating and energy efficiency available to almost all households, with low-income households receiving the largest grants and high-income households the smallest. In terms of trade-offs about who pays and who benefits, the panel: Was comfortable that more widely available grants meant higher costs elsewhere to fund this, generally suggesting higher general taxation. |
| Box 8.1 Policy packages in the citizens’ panel |
| The Committee convened a citizens’ panel to explore what an accessible and affordable vision of Net Zero looks like for households (see Section 8.2). Among other topics, the panel shared views on early versions of policy packages one and two and came up with their own preferred citizens’ policy package.
The vast majority (23 out of 26) of the panel thought that if this citizens’ policy package was implemented, the transition would be accessible and affordable for all households. The package was most similar to policy package two, but with adjustments. Adjustments included making home heating grants means-tested, including zero-interest loans and scrappage schemes for cars, and passing some costs on to energy companies. The citizens’ policy package was as follows:
In terms of trade-offs about who pays and who benefits, the panel:
|
8.4 Wider costs and benefits
We expect the transition to Net Zero to deliver improved health outcomes, through improved air quality, better insulated homes, increased active travel, and healthier diets. There will be some costs of time spent on home retrofits and public transport, and, if a rebound effect (increased driving as a result of lower driving costs of EVs) occurs, costs of congestion.
Quantified co-impacts are estimated to provide £2.4–£8.2 billion per year in net benefit by 2050, although this is a partial picture due to challenges in quantifying all co-impacts, and estimates are uncertain (Figure 8.6).[505] These quantified co-impacts are not included in our assessment of whole-economy costs (see Chapter 4).
- Cleaner air: the shift to low-carbon heating, electric cars, and modal shift will improve air quality, with knock-on impacts for health.
- The health benefit related to improvements in outdoor air quality (£2.7 billion per year in 2040) is the largest quantifiable co-impact of our pathway, due to the switch to low-carbon heating, electric cars, and modal shift.
- Air quality will improve significantly from switching to electric cars (which do not burn fossil fuels) and due to modal shift. While impacts will be widespread, they will be particularly felt in urban, densely populated areas, particularly benefitting low-income and marginalised groups (see Section 8.5). Pollution from tyres and brakes may marginally increase as a result of heavier electric cars, however, this is small relative to the savings from avoided fuel combustion.
- A switch away from heating systems that rely on burning fossil fuels also reduces indoor exposure to pollutants with potential health risks, although we have not quantified this impact.[506]
- Warmer and less damp homes: low-carbon heating and energy efficiency measures may also bring benefits such as improved thermal comfort and reduced fuel poverty, provided they are installed appropriately.
- Energy efficiency measures can reduce excess cold and dampness in homes and is expected to bring a net benefit of £650 million in 2040. If targeted towards low-income homes with poor energy efficiency, energy efficiency measures can also help to reduce fuel poverty (see Box 7.2.3).
- As low-carbon heating systems run on electricity, domestic energy bills should become more stable as electricity is increasingly powered by UK renewables and less exposed to volatile global gas markets (see Chapter 10).
- While most changes are beneficial, these measures need to be installed in homes, which can take time and effort. It is important installations are done properly and calibrated to specific building properties, otherwise there are health and comfort risks associated with inappropriate or poorly installed energy efficiency measures and noise, comfort, and cost risks associated with inappropriately installed heat pumps.
- Modal shift and reduced driving: provided there are improved public and active travel options, there will be more travel choice, with improved health outcomes from active travel. Whether a rebound effect (increased driving as a result of lower driving costs of EVs) occurs affects the extent to which all potential impacts are realised.
- Increased physical activity from increased cycling and walking will lead to improved health outcomes and is expected to bring a net benefit of £500 million by 2040. The biggest health benefits are achieved when people who are not already exercising frequently take up more walking and cycling.
- The main quantified cost is the increased travel time when shifting transport modes (for example shifting from driving to public transport), totalling £2.2 billion per year by 2040.
- If there is no rebound effect, there are further benefits relating to decreased road repairs, congestion, and improved road safety as a result of fewer cars on the road, although these estimates are uncertain. If there is a rebound effect in transport, co-impacts on congestion, road safety, and repairs could become negative. Overall, this could reduce the overall net benefit from quantified co-impacts to £2.4 billion (as opposed to £8.2 billion if no rebound effect is assumed) per year by 2050.
- A reduction in average meat and dairy consumption: this is compatible with a healthy and nutritionally balanced diet and has the potential to bring positive health impacts. The extent of health benefits will depend on what types of meat and dairy are replaced and what they are replaced with.
- We assume that meat and dairy is replaced by a mix of plant whole foods, existing plant-based alternative proteins, and later on more novel alternative proteins, with a large proportion of substitutions replacing processed meat and dairy products.[507] Each has a different health implication. Based on this combination of replacements, we estimate health impacts with a net benefit of £900 million in 2040, although this is uncertain.
- The biggest health benefits come from replacing meat with plant whole foods such as legumes and pulses, however, we assess that this will only happen some of the time. Current evidence suggests that where processed meats are replaced with processed plant-based alternatives, there is still on average a health and nutritional benefit.[508];[509] The nutritional and health impacts of more novel alternative proteins (such as those derived from technologies such as precision fermentation) will depend on their overall ingredients and processing methods, with potential positive nutrition and health impacts.[510];[511];[512]
- Negative nutritional impacts of a reduction in meat consumption only occur where a diet is unbalanced and meat products are not substituted at all, or meat products are substituted by foods with very low nutritional value. Negative nutritional impacts can be avoided by choosing from a large variety of substitution options that improve nutritional intake.[513];[514]
- Keeping flying close to today’s levels, until technology develops: the Balanced Pathway includes an increase in aviation demand compared to today’s levels, but less flying than there would be in the baseline of no further decarbonisation action.
- Some people will fly less in future than they would otherwise have done. Future aviation demand projections are uncertain, and in the Balanced Pathway flying continues close to today’s levels until technology develops.
- Aviation negatively impacts air quality and noise for those living near airports and busy flightpaths. New planes, such as hybrid and zero-emission aircraft, may help to reduce some of the negative co-impacts of aviation. The Committee has not analysed whether this will lead to a net improvement.
- Wider impacts: households may experience wider co-benefits beyond those relating to household low-carbon choices outlined above. For example, decarbonising industrial sectors and waste processing will bring further benefits in terms of reduced air pollution, while changes to land use (such as woodland creation) can provide health and wellbeing benefits through increased access to green space, as well as increased resilience to floods and storms.
| Figure 8.6 Quantified co-impacts in the Balanced Pathway |
 Description: The most significant non-financial impact of the Balanced Pathway that we have quantified is improved health as a result of cleaner air. Net positive impacts would be significantly lower if we assume that driving increases as a result of lower driving costs. Source: CCC analysis. Notes: Stacked bars show the total co-impact to society of the Balanced Pathway over time, by co-impact type. Lines show the total net co-impact with and without a potential rebound effect (increased driving as a result of lower driving costs of electric vehicles). Positive values represent a net benefit. |
8.5 Impacts on protected and vulnerable groups
Net Zero can provide benefits and opportunities for people across the UK, including cheaper energy for home heating and driving, new jobs, warmer homes, and cleaner air. However, policy is needed to ensure benefits are widely shared and people are not excluded.
In this section, we consider how different people interact with the Balanced Pathway in terms of access to measures and impacts of the pathway. While characteristics such as income and rurality are considered in the section above on distributional impacts, this section considers impacts on people with protected characteristics (for example age, ethnicity, and disability). This is in line with the Public Sector Equality Duty (PSED).[515]
8.5.1 Groups with protected characteristics
We have identified key areas for consideration based on magnitude of impact, number of people affected, and direct relevance to our pathway. These are outlined below and explored in further detail in our supporting research, Impacts on groups with protected characteristics.
The Net Zero transition provides opportunities to remove or reduce disadvantages suffered by people because of a protected characteristic, such as levels of fuel poverty, exposure to harmful levels of air pollution, barriers to workforce entry, and limited access to nature and green spaces.
- Home energy efficiency measures and reducing energy bills can reduce fuel poverty inequalities. Households with children, young adults, disabled people, and people from minority ethnic backgrounds are more likely to experience fuel poverty than other groups.[516];[517];[518];[519] Measures to insulate homes, reduce electricity prices, and switch to more efficient heating technologies could reduce fuel poverty and fuel poverty inequalities, if barriers to uptake are removed (see Section 2.1 in our supporting research, Impacts on groups with protected characteristics).
- Decarbonising transport and other industries can reduce air pollution inequality. Children, older people, and disabled people are at greater risk from the health impacts of air pollution, while minority ethnic groups are more likely to be exposed to harmful levels of air pollution.[520];[521];[522] Switching from petrol and diesel cars to EVs and other transport modes, as well as decarbonising buildings and industrial sites, is a significant opportunity to remove these unequal air pollution effects (see Section 2.4 in our supporting research, Impacts on groups with protected characteristics).
- New jobs and industries created by the Net Zero transition provide an opportunity to remove existing barriers to workforce entry. As outlined in our report A Net Zero Workforce, women, people from minority ethnic backgrounds, and disabled people face barriers to entry and are underrepresented in key Net Zero sectors such as agriculture, manufacturing, and energy.[523] The emergence of growing industries such as engineered removals, renewables, and woodland creation provides an opportunity to address existing barriers and create a diverse and inclusive workforce as new jobs are created (see Section 2.3 in our supporting research, Impacts on groups with protected characteristics).
- Restoration of woodlands and creation of urban green spaces can increase access for all. Minority ethnic groups and disabled people have less access to green spaces (public and private) compared to other groups in the UK.[524] Depending on policy design, creation of new woodlands and urban green spaces can improve access for these groups.
Attention is also required to ensure that the transition does not exacerbate existing inequalities. In particular, to ensure that changes to home heating and transport are accessible, and that a disproportionate burden is not imposed on disadvantaged people.
- Energy efficiency and low-carbon heating must be affordable and accessible. Decarbonising homes often requires installing measures at an additional upfront cost, with savings achieved in the longer term through lower bills. Access to capital varies by ethnicity.[525] People from minority ethnic backgrounds are also more likely to rent privately or socially and to live in flats, which have particular barriers to low-carbon heating installation.[526];[527];[528] Older and disabled groups can face both practical and financial barriers to installing home decarbonisation measures. Appropriate policy design is needed to avoid people being left behind in the transition and disproportionately exposed to volatile fossil fuel prices (see Section 2.1 in our supporting research, Impacts on groups with protected characteristics).
- Access to flexible tariffs must be considered. There is likely to be greater variation in hourly electricity prices as part of the transition. This will bring benefits accessible to those with flexible demand and access to smart tariffs. Older and disabled people can face greater digital exclusion, are more likely to need to maintain warm temperatures and/or need to run medical equipment.[529];[530] Minority ethnic groups are more likely to live in multigenerational households and may be less able to run appliances during off-peak times as they have previously been less likely to work from home.[531];[532];[533] These all reduce flexible energy use and risk increasing inequality.[534]
- Changes to driving and other transport modes must consider the needs of all users. Older and disabled groups face practical barriers to switching to EVs, public transport, or active travel.[535];[536] In addition, certain groups (for example, women and LGBTQ+ people) may be less willing to shift to public and active travel due to safety concerns.[537] Disabled and minority ethnic groups typically have lower incomes and less access to capital, meaning they will be more impacted by any increased costs of public transport, and without policy support could be more likely to be late adopters of electric cars, missing out on the benefits of lower running costs (see Section 2.2 in our supporting research, Impacts on groups with protected characteristics).[538];[539];[540]
- The overall effects for households, especially for disabled people, should be considered. While most changes are small in isolation, the combination of multiple changes may lead to unreasonable financial or mental burden for some people. For example, medical equipment users spend a larger proportion of their income on energy and water bills than the UK average, so small changes to utility prices could have disproportionate effects.[541];[542] Similarly, some people with learning disabilities or neurodivergence could face barriers to taking up new measures, so if multiple changes are required simultaneously this could prevent uptake and lead to unequal outcomes.
Government should consider how to include marginalised groups, improve accessibility, and provide outreach in its policy design. In our supporting research, Impacts on groups with protected characteristics, we set out some policy examples from other contexts. Key issues are:
- Address upfront cost barriers and avoid running cost increases for marginalised groups, to avoid exacerbating existing levels of inequality.
- Proactively consider accessibility in terms of practical barriers to uptake, technology accessibility, digital inclusion, and impacts of disruption.
- Provide targeted support and outreach where needed to ensure that everyone is included and able to participate in the transition, providing access to related cost savings and wider health, employment, and other benefits.
Chapter 9: Economy, businesses, and workers
Introduction and key messages
This chapter sets out the impact of the Balanced Pathway on the economy, businesses, and workers.
Our key messages are:
- Long-term GDP effects of the Net Zero transition are uncertain. GDP effects of Net Zero could be positive, as more efficient low-carbon technologies offer opportunities for productivity gains in some areas. Even if negative, they are likely to be smaller than the macroeconomic costs of unmitigated climate change.
- The transition will also make the UK economy more resilient, by reducing dependence on volatile international fossil fuel markets.
- Impacts will not be significant for most sectors. For a small segment of the economy, the impacts will be more acute in the short term and will need to be carefully managed.
- Most businesses and workers, particularly those in the UK’s service sectors, will see little change in activity beyond switching to low-carbon heating and vehicles.
- Some traded sectors where the UK has strengths could grow, such as green finance. Seizing these benefits requires rapid action and an environment conducive to investment, as other countries will also look to capture opportunities.
- A few industrial sectors will face additional costs to eliminate emissions. Government should ensure the right incentives are in place for these sectors to switch to low-carbon production. With the right policy in place, UK manufacturers could decarbonise early and take advantage of growing global demand for low-carbon goods.
- Production of oil and gas and livestock agriculture will reduce, with significant impacts concentrated in a small number of areas. Government needs to engage with business, trade unions, workers, and communities in affected areas to develop proactive, funded transition plans that enable attractive employment and business opportunities.
9.1 Economy-wide impacts
In this section, we assess the impacts of the Balanced Pathway at a whole-economy level. We base our assessment on published literature including economic modelling results and Climate Change Committee (CCC) costing analysis. See Chapter 4 for our assessment of whole-economy costs and fiscal impacts and Chapter 8 for co-impacts.
The most significant impacts of the Net Zero transition on the economy as a whole are likely to be felt through increased resilience to economic shocks, both from climate change itself and from fossil fuel price shocks.
9.1.1 Impact on GDP
Aggregate impacts of the Balanced Pathway on the level of GDP by 2050 are uncertain, but likely to be small, outside of greater resilience to economic shocks.
- We assessed a range of published estimates of GDP impacts from economic models of the UK’s transition to Net Zero. While precise GDP impacts vary and estimates are uncertain, they indicate that the macroeconomic impacts of Net Zero on GDP by 2050 are unlikely to be significant in either direction.[543];[544];[545];[546];[547];[548]
- In many, but not all, cases, low-carbon technologies will have lower running costs due to being more efficient and facing lower energy costs. This will have positive productivity effects. There will be some additional costs, especially upfront costs for low-carbon heating, and some technologies with higher running costs, such as carbon capture and storage (CCS).
- As set out in Chapter 4, we estimate that an average financing requirement of around £37 billion per year will be needed to deliver the Balanced Pathway.[549]
- Savings from more efficient low-carbon technologies begin to outweigh investment costs during the Seventh Carbon Budget period (2038 to 2042) and continue to grow towards 2050.
- Additional upfront capital investment in the short term may displace consumption elsewhere in the economy. The economic impact of this displacement will depend on what consumption is displaced.
- The UK has one of the lowest rates of investment in the Organisation for Economic Co-operation and Development (OECD), which has been identified as a cause of low productivity growth.[550] If the average financing requirement for Net Zero is added to existing levels of UK investment (assuming no displacement of existing investment), total UK capital investment would still be below the OECD average (22% in 2022).[551];[552]
- Changes in productivity and output at a sectoral level will be more varied (see Section 9.2), but at an aggregate level these impacts are unlikely to significantly affect GDP.
Impacts of the Balanced Pathway on UK GDP by 2050 will likely be smaller than the macroeconomic impacts on GDP of unmitigated climate change.
- The economic cost of climate change impacts to the UK is highly uncertain, and estimates vary depending on the extent of warming that takes place (see Chapter 1). However, if the UK and other countries fail to address climate change, the macroeconomic impacts on the UK could be high. Even with global warming limited to below 2°C, expected costs would exceed the anticipated costs of implementing Net Zero measures (see Chapter 4).
- The Office for Budget Responsibility (OBR) estimates that illustrative scenarios of climate change impacts at warming of just below 2°C and close to 3°C would decrease UK real GDP growth by between 1.8% and 2.1% in 2050 and between 3% and 4.4% in 2070.[553] These estimates do not include indirect impacts (such as premature deaths and supply chains) and so may be underestimates.[554]
- The Bank of England’s 2021 climate biennial exploratory scenarios estimated that 3.3°C of warming could result in a 7.8% decrease in GDP in the UK in 2050.[555] The Grantham Research Institute estimates costs at 3.3% of GDP in 2050 in the UK in a scenario where global warming reaches 3.9°C by 2100. Costs reduce to 2.2% of GDP in 2050 in a scenario of strong global mitigation action.[556]
- There is a high degree of uncertainty in estimates on global GDP impacts, and estimated impacts generally increase non-linearly at higher levels of warming, with much higher costs at higher levels of warming. The Intergovernmental Panel on Climate Change (IPCC) estimates a 10–23% climate change-caused decline in annual global GDP by 2100 under a high warming scenario, with statistical approaches pointing towards the upper end of this range. Recent actuarial assessments emphasise the risk that losses could be significantly higher than currently considered in decision-making.[557]
9.1.2 Impact on resilience
A reduction in the UK’s reliance on fossil fuels will reduce exposure to economic shocks which have historically had widespread negative impacts on the economy.
- Historically, the UK has been a net importer of fossil fuels for energy supply. Over the last 15 years, approximately 37% of energy supply was imported.[558] As fossil fuels are traded globally, changes to the price or supply of fossil fuels globally impact UK costs.
- This leaves the UK vulnerable to global energy price shocks. Demand for oil and gas is relatively price inelastic and used as an input for most economic production. Shocks to the price or supply of oil or gas therefore have widespread impacts. Past fossil fuel shocks have led to persistent inflation, requiring higher interest rates despite a slowing economy.[559] This can lead to persistence in the negative impacts of shocks.[560]
- Constraints on global crude oil supply led to prices rising nearly four-fold in 1974, falling and then increasing nearly three-fold in 1979.[561] This contributed, along with other factors, to recessions in the 1970s and early 1980s, with high inflation (peaking at 24% in 1975) and rising unemployment (peaking at 12% in 1984).[562];[563]
- In 2022, the invasion of Ukraine led to rising prices of wholesale gas and electricity in the UK.[564] The OBR has estimated that the average price of electricity, petrol, and gas in 2022 was around 20% higher than the inflation-adjusted peaks of the 1979 and 2011 to 2012 oil shocks, even after adjusting for the Ofgem price cap and the Energy Price Guarantee.[565] This triggered a rise in the cost of living in the UK and contributed to a recession, with one in ten firms reporting that they ceased operations in one or more of their businesses.[566]
- The OBR estimated that if gas price spikes occurred every decade, the cost to the Exchequer could be between 2–3% of GDP per year (when spikes occur). Taking account of debt interest and reductions in economic activity, this would result in an increase in public debt of 13% of GDP by 2050.[567]
- Although a higher reliance on variable renewable generation increases exposure to short-term weather fluctuations, security of supply can be ensured (via measures such as storable energy and other low-carbon flexibility options – see Section 7.5) and will result in reduced exposure to volatile gas prices compared to a high-carbon system (see Chapter 10).
9.2 Sectoral assessment
We have assessed the impacts of the Net Zero transition on businesses and workers at a sector level, grouping businesses based on emissions intensity and how the Balanced Pathway impacts their operations. We base our assessment on a review of published literature and economic data; our report on A Net Zero Workforce; the Balanced Pathway and cost analysis; and engagement with stakeholders. Our assessment is not comprehensive. Chapter 8 discusses impacts on households.
9.2.1. Businesses that are not emissions intensive
Provided there are incentives for businesses to adopt low-carbon technologies, most sectors of the economy will not face significant impacts from the transition. This applies to much of the services sector and some manufacturing sectors.
- Sectors comprising most of UK GDP, exports, and employment have low emissions intensity and most are not expected to see major changes to their operations.[568] There is a core set of actions businesses in these sectors can take to decarbonise.
- Service sectors make up around 80% of gross value added (GVA) and jobs in the UK economy (Figure 9.1) and 46% of UK exports.[569] They generally have low emissions intensity. Certain manufacturing sectors, accounting for about 4% of GVA and 23% of exports, have relatively low-emissions-intensity production, including pharmaceuticals, electronics, and machinery and equipment.
- Businesses in this group will need to adopt a core set of actions (Box 9.1) to decarbonise their operations, including switching to low-carbon heating and zero-emission vehicles, and avoiding non-essential business flights. This can generally be done without changing production processes. Where firms own buildings or vehicle fleets they will need to switch to low-carbon alternatives in line with normal replacement cycles, or earlier if cost effective.
- Workers in these sectors need not see significant changes to their occupation or skills requirements. For example, taxi drivers will switch to electric vehicles (EVs) with little change in day-to-day activities.
- The transport, freight, and logistics sector is currently emissions intensive, but can largely decarbonise through deploying EVs.[570] Charging infrastructure will need to keep pace with electrification of buses and heavy goods vehicles (HGVs). However, outside of replacing refuelling with recharging, the transport of people and goods will be largely unaffected. Current commercial demonstrations will need to establish the best approaches to make electric HGVs commercially viable for the heaviest goods, where heavier EVs may be constrained by slightly reduced payload capacity.
- Switching to low-carbon energy and technologies may bring additional upfront costs, but in many cases these will be offset by savings in running costs.
- EVs and low-carbon heating will be more physically efficient and often have lower running costs (see Section 7.1, Section 7.2, and Section 8.3).
- In some cases, the low-carbon technologies will be cheaper (such as electric cars and vans from the late 2020s) than the fossil fuel alternative. Where this is not the case, policy will be needed to ensure businesses have the right incentives to adopt low-carbon technologies, such as low-carbon heating and electric HGVs.
- There may be some additional costs for business flights and waste management, and manufacturers may face higher costs of shipping (see Section 7.6, Section 7.8, and Section 7.10).
- Some businesses and workers in these sectors are in a position to further enable the transition (Box 9.1), including through making low-carbon goods and services attractive and affordable. We estimate that about one-fifth of the workforce are employed in low-emission businesses with an enabling role (Box 9.4). Some businesses that have low emissions intensity may also grow as a result of the transition (see Section 9.2.2).
| Figure 9.1 Gross value added (GVA), employment, and proportion of businesses in different sectors of the economy |
 Description: Services make by far the largest contribution to the UK economy in terms of gross value added (GVA), employment, and number of businesses. Source: Department for Business and Trade (2023) UK business population estimates; Office for National Statistics (2024) Gross value added (balanced) by industry dataset. Notes: (1) Construction, energy supply, manufacturing, mining and fossil fuels, and farming, forestry, and fishing are all considered production sectors, with service sectors making up the rest of the economy. (2) GVA is 2022 data; employment and proportion of businesses are 2023 figures. This variation is due to data availability. |
| Box 9.1 The role of low-emissions-intensity businesses in delivering and enabling the Net Zero transition |
| In 2023, the British Chambers of Commerce convened an Advisory Group on Business for the CCC, to inform our understanding of how businesses can support the transition to Net Zero, provided the right conditions are in place. The conclusions of the Advisory Group are summarised in their report The Power of Partnership. The report recommended:
All businesses should reduce emissions.
Some businesses should look beyond their own footprint. Some businesses, such as large corporations, media, financial institutions, and technology providers, have additional levers to enable Net Zero.
Certain businesses may need additional support. More limited capacity in other companies, such as SMEs, means they require additional support from the Government and the rest of the private sector.[576]
|
9.2.2 Businesses with growing demand for low-carbon products and services
The transition to Net Zero will increase demand for low-carbon technologies, as well as services and supply chains which enable their delivery and maintenance. This presents new commercial opportunities for the UK in some traded sectors in which it is specialised or could become specialised in future. Capturing these benefits requires effective policy to ensure early adoption, as the UK is not the only country which will be looking to seize these opportunities.
The transition will also create employment opportunities in non-traded areas, such as heat pump installation, creating job opportunities across qualification levels, across the country. Around one-tenth of the current workforce are in non-traded sectors that will grow as a result of the UK transition.[577]
High-value traded services
The UK is particularly specialised in high-value traded services such as finance, consulting, and engineering. It is well placed to capture a growing international market for applying these services to enable the low-carbon transition.
- The global Net Zero transition creates opportunities for UK financial services that facilitate investment into low-carbon projects.
- The value of global green finance (bond issues, initial public offerings (IPOs), and private equity investment) grew from $5.2 billion in 2012 to $540.6 billion in 2021.[578]
- London is recognised as the number one global financial centre for green finance, while Edinburgh also features in the top 20.[579]
- Opportunities are likely to develop in other high-value service sectors. The UK is well-placed to capture market share in these new markets, provided it acts quickly to develop expertise.
- For example, managing supply and demand of a decarbonised, predominantly renewable, electricity system will require expertise in digital services, flexible grid management, and market design.
- The UK is more specialised in services exports than many of its typical comparators, including the United States, France, and Germany. It is the second largest exporter of services in the world.[580];[581]
Traded low-carbon goods
The UK is also specialised in manufacturing certain traded goods which could be involved in the production of low-carbon technologies for UK and international markets. Many of these manufacturing strengths are spread across the country, providing an opportunity for local growth and jobs.
- Around half of the products where the UK has a revealed comparative advantage (RCA) of greater than one have potential applications in producing low-carbon goods (Figure 9.2).[582] This includes the following:
- Specialisms in manufacturing vehicles, aviation, and other transportation equipment indicate the potential of transitioning to produce low-carbon vehicles, such as EVs and lower-emission aircraft.
- Manufacturing equipment such as pumps, pipes, and measurement and control equipment have potential applications in low-carbon technologies such as heat pumps, energy networks, and carbon capture and storage (CCS).
- Wider literature has identified UK clean technology specialisms in sectors such as offshore wind; carbon capture, utilisation, and storage (CCUS); biomass and bioenergy; and nuclear. The global transition to Net Zero is expected to create export opportunities in these sectors.[583];[584]
- The UK could also benefit from developing new industries, either where those are sufficiently similar to existing strengths or where there is a strategic case for domestic supply chains.
- The UK’s access to promising CO2 storage sites off the coast of the UK in the Irish and North Seas, and its experience in offshore oil and gas production, make it well placed to establish CCS capabilities, which some estimates indicate could unlock up to £5 billion worth of exports by 2050.[585];[586];[587]
- Developing domestic supply chains for key low-carbon technologies such as wind turbines, heat pumps, batteries, and critical minerals could create manufacturing opportunities in areas of the UK which have a rich industrial heritage.
- With the more than doubling of domestic electricity supply needed to 2050, renewables and nuclear power could create over 50,000 direct jobs by 2030.[588];[589] Surplus low-carbon electricity could also be exported or used to produce green hydrogen.
- Production techniques used in fermentation and biotechnology could be transferred to producing alternative proteins – an industry which some estimates indicate could be worth up to £6.8 billion annually and create 25,000 jobs by 2035.[590]
- Whether traded low-carbon technology sectors grow is uncertain and depends on the wider business environment and policy decisions. For example, some literature suggests that opportunities in the vehicle manufacturing sector depend on battery cell manufacturing also locating in the UK.[591] Manufacturers will need to continue to adapt to the transition to EVs for both domestic and international markets for the UK’s car industry to remain globally competitive (see Box 7.1.2).
Non-traded sectors
Employment in some non-traded service sectors, such as home retrofit and woodland creation, is expected to increase. Because the UK as a whole already operates at a high rate of employment, this will not significantly impact economic growth. Employment opportunities are likely to shift people between different non-traded service sectors. This may pose a delivery challenge in terms of the availability of skilled workers. However, particularly in areas with lower proportions of highly skilled employment, opportunities for relatively skilled jobs with long-term prospects in some key low-carbon services could support local economic growth.
- Demand for workers to install heat pumps and energy efficiency retrofits is expected to grow substantially. We previously estimated that 120,000 to 230,000 jobs could be created by 2030, but this was based on higher rates of energy efficiency roll-out, so numbers will be lower.[592]
- Opportunities are expected to be geographically dispersed across the UK. Ensuring workers are upskilled and available in the right place at the right time will be key to meeting this demand.
- Demand for forestry workers could create 7,000 to 37,000 new jobs by 2030 to meet tree planting ambitions, while peatland restoration and hedgerow planting could create a small number of additional jobs by 2030.[593];[594]
- Forestry jobs will be geographically dependent on regional forest cover and tree species, but are likely to be more prevalent in areas with existing labour market challenges.[595];[596] Some of these jobs could be delivered by those currently employed in agriculture, although it will not be a like-for-like replacement and not all agricultural workers will want to make the switch (Box 9.2).
- We estimate that around one-tenth of the workforce is in a sector that will need to grow domestically for the UK to reach Net Zero (Box 9.4).
| Figure 9.2 UK manufacturing specialisms with potential applications in producing low-carbon technologies |

|
 Description: Current trade data indicate that the UK has a revealed comparative advantage in manufacturing a number of products with potential low-carbon applications, including transport equipment, machinery, precision equipment and pumps, primary materials and chemicals, and production techniques (for example, for low-carbon fuels or alternative proteins). Source: United Nations Trade and Development (2023) Statistics on international trade. Notes: Revealed comparative advantage (RCA) is a measure of the relative contribution to exports from a given activity in a given country (in this case, the UK) compared to the global contribution to exports from that activity. An RCA score greater than one – shown with a red dashed line in the chart – indicates that a country has a relative advantage in exporting in this category. We have filtered to include here only products which have a potential low-carbon application and where the UK has an RCA score of greater than one. |
|
9.2.3 Emissions-intensive businesses
Transformation of carbon-intensive industries
The UK’s most carbon-intensive industries face a fundamental transformation to decarbonise their production processes, which will involve some additional upfront and running costs.[597]
- There has been a structural shift since 1990 towards less carbon-intensive but higher-value industrial output in the UK, such as pharmaceuticals and aerospace. Our pathway assumes that the current mix of UK industrial output remains broadly the same until 2050.
- The UK’s most carbon-intensive industries are those producing metals, minerals (cement, glass, and ceramics), and chemicals (such as petrochemicals).[598] They account for around 1% of UK GVA.[599] They account for a small share of jobs in the manufacturing sector, which overall makes up 9% of UK employment, but a higher proportion in certain regions.
- Measures to decarbonise these industries include electrification (such as all-electric glass furnaces) and CCS, which can bring high upfront costs and, under current electricity prices, increased running costs.
By decarbonising early, UK manufacturers will be well-placed to take advantage of growing global demand for low-carbon goods in the long term. This requires a supportive investment environment.
- Final demand for products is likely to shift to low-carbon variants, particularly if governments start to introduce regulations, product standards, or carbon border adjustment mechanisms (CBAMs) to ensure a level playing field. Moves in this direction are already happening in some markets, in particular the European Union.[600]
- Industrial decarbonisation, combined with rapidly decarbonising electricity supply, presents an opportunity for carbon-intensive sectors to access a growing market for low-carbon products. UK providers could become more competitive in these industries, provided they capture an early mover advantage by investing in new low-carbon technologies.
- However, this is dependent on a range of factors and requires available finance and incentives to address transition costs. Ensuring the price of UK electricity becomes more competitive is a priority. See Section 7.3 and Section 9.2.5.
There is a risk that domestic production is uncompetitive in the short term as it transitions, which needs to be mitigated through policy.
- The low-carbon product variants that primary industries will shift towards will in some cases be more expensive to produce, although this may fall with further innovation over time. As discussed in Chapter 10, policies such as product standards and CBAMs can ensure low-carbon variants are purchased in the UK.
- Consumers do not typically buy products such as cement or steel. Instead, these form part of final products, such as buildings or cars. These intermediate products tend to only make up a small proportion of the cost of final products, meaning consumers will not see a large change in the price of the end product.[601]
Employment in energy-intensive manufacturing will largely depend on the maintenance of competitiveness.
9.2.4 Businesses facing reduced demand for high-carbon goods and services
Output in the livestock, dairy, oil, and gas industries will decline. Government needs to work with affected communities to develop transition plans now, with a distinct approach for geographically concentrated employment impacts. It must manage change rather than failing to plan, which would simply lead to sharper adjustments later. Affected communities should not be left to fend for themselves, as has sometimes occurred to other communities during previous economic changes.
Livestock agriculture
Livestock farmers are already contending with the impacts of climate change on incomes, in an industry where, without subsidies, many businesses run a loss. The transition will see an overall decline in livestock herd sizes, with impacts on livestock farming and downstream businesses such as abattoirs. Farmers will need help to diversify their incomes and to adapt to climate change.
- Farmers and land managers are stewards of the land and will play a crucial role in delivering the transition. The Balanced Pathway sees an acceleration in the reduction of livestock numbers and release of land from agricultural use, with a reduction of 38% in cattle and sheep numbers between 2023 and 2050.
- Livestock agriculture represents less than 1% of GVA and employment in the UK.[606];[607];[608];[609] However, agriculture has wider importance for the rural economy, communities, and culture, with jobs geographically concentrated.[610]
- Some businesses in the sector are highly reliant on subsidies to maintain viability. The Farm Business Survey indicates that the basic payment scheme comprised over half (62–73%) of grazing livestock farm net income and a quarter of dairy farm net income in 2023 in England, although this varies by farm.[611]
- Not all livestock farmers need to be affected by the transition and a substantial livestock agriculture industry will remain. Some changes in land management may coincide with when farmers choose to retire. Three in ten farmers are currently 65 years or older.[612] Some farmers will need to be supported to diversify their incomes, for example through renewables or alternative land management practices (such as woodland creation and peatland restoration).
- The Committee’s rural land use archetypes project found that of the 16 archetypes modelled as moving away from agricultural production, all delivered an uplift in net private and social benefits by 2050, typically ranging from £500 to £1,500 per hectare, although most did not deliver a private net benefit.[613] This indicates government financial support will be needed to ensure appropriate incentives and returns for farmers.
- As with carbon-intensive industrial sectors, there may be a case for measures at the UK’s border to ensure changes in agricultural production do not simply lead to imports of high-carbon meat and dairy. The Balanced Pathway includes a reduction in average UK meat and dairy consumption, which is needed to avoid a reduction in UK livestock numbers being accompanied by an increase in imported meat and dairy.
- We met with farmers across Northern Ireland, Scotland, Wales, and England (Box 9.2), who highlighted their experience of weather-linked climate change impacts, emphasised the need for sufficient incentives, and shared concerns about a reduction in UK livestock numbers resulting in higher meat and dairy imports and around potential impacts on jobs and communities.
| Box 9.2 Case study: food production in Norfolk |
| This case study is intended to illustrate how some sectors may need to adapt and how new industrial opportunities might emerge from the transition. The alternative protein market is used as an illustrative example of a sector with potential to grow – we do not assess how its potential compares to other industries.
The transition in agriculture and diets presents both risks and opportunities to UK businesses. Livestock farmers face some reduced demand for their products, while some farmers have new opportunities in land stewardship. In our pathway, we assume a reduction in meat and dairy consumption is enabled partly by an increase in the availability of alternative proteins (alongside fruit and vegetables) – a market which could support new jobs and industrial opportunities in the UK.[614] To better understand these risks and opportunities, we reviewed published evidence and met with stakeholders across the UK including Norfolk, a significant agricultural region which is also home to a community of alternative protein researchers and companies.[615];[616] Farming Discussions with farmers (mixed, livestock, and nature-restoration) in Norfolk highlighted:
Alternative proteins A desk-based review, along with discussions with researchers and companies in the alternative proteins sector at the John Innes Centre in Norwich, highlighted:
|
Oil and gas
Employment in the oil and gas sector is already projected to fall as North Sea oil and gas reserves continue to decline.[626];[627] Net Zero could accelerate this transition.
- The Balanced Pathway involves a steep decline in the consumption of oil and gas, reducing by 84% and 77% from 2025 levels respectively by 2050. Oil and gas fields in the North Sea are already mature and declining in output, with a 75% reduction in output since 1999 and a further 85% reduction projected by 2050.[628]
- This means that a transition for the sector will need to be addressed regardless of Net Zero, and a reduction in fossil fuel demand will primarily reduce oil and gas imports rather than North Sea oil and gas production (see Section 10.2).
- The sector comprises 1% of GVA and less than 1% of employment in the UK.[629];[630] However, the industry is concentrated in places such as Aberdeen and Shetland where impacts will be more acutely felt. Many workers from these sectors have highly transferrable skills to new low-carbon markets such as offshore wind, hydrogen, and CCS.[631];[632] Low-carbon energy supply could create more job opportunities than the fossil fuel industry will lose in the next decade.[633]
- Discussions with stakeholders in Aberdeen (Box 9.3) highlighted the need for decisive policy to support a transition to new low-carbon offshore industries while minimising adverse impacts on affected workers and communities. Workers require clarity so they can have confidence that secure jobs are coming, and in some cases are already available (for example, in electricity transmission).
| Box 9.3 Case study: Aberdeen and North East Scotland |
| Irrespective of Net Zero, the UK oil and gas industry faces a transitional period as oil and gas reserves decline. We conducted a review of the risks and opportunities the transition poses to Aberdeen, and joined Scotland’s Just Transition Commission’s discussions with communities, trade unions, and industry in Aberdeen.
Oil and gas has been a key part of the local economy for decades, alongside other industries.
The transition to Net Zero presents emerging opportunities. These are in low-carbon offshore industries for Aberdeen, and jobs in electricity network development and onshore wind.
Realising these low-carbon opportunities while supporting those most affected by the decline of oil and gas requires a clear strategy. This should include ambitious policy and sustained engagement with the local community.
While low-carbon industries present an opportunity for workers, Aberdeen’s economic development must take into account the needs of the local community. Research has found a desire for more diversity in future jobs and supporting the different needs of younger and older workers. Benefits could be more evenly distributed than has been the case with oil and gas, with Aberdeen having one of the highest income inequalities of any city in the UK.[655];[656];[657] |
9.2.5 Policy implications
There are both risks and opportunities for the UK in the low-carbon economy. To maximise the opportunities, government should pursue consistent policies to reach Net Zero and establish a business environment conducive to investment. Minimising risks involves acknowledging the changes that will happen and acting early where communities and workers may be adversely affected to identify and promote alternative sources of economic activity. Policy measures will also be needed to mitigate the risk of carbon leakage.
Supporting workers and skills
Workers are vital to delivering Net Zero (Box 9.4), and an active strategy is needed to ensure opportunities are taken to safeguard workers and communities. This will be particularly important in the few locations where there are high concentrations of workers in industries that will decline. The key actions that are needed are as follows:
- Publish a Net Zero skills action plan to identify and address barriers to enable growth of the workforces needed to deliver the Net Zero transition.
- Almost one-tenth of the UK workforce are in sectors that will need to grow in order to deliver the Net Zero transition (Box 9.4), including home retrofit, peatland restoration, woodland creation and management, and electricity supply.[658] To deliver the deployment trajectories in the Balanced Pathway, some of these sectors will require a rapid increase in employment.
- While shortages are seen at a sectoral level, some are caused by a more fundamental shortage of specific skills at a trade or occupational level, such as engineers, electricians and welders.
- Policy certainty can signal to the labour force the value in upskilling or reskilling. More proactive skills policy may be needed in particularly acute areas, such as where the skilled workforce needs to grow rapidly, where businesses are typically very small (for example, sole trader boiler installers), or where there is limited confidence in future employment opportunities.
- It will be important that new jobs are attractive, with good salaries and terms and conditions, to attract suitably skilled workers. For some workers, the opportunity to work in low-carbon sectors may itself be attractive.
- Particular groups face increased barriers to entering these sectors, with women and workers from minority ethnic backgrounds underrepresented in almost all sectors expected to grow as part of the transition. This is explored further in our supporting research, Impacts on groups with protected characteristics.
- Work with communities, workers, and local businesses in areas of the economy that may be adversely impacted by the Net Zero transition to develop proactive transition plans that enable access to secure employment and business opportunities. These efforts should feed into local or regional plans.
- While the overall impact on the economy will be small, Net Zero will mean more significant changes at a local and regional level in a small number of places. In particular, some rural communities and areas with high concentrations of oil and gas-related employment could see significant changes and will require tailored support.
- In these areas, government, communities, workers, and local businesses should work together to identify alternative economic opportunities that match the specific strengths of each place, feeding into local or regional plans. It will be vital to develop approaches in good time, rather than attempt to deny that change is happening, leaving it too late to develop alternatives. Workers and communities affected by the transition must be meaningfully represented in developing proposals.
- Positive lessons can be learnt from the handling of the closure of Ratcliffe-on-Soar coal power plant, where staff were given advance warning, trade unions were meaningfully involved, and staff were supported with opportunities to retrain or redeploy.
| Box 9.4 Net Zero workforce |
|
In 2023, we published our report A Net Zero workforce, which assessed the implications for the workforce in delivering Net Zero. Full details can be found in the report, but the key findings were as follows:
|
Promoting investment
The UK is not the only country seeking to capture gains from the low-carbon economy. Many UK-based firms, especially in capital-intensive sectors, are also part of wider multinational businesses that will allocate investment across a range of sites in different countries. If the UK is to succeed in the future low-carbon economy, it needs to have a business environment conducive to investment. The key actions that are needed are as follows:
- Set out how government will support businesses to make the transition to low-carbon production or operation and how UK businesses could decarbonise early and take advantage of growing global demand for low-carbon goods and services.
- Clear and consistent long-term policy signals are needed to provide businesses and workers with confidence to invest and prepare for a low-carbon future. Without this, businesses may invest elsewhere.
- Even where the UK has an apparent advantage in producing goods today, that will not automatically translate to low-carbon equivalents in the future. The UK needs to be strategic about which low-carbon manufacturing sectors to develop.
- Strengthen the UK Emissions Trading Scheme (UK ETS) to ensure that its price is sufficient to incentivise decarbonisation. This could include a higher carbon price floor and/or linkages with the EU ETS.
- Speed up the grid connection process to ensure businesses do not face barriers to moving to electric options, including electrification of industry and HGV depots.
- Develop business models to support industrial electrification, ensuring businesses are incentivised to switch to electric technologies and complementing the UK ETS. This should play a similar role to existing business models for hydrogen and CCS in helping speed up early-stage deployment of electric technologies.
Avoiding carbon leakage
Carbon leakage is where domestic industries face additional costs from decarbonisation causing them to be replaced by products made overseas – both in domestic and export markets.
The Committee has previously assessed the risk of carbon leakage in depth and found the exposure to be concentrated in energy-intensive traded sectors and the potential impact to be varied.[659] We now assess the risk to also include livestock agriculture. The Government assessed the effect of carbon pricing on the output costs of energy-intensive sectors and found the impact to be relatively modest for most (noting the illustrative nature of the assessment).[660]
While exposure is relatively limited, there are material risks in the short term for certain sectors, which need to be mitigated through policies such as establishing a CBAM and mandatory product standards (see Chapter 10). The key actions that are needed are as follows:
- Consider expanding carbon border adjustment mechanisms. The UK CBAM could be expanded in scope, although there are limits to what it can achieve in isolation. It may be possible to extend it beyond primary products to finished goods over time as accounting frameworks develop. There remains potential for the inclusion of certain emissions-intensive products, for instance beef, if barriers related to including sectors outside the UK ETS can be overcome.
- Set minimum standards for the whole-life carbon impact of products. These should focus on products that are at risk of increasing the UK’s imported emissions.
Chapter 10: International implications and energy security
Introduction and key messages
This chapter discusses the Balanced Pathway in an international context. It considers how the pathway contributes to global agreements to mitigate climate change, what it means for the UK’s energy system and energy security, and how to ensure that the UK’s imported emissions also fall.
Our key messages are:
- The Balanced Pathway represents a fair and ambitious contribution to global efforts to tackle climate change. It is a credible contribution towards limiting long-term global warming to the 1.5ºC benchmark referenced in the Paris Agreement.
- The UK should plan to meet the Seventh Carbon Budget without using international credits. UK domestic emissions reduction should be complemented by strong contributions to international efforts, supporting global action on climate through all available avenues.
- The Balanced Pathway represents a shift to an economy that is more energy secure and less extractive. Demand for oil and gas falls substantially, resulting in much lower levels of imports and leaving the UK less exposed to fossil fuel price shocks.
- The 2050 energy system will be built on homegrown low-carbon electricity, with more efficient technologies resulting in much less energy being wasted than today. Scaling up global reserves and domestic recycling capability will ensure that the critical minerals required to deliver this can be provided.
- Emissions from imports constitute a significant part of the UK’s contribution to climate change. Alongside carbon budgets covering territorial emissions, the Government should introduce a non-legally binding benchmark against which emissions from imports can be monitored and should identify priority sources and policy levers to reduce imported emissions.
10.1 How the Balanced Pathway fits in an international context
10.1.1 Reflecting the international context in the Balanced Pathway
Putting the Paris Agreement principles into practice
Chapter 1 sets out the background to the Paris Agreement, its goals related to reducing emissions, adapting to climate change, and scaling up finance, and the mechanisms to support their delivery. In particular, the Paris Agreement requires Parties to produce plans to reduce national emissions in the form of Nationally Determined Contributions (NDCs) and a Long-Term Low Emission Development Strategy (LT-LEDS).
- NDCs should include short- to medium-term emissions reduction targets while an LT-LEDS should set out a Party’s long-term mitigation objectives and strategy to deliver them.
- The UK’s first NDC to 2030 was submitted in 2020, and the headline target for the UK’s 2035 NDC was announced at COP29 in November 2024 (Box 10.1). It submitted its Net Zero Strategy as its most recent LT-LEDS in 2021.[661]
Among other factors, the Climate Change Act prescribes ‘circumstances at…international level’ as matters to be taken into account in the Climate Change Committee’s (CCC) advice on, and the Government’s setting of, carbon budgets. The United Nations Framework Convention on Climate Change (UNFCCC) and the Paris Agreement are the core drivers of international circumstances on climate action.
The Paris Agreement and subsequent COP decisions set out several principles to which Parties’ mitigation efforts – in particular their NDCs – should adhere. Here we set out those principles and how the Balanced Pathway relates to them. For clarity, this section presents each principle separately, noting that there are overlaps between them such that considerations presented against one may apply equally to others.
- Highest possible ambition: called for in the Paris Agreement, each Party’s successive NDC should be a ‘progression’ beyond its previous one (reflecting a ‘ratchet’ of ambition over time) and should reflect its ‘highest possible ambition’ to reduce emissions.
- The Balanced Pathway reflects the UK’s ‘highest possible ambition’ that can be achieved under a deliverable pathway to Net Zero. The pathway is driven by an assessment of a stretching but deliverable rate of technological roll-out, based on existing and developing technologies, as well as evidence on the highest achievable levels of sustained household and business choices to reduce demand for high-carbon activities (see Chapter 2).
- Common-but-differentiated responsibilities and respective capabilities in the light of different national circumstances: this principle provides formal recognition that, while all countries have responsibility to take actions to support the global goal, developed countries (which are generally wealthier and have contributed more to past climate change) should take a lead. Similarly, the capability to reduce emissions depends on wealth, development needs, and country-specific sources of emissions.
- In following the Balanced Pathway, emissions reductions in the UK would be towards the top end of the range of emissions reductions committed to, or being considered by, comparable economies (Figure 10.1).
- Over 90% of the global economy is now covered by some form of Net Zero pledge, though these vary in terms of formality and scope.[662] All G7 economies have all-greenhouse gas (GHG) Net Zero targets for 2050 or sooner.[663];[664]
| Figure 10.1 The Balanced Pathway compared to planned emissions reductions in G7 economies |
 Description: Across the years 2030, 2040, and 2050, the Balanced Pathway implies emissions reductions for the UK that are broadly in line with the ambitions of other G7 economies. In 2030, implied UK emissions reductions are larger than other G7 economies on a 1990 baseline, but smaller on a 2022 baseline. Source: United Nations Framework Convention on Climate Change (2024) National Inventory Submissions 2024; European Environment Agency (2024) EEA greenhouse gases — data viewer; CCC analysis. Notes: (1) The above charts include targets (and proposals) as of December 2024. (2) The European Commission has recommended that the European Union (EU) reduces its emissions by 90% by 2040 compared to 1990; this is not yet formalised as the EU’s target. (3) The United States, Japan and Canada do not have 2040 targets set or formally proposed. (4) For simplicity, emissions reductions shown apply nominal percentage reduction targets to historical net GHG emissions from latest inventories, while in some cases countries may use alternative accounting approaches. (5) Where targets include a range, the mid-point is used. (6) The UK Balanced Pathway includes emissions from international aviation and shipping and is therefore not directly comparable to the UK’s submitted and announced NDCs. |
- Best available science: highlighted in various contexts in the Paris Agreement, notably the need to undertake rapid emissions reductions after peaking, climate action should be informed by up-to-date scientific evidence and analysis. The Balanced Pathway follows the latest science from the Intergovernmental Panel on Climate Change (IPCC), including for emissions accounting practices, and authoritative developments since. The pathway is based on an up-to-date assessment of mitigation potential, costs, and behaviour changes across technologies and sectors.
- Alignment with 1.5ºC: the Paris Agreement long-term temperature goal references two levels of warming: well below 2ºC and 1.5ºC above pre-industrial levels. In recent years, advancing science has shown increasing risks resulting from exceeding 1.5ºC, which has been recognised in multilateral forums. The first Global Stocktake, which concluded at COP28 in Dubai, encouraged countries to submit NDCs with ‘ambitious, economy-wide emission reduction targets … aligned with … 1.5°C’.[665] The Balanced Pathway represents a credible contribution towards limiting warming to 1.5ºC.
- As a developed country, the UK should reduce emissions faster than the global average. The Balanced Pathway implies reductions in UK GHG emissions at least as fast as the global average under 1.5ºC scenarios, on various baselines (Table 10.1).
By the Seventh Carbon Budget period, UK emissions per capita would be below the global average in cost-effective 1.5ºC scenarios (Figure 10.2). These conclusions relate to comparisons with globally cost-effective 1.5ºC scenarios with ‘no or low overshoot’, with action beginning in 2020, as synthesised in the IPCC’s Sixth Assessment Report (AR6).[666]
Given that global emissions have not fallen in line with these scenarios since 2020, the challenges of aligning with these global scenarios in future are growing. In contrast, the UK has delivered on its targets to date, albeit that these were aligned with an 80% reduction by 2050 rather than Net Zero, and faster progress is needed to deliver on future targets.
- The reductions implied by the Balanced Pathway in 2040 are within the range of an illustrative set of equity metrics (Figure 10.3). These metrics – reflecting several interpretations of a country’s equitable contribution – are often interpreted to reflect a country’s global contribution, not just their domestic emissions pathway. The ranges for metrics aligned with 1.5ºC and well below 2ºC emphasise the need for the UK to continue to make a broader contribution than domestic mitigation alone (see Section 10.1.2 and Section 10.3).
- Action within sectors is aligned with, or ahead of, global benchmarks consistent with 1.5ºC. For example, unabated coal power was phased out in 2024 in the UK compared to 2030 on average in advanced economies in a global 1.5ºC scenario, while electric and plug-in hybrid vehicles make up 100% of new car and van sales by 2030 in the Balanced Pathway compared to 2035 globally in a 1.5ºC scenario.[667]
| Figure 10.2 UK GHG emissions per capita in the Balanced Pathway compared to global scenarios |
 Description: UK emissions per capita have historically been higher than the global average, but in the Balanced Pathway, these fall below the global average in well below 2ºC scenarios in the 2020s and 1.5ºC scenarios in the 2030s. Source: Office for National Statistics (ONS) (2024) Population estimates time series dataset; ONS (2024) Principal projection – UK population in age groups; Byers, E. et al (2022) AR6 Scenarios Database hosted by IIASA (International Institute for Applied Systems Analysis); CCC analysis. Notes: (1) 1.5ºC and well below 2ºC scenarios shown relate to C1 and C3a scenario sets in the Intergovernmental Panel on Climate Change’s Sixth Assessment Report respectively for all GHG emissions (including emissions from international aviation and shipping). (2) Ranges shown are 5th-95th percentiles, as presented by the IPCC but distinct from the ranges shown in Figure 1.2. (3) These global scenarios imply least-cost pathways with action in most cases starting in 2020. (4) The global scenarios show five-yearly data, interpolated linearly in between, and generally do not reflect inter-annual variability to the extent caused by the COVID-19 drop in emissions in 2020. |
| Table 10.1 Comparison of UK ambition with IPCC global emissions scenarios consistent with the Paris Agreement |
|||
|---|---|---|---|
| UK Balanced Pathway | Global average – 1.5ºC scenarios | Global average – well below 2ºC scenarios | |
| % change 2010–2040 | -83% | -66% (-53% to -89%) | -41% (-27% to -59%) |
| % change 2019–2040 | -78% | -69% (-58% to -90%) | -47% (-34% to -63%) |
| Source: Byers, E. et al (2022) AR6 Scenarios Database hosted by IIASA (International Institute for Applied Systems Analysis); CCC analysis. Notes: (1) 1.5ºC and well below 2ºC scenarios shown relate to C1 and C3a scenario sets in the Intergovernmental Panel on Climate Change’s Sixth Assessment Report respectively for all GHG emissions (including emissions from international aviation and shipping). (2) Ranges shown in brackets are 5th-95th percentiles. (3) These global scenarios imply least-cost pathways with action in most cases starting in 2020. |
|||
| Figure 10.3 2040 ambition implied by the Seventh Carbon Budget compared to an illustrative set of equity metrics |
 Description: Equity metrics imply a wide range of ambition for the UK. The Balanced Pathway in 2040 implies ambition towards the top end of the range for well below 2ºC metrics and in the lower-middle of the range for 1.5ºC metrics. Source: Robiou du Pont, Y. et al (2017) Equitable mitigation to achieve the Paris Agreement goals; CCC analysis. Notes: (1) The fair share metrics shown exclude emissions from international aviation and shipping (IAS); the Balanced Pathway is therefore shown excluding emissions from IAS for consistency. (2) These metrics are based on historical global scenarios which generally assumed cost-effective global action from 2010 or 2015 – the latest at the time the Paris Agreement was negotiated. While more up-to-date scenarios are now available, there is merit to maintaining a historical view of required action in the context of equity. |
| Box 10.1 Our advice on the UK’s 2035 NDC |
| As the Paris Agreement was negotiated after the Climate Change Act was passed, the Act does not give the Climate Change Committee a statutory role in advising on NDCs. Nonetheless, for both the 2030 and 2035 NDCs, the UK Government has requested the Committee’s advice.[668];[669] Following the Government’s request, in October 2024, the Committee wrote to the Secretary of State for Energy Security and Net Zero recommending that the UK commit to reduce territorial greenhouse gas emissions by 81% from 1990 to 2035 in its next NDC, excluding emissions from international aviation and shipping (IAS).[670] This recommendation was based on the Balanced Pathway set out in detail in this report and is consistent with the delivery of existing targets, including the 2030 NDC and the Sixth Carbon Budget. At COP29 in Baku, Azerbaijan, the Prime Minister announced the UK’s intention to submit an NDC in line with the Committee’s advice.[671] The UK’s 2030 NDC, whose format is expected to be the model for the 2035 NDC when formally submitted, has various important differences to carbon budgets:
Source: UK Government (2024) UK 2035 Nationally Determined Contribution; Climate Change Committee (2024) Letter: Advice on the UK’s 2035 Nationally Determined Contribution (NDC). |
10.1.2 UK action to support the global transition
UK action to support the global transition to Net Zero must go beyond domestic emissions reduction. The following should all be considered:
- The domestic transition as a global contribution: the actions required to implement the Balanced Pathway can accelerate progress internationally. Reaching key milestones, such as a low-carbon power system, can demonstrate feasibility to countries at an earlier stage in their transition. Investment in low-carbon solutions can help to bring down the costs of key technologies, such as electric vehicles (EVs), renewables, and alternative proteins, enabling others to accelerate their own deployment. For other technologies where potential cost gains may be more limited, such as carbon capture and storage (CCS), there can still be a valuable demonstration effect. Phasing out coal power is already providing a strong demonstration effect.
- International climate finance: in 2019, the UK Government committed to providing £11.6 billion in international climate finance in aggregate over 2021/22–2025/26.[672] This ambition was reiterated in 2024.[673] The Government should also set out an ambitious and fair contribution to the new global climate finance goal agreed at COP29. The UK should leverage its position as a global financial hub to support a wider mobilisation of public and private climate finance.
- International collaboration and initiatives: the UK should seek to drive and strengthen international sectoral pledges and alliances, such as the Breakthrough Agenda, Global Methane Pledge, Powering Past Coal Alliance, new Clean Power Alliance, Just Energy Transition Partnerships, and Forest and Climate Leaders’ Partnership to help ensure they deliver their goals. In support of this, the UK should clearly set out its domestic contributions to these international initiatives and work to ensure they complement each other and avoid duplication. Collaborating to reduce supply chain and imported emissions (see Section 10.3), and UK-based businesses acting to reduce emissions across their whole value chain (see Section 9.2.1), can also help support emissions reduction internationally.
These are some examples of high-priority areas where the UK can make important international contributions, not an exhaustive list. Above all, the Government should recognise that it is actions, not ambitions, that have the largest impact. It should focus on successful delivery at home and abroad.
10.1.3 Using international credits/‘carbon units’
The Balanced Pathway is a roadmap for domestic decarbonisation. As set out in Chapter 3, the Government should not plan to use international credits (referred to as ‘carbon units’ in the Climate Change Act) to achieve the Seventh Carbon Budget. Planning to use credits to achieve UK targets carries risks, including the potential to undermine international leadership, reducing the clarity of domestic sectoral action, and failing to deliver carbon budgets if international credit supply proves unreliable.[674]
While international credits should not be part of the UK’s decarbonisation plan at this stage, there are potential future circumstances which might warrant their consideration. This is particularly relevant in the context of finalisation of carbon market rules under the Paris Agreement (Article 6) at COP29 in Azerbaijan in 2024 (see our briefing on COP29: Key outcomes and next steps for the UK for further discussion of the Article 6 conclusions and implications for the UK).
- Funding international direct air carbon capture and storage (DACCS): DACCS contributes 8 MtCO2e of abatement by 2050 in the Balanced Pathway. Subject to robust availability, a relative openness of the geographic siting to reduce overall costs might be considered. This is discussed further in Section 7.12, Box 7.12.1.
- International aviation and shipping offsetting mechanisms: emissions from international aviation and shipping are currently excluded from the Paris Agreement’s core mechanisms, such as NDCs. International aviation has an international credit mechanisms regime, whereas the international shipping sector at present does not.
- In 2016, member states of the International Civil Aviation Organization (ICAO) adopted the Carbon Offsetting and Reduction Scheme for International Aviation (CORSIA), a market-based mechanism which requires (after an initial voluntary phase until 2026) the aviation industry to offset growth in CO2 emissions above 2020 levels through a global market.
- The current goals and design of the scheme are not sufficiently ambitious and robust to consider their use towards UK carbon budgets.
- If CORSIA, or a similar scheme, developed such that offsets from the scheme were sufficiently robust, it could be justifiable to explore whether to consider such offsets applicable towards carbon budgets.
For any consideration of international credits, it is essential that principles for robust credit purchase are followed. These are set out in the Committee’s 2019 advice on Net Zero – The UK’s contribution to stopping global warming and include ensuring credits lead to genuinely additional and permanent emissions reduction, avoiding incentivising weaker domestic ambition in selling countries, and aligning with wider sustainability goals.
Voluntary carbon markets – where organisations use credits voluntarily rather than to comply with legal obligations – could support domestic progress towards Net Zero in future, but only where high integrity and robust regulation is ensured. See the Committee’s 2022 report on Voluntary carbon markets and offsetting for further details.
Sections 26–28 of the Climate Change Act allow for changes in the treatment of international carbon units. Further advice from the Committee is required before any credits could be used to contribute towards meeting UK carbon budgets.
10.2 The energy system and UK energy security
10.2.1 Energy system transformation in the Balanced Pathway
Figure 10.4 shows the flow of energy through the system today and in a Net Zero UK. From left to right, these diagrams illustrate how energy is supplied, converted into different forms, distributed, and ultimately used or lost (Box 10.2).
- The present-day energy system (Figure 10.4a) is dominated by oil and gas. Only 313 TWh of electricity is generated annually, with over one-third of this from unabated gas. Due to the inefficiency of fossil fuel combustion, much of today’s energy supply is wasted (around 1,000 TWh annually).
- By 2050 (Figure 10.4b), electricity is the dominant energy carrier, with 864 TWh generated, mostly from renewables. This is supplemented by low-carbon fuels including hydrogen and bioenergy, and a limited role for fossil fuels. Less energy is required to meet the same level of energy services, due to the increased efficiency of low-carbon technologies (such as EVs and heat pumps). Wasted energy is reduced by about half.
The 2050 energy system
Electrification
The replacement of fossil fuel technologies with electric counterparts is the most significant change to the energy system. Increased electricity demand is met by a large expansion of variable renewable energy and supplemented by other forms of low-carbon generation such as gas with CCS, hydrogen, nuclear, and bioenergy with CCS.
- Final demand for electricity reaches 683 TWh, primarily driven by the transport, buildings, and industry sectors.[675] An additional 89 TWh of electricity (from surplus generation) is used to produce green hydrogen.
- Other low-carbon fuels including bioenergy, hydrogen, and sustainable aviation fuel (SAF) contribute a further 110 TWh to final energy demand. While their overall share in the energy mix is relatively small, these sources are highly versatile. They can be delivered directly to end-users, transformed for different applications, or, in the case of hydrogen and bioenergy, generate electricity during periods of low renewables output, ensuring security of supply (see Section 7.5).
- The role of electrification has increased since our Sixth Carbon Budget advice, with a lower demand for hydrogen. Our Seventh Carbon Budget analysis sees a reduced role for hydrogen in industry and no role in home heating or for heavy goods vehicles.
- Ammonia for use in shipping is supplied by the international market in our Seventh Carbon Budget analysis, so domestic hydrogen is not required for production of ammonia for use in UK shipping in our pathway.
- By contrast, we assume that synthetic fuels (for example, synthetic SAF and shipping fuels) are produced domestically, requiring a supply of hydrogen as a feedstock (see Section 7.7, Box 7.7.1).
A reduced role for fossil fuels
The primary demand for oil and gas falls from 1,476 TWh to 286 TWh in the Balanced Pathway (Figure 10.5).
- Unabated fossil fuels are virtually eliminated from all applications apart from aviation fuel, for which engineered removals offset the resulting emissions. SAF prices are uncertain; if these fall faster than expected, residual demand for fossil fuels in aviation could be lower.
- Gas with CCS accounts for around half of the remaining demand for fossil fuels in 2050. Where gas CCS is used, other options are often available (for example, hydrogen for electricity generation), meaning that total fossil fuel demand could fall further still.
- UK policy on future oil and gas production should be aligned with Global Stocktake calls to accelerate the transition away from fossil fuels and with the UNFCCC principle of common-but-differentiated responsibilities. The Supreme Court ruled in 2024 that emissions from the use of fossil fuels should be taken into account when considering whether to grant approval for new licences.[676] The Government has stated its intention not to issue new oil and gas licences.[677]
- Oil and gas fields in the North Sea are mature and declining in output. Even without any global action to reduce emissions, production is expected to fall significantly by 2050 (see Section 10.2.2).
- As the costs of low-carbon alternatives, such as renewable energy and EVs, continue to decrease, the global demand for oil and gas is expected to decline substantially. The remaining producers will be those who have the lowest costs of production. The UK’s oil and gas production costs are higher than those in many other regions.
- It is better to proactively plan for a managed transition that brings alternative high-quality jobs to areas dependent on the North Sea oil and gas industry than to simply wait for these operations to become uncompetitive (see Chapter 9).
- Maintaining ongoing UK production makes little difference to UK energy security or to energy prices. The price of oil and gas, set by the international market, is a greater determinant of energy security than the volume of domestic production. While the UK is a net importer of oil and gas, over 80% of domestic oil and gas production is exported, and the volume of UK production is too small to have a meaningful effect on the international market price.[678]
Less wasted energy
Renewable energy and electric technologies are more energy efficient than their fossil fuel alternatives, meaning less wasted energy throughout the system. Energy losses are reduced from around 1,000 TWh today to around 500 TWh in 2050.
- At the primary energy stage, losses from transformation of raw resources – such as gas or wind – to energy are reduced. The efficiency of a typical gas power station is only 53%, meaning that around half of the energy content of the gas is lost.[679] Renewable sources such as wind and solar do not face this limitation.
- Subsequently, when energy is delivered to end-users, electric appliances are generally more efficient than their fossil fuel counterparts, meaning that less energy is needed to deliver the same service. For example, EVs are around four times more efficient than a typical petrol car, so require roughly a quarter of the energy to travel a given distance.[680] In buildings, heat pumps are around three-to-four times more efficient than gas boilers.[681]
- Overall, final energy demand falls by over a third, from around 1,600 TWh to 1,000 TWh from 2025 to 2050, and is half of what 2050 demand would be in our baseline scenario (Figure 10.6). This is achieved while delivering an increased level of energy services.
- While this is driven primarily by the efficiency improvements mentioned above, the Balanced Pathway also includes some measures that directly reduce the UK’s energy demand relative to the baseline of no further decarbonisation action. These include slower growth in aviation demand, modal shift to public transport and active travel, and resource efficiency in industry.
- This lower overall consumption is beneficial for the system as a whole, resulting in reduced reliance on imports (see Section 10.2.2) and requiring less capital investment to meet demand.
| Figure 10.4 The transformation of the energy system in the Balanced Pathway from 2025 to 2050 |
  Description: Flow diagrams visualising the energy system in 2025 and 2050. The major changes to the system include large scale electrification, a reduced role for oil and gas, and reduced energy losses. Source: Department for Business, Energy and Industrial Strategy (2019) Experimental statistics on whole UK energy flow incorporating end use energy efficiency; CCC analysis. Notes: (1) Shipping fuels include ammonia, methanol, and synthetic methanol. (2) Useful energy and losses are illustrative estimates and have been rounded to the nearest 100 TWh. These are based on evidence on the relative efficiencies of the main technologies in use in each sector in 2025 and 2050. (3) Ambient heat refers to the energy extracted by heat pumps from air, ground, or water. (4) For simplicity, small flows of energy (<1 TWh) have been excluded. |
|
Figure 10.5 Gross energy demands by fuel type in the Balanced Pathway (all demands are in TWh) |
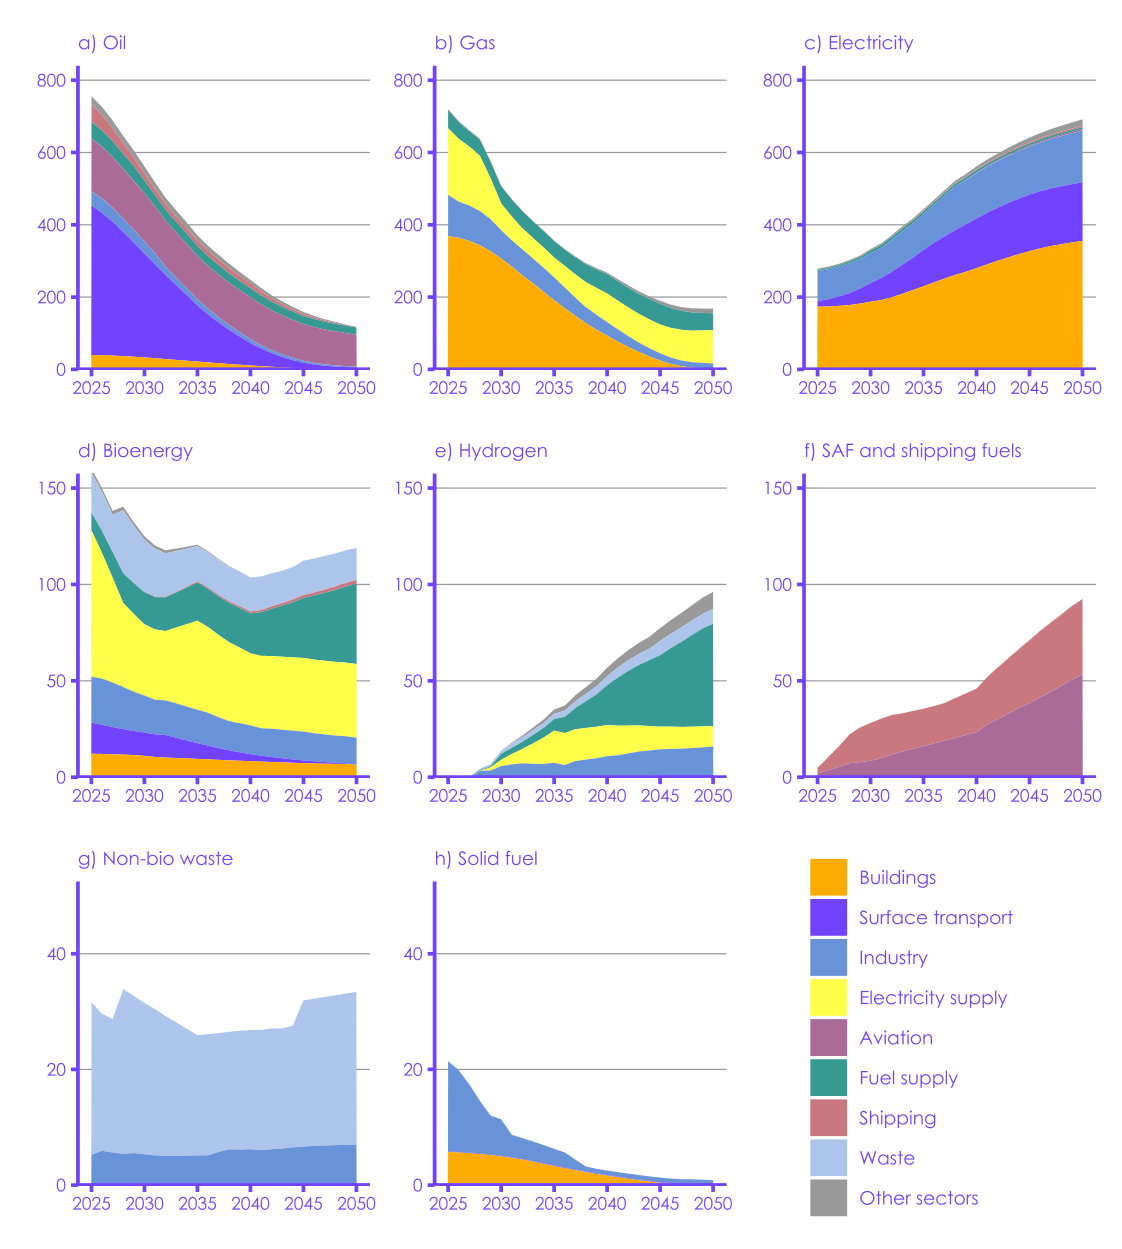 Description: Energy demands for fossil fuels fall substantially in the Balanced Pathway. Demands for electricity, hydrogen, and other low-carbon fuels grow. Source: CCC analysis. Notes: (1) Gross energy demands are inclusive of all system-wide uses of each fuel type, regardless of whether the fuel is used at primary or final stage. For example, gross electricity demand includes consumption by final users, as well as intermediate stages such as for production of sustainable aviation fuel (SAF). (2) For primary and final demands, refer to Figures 10.4 and 10.7. Surplus electricity generation used for green hydrogen production is excluded. (3) Energy from waste demand is allocated to the waste sector. (4) Energy demands in the fuel supply sector are those involved in the supply of fossil fuels, bioenergy, hydrogen, and synthetic fuels. |
| Figure 10.6 Final energy demand in the baseline and Balanced Pathway |
 Description: Economy-wide final energy demand falls in our pathway, while delivering more energy services (see Figure 10.4), due to less energy being wasted. Our baseline scenario would require twice as much final energy for a similar level of energy services. Source: CCC analysis. Notes: (1) The final energy demands shown here are not directly comparable to the gross energy demands in Figure 10.5. (2) Energy demands in the fuel supply sector are those involved in the supply of fossil fuels (energy used in the supply of bioenergy and hydrogen is not considered to be a final use). |
| Box 10.2 Measuring energy demand |
| Energy demand can be measured at each stage of the system, and is expressed as primary, secondary, final, or useful demand (Figure 10.7). Between each stage, energy losses are incurred, for example, in transmission and distribution or through waste heat due to inefficiencies in end-use appliances. An efficient energy system is one with similar levels of primary and useful demand.
When comparing relative contributions of fossil fuels and renewables to the energy mix, the primary energy metric overstates the role of fossil fuels, as it does not account for the thermal losses in converting energy to other forms.[682] This misconception is sometimes referred to as the primary energy fallacy.[683] Similarly, the final energy metric does not consider losses between final and useful energy, such as the energy wasted in cars and boilers. The substitution method for calculating primary energy demand aims to overcome the primary energy fallacy, by putting combustible fuels (for example, gas) and non-combustible inputs (for example, wind) on a level footing.[684] The non-fossil generation is scaled up to the level it would be if it had the same efficiency as a typical gas power plant. Using this method, the contribution of fossil fuels to primary energy supply in the Balanced Pathway decreases from 73% in 2025 to 14% in 2050. However, despite their simplicity, percentage-based energy mix metrics are limited, and can only describe a single stage of the system. Energy system flow diagrams with quantified losses (such as Figure 10.4) are a fairer and more accurate way to describe the composition of the energy system. |
| Figure 10.7 Energy demand metrics |
 Description: Energy flows through the system from primary inputs and is converted into secondary energy sources, before being delivered to a consumer as final energy. Useful energy then represents the energy services required by the consumer. Source: Adapted from Ritchie, H. (2022) Primary, secondary, final, and useful energy. |
Best uses of electricity and bioenergy
In designing a low-carbon energy system, it is important to consider the best uses of electricity and bioenergy, so that these resources are used in the most efficient and valuable applications.
Best uses of low-carbon electricity
In the Balanced Pathway, direct uses of electricity (such as using EVs and heat pumps) are preferred to indirect uses of electricity (such as using electrolytic hydrogen in cars and boilers).
- Direct electrification is significantly more efficient – saving more emissions – compared to indirect uses of electricity, due to the energy conversion losses incurred in converting electricity into hydrogen and synthetic fuels (Figure 10.8). Given these conversion losses, indirect use of electricity via hydrogen is generally reserved for use in applications where direct electrification is not feasible. Direct electrification is preferred because it is more efficient and, as a result, cheaper in most cases.
- Despite the high energy requirement for capturing carbon from the atmosphere, uses for SAF and DACCS are still beneficial in limited quantities to provide necessary solutions to decarbonise aviation (see Section 7.6) and offset unavoidable residual emissions (see Section 7.12).
| Figure 10.8 Best uses for zero-carbon electricity |
 Description: Chart shows emission savings from using 1 MWh of zero-carbon electricity, with the highest savings coming from direct electrification uses (for example, in electric vehicles and heat pumps) and the lowest savings for indirect uses (such as converting to hydrogen). Source: CCC analysis. Notes: (1) Coal is shown as a dashed outline because it has now been phased out of the UK electricity system. (2) ‘EVs’ are electric vehicles; ‘DACCS’ is direct air carbon capture and storage. |
Best uses of biomass
There is limited supply of biomass that can be accessed sustainably, and our pathway has a declining role for imports in the longer term (see Section 7.7). Given this, our pathway allocates biomass to sectors where its use has highest value in reducing total emissions. These are typically where CCS can be applied and/or where its use displaces high-carbon alternatives for which other low-carbon options are not yet available (Figure 10.9). By 2050, almost all the biomass use in our pathway is with CCS, delivering emissions removal benefits alongside displacing fossil fuel use.
- CCS applications: the primary best uses of biomass with CCS – which give comparable emissions savings – are likely to be in industry, production of SAF, hydrogen production, electricity generation, and at energy from waste facilities.
- Non-aviation biofuels: transitional use of biofuels such as biodiesel and bioethanol can help reduce emissions in surface transport and in machinery in industry and agriculture. Using biomass to produce biodiesel and bioethanol to decarbonise the surface transport fleet has a declining role over time as other low-carbon options such as EVs become increasingly available, reducing the potential emissions savings below those offered by other uses and to potentially very low levels.
- Biogas: in the Balanced Pathway, biogas is predominantly blended into the gas grid as biomethane displacing natural gas, with this role declining over time as heating is electrified. At this point, the biogas freed up becomes increasingly available for use in other sectors, reducing the need for gas imports.
| Figure 10.9 Best uses of bioenergy in 2050 |
 Description: Chart shows emissions savings from use of bioenergy across sectors in 2050. The highest emissions savings are where bioenergy is used with CCS; they are much less or close to zero when used without CCS. |
10.2.2 Energy security
Dependence on imported energy
Expanding and decarbonising the electricity system will result in the majority of the UK’s economy using domestically produced low-carbon energy. In the Balanced Pathway, total net energy imports fall from 867 TWh in 2025 to 202 TWh in 2050.
Oil and gas
In the Balanced Pathway, total net imports of oil and gas are projected to fall by 77% over the period from 2025 to 2050 (Figure 10.10 and Figure 10.11).
- Domestic supplies of oil and gas are falling. The North Sea Transition Authority projects that, without further exploration, UK production of oil and gas will fall from 689 TWh in 2025 to 62 TWh in 2050. If production from possible new oil and gas fields is included, domestic production is projected to be 103 TWh in 2050.[685]
- In the baseline, this means that net imports of 1,772 TWh of oil and gas would be needed in 2050, even with new exploration.
- Oil and gas demand is much lower in the Balanced Pathway, resulting in avoided imports of 1,589 TWh in 2050. Based on central projections of oil and gas wholesale prices, these avoided imports would be worth £45 billion in 2050.
Electricity
Net imports of electricity met 9% of demand in 2023. In the Balanced Pathway, the UK is a net exporter of electricity in 2050. Interconnection with neighbouring markets enables imports of electricity when it is cheaper to do so and during periods of lower renewable generation. While there will be times when the UK imports electricity, periods of high renewable generation will result in surplus domestic generation available for export to neighbouring markets.
| Figure 10.10 UK consumption and imports of oil in the Balanced Pathway |
 Description: Domestic oil production rapidly declines between 2025 and 2050, even after including potential production from possible new fields. In the Balanced Pathway, net imports of oil reduce over time as demand falls. Source: North Sea Transition Authority (2024) March 2024 Projections of UK Oil and Gas Production and Expenditure; CCC analysis. Notes: (1) Avoided imports represent the additional net imports required in the baseline compared to the Balanced Pathway. (2) Net imports represent total demand minus UK production (including production from possible new fields). |
| Figure 10.11 UK consumption and imports of gas in the Balanced Pathway |
 Description: Domestic gas production rapidly declines between 2025 and 2050, even after including potential production from possible new fields. In the Balanced Pathway, net imports of gas reduce over time as demand falls. Source: North Sea Transition Authority (2024) March 2024 Projections of UK Oil and Gas Production and Expenditure; CCC analysis. Notes: (1) Avoided imports represent the additional net imports required in the baseline compared to the Balanced Pathway. (2) Net imports represent total demand minus UK production (including production from possible new fields). |
Impacts of energy price shocks
Today, the UK’s energy system is dependent on internationally traded fossil fuels. Exposure to price shocks in these markets has had widespread negative impacts on the economy (see Chapter 9). In the Balanced Pathway, the UK’s reduced reliance on imported fossil fuels will substantially reduce our exposure to these impacts.
- In the present-day electricity system, the cost of electricity is largely set by the cost of unabated gas generation. If gas costs were to spike to 2022 levels in 2040, the annualised system cost per unit of electricity would increase by 28% in the baseline (which represents a continuation of the current electricity system), relative to central gas cost assumptions.[686] In contrast, in the Balanced Pathway the impact would be an increase of only 9%.
- Currently, as well as electricity, most households use unabated gas for space heating and hot water. If gas costs were to spike to 2022 levels in 2040, the average dual-fuel energy bill would increase by 59% in the baseline, relative to central gas cost assumptions, compared to an increase of only 4% in the Balanced Pathway.
Moving to a low-carbon electricity system is therefore not only lower cost than the baseline by 2050 (see Section 7.5), but brings additional benefits by insuring against future gas price shocks.
10.2.3 Critical minerals
Many of the technologies required to deliver the energy system transformation described above require critical minerals in greater quantities than the existing technologies they replace. The key minerals most required for delivering our pathway (by weight) are copper, graphite, and nickel, with smaller amounts of other minerals. These minerals are used for a wide range of decarbonisation technologies, including EVs and wind turbines.
Supply constraints
There are large global supplies of all of the critical minerals that will be required, which are expected to be sufficient to meet the global requirements by 2050.[687] The challenges are likely to be around scaling up supply chains to deliver these minerals where and when they are needed, as well as ensuring sufficient share of these global supplies for the UK given that other countries will also be making similar demands for these minerals as part of their decarbonisation plans.
- The UK Critical Minerals Intelligence Centre (CMIC) identified 34 raw materials as being critical, in terms of being of the greatest economic importance and at the highest risk of supply disruption.[688] This considered a broader range of minerals than in their previous criticality assessment and concluded that more research and capacity building are required, especially highlighting the need for increased recycling.
- The Energy Transitions Commission (ETC) has compared the global requirements of critical minerals for decarbonisation to global resources (that is, the total known amount of these minerals underground) and concluded that the resources are sufficient until at least 2050.[689] They also concluded that while some global reserves (that is, the amount of these minerals that are currently economically viable and technically feasible to extract) are insufficient, reserves can and will expand to meet required demand.
- The International Energy Agency (IEA) expects that demand for many of these critical minerals will ramp up most steeply from now to 2030, with peak global demand being reached around 2040.[690] In many cases, the products using these materials that are required in our pathway will be manufactured outside the UK.
It typically takes several years for a new mine to progress from inception to production, so it is possible that there could be some constrained supply of certain minerals around 2030. This could pose a risk to any parts of our pathway that involve introducing new equipment or technologies, so the Government and UK businesses should ensure that they understand their supply chains for these products and ensure that they are not overly reliant on any single at-risk supplier. They should also seek to maximise the UK’s critical mineral recycling capabilities (for example, by supporting domestic facilities for recycling EV batteries) to diversify supply and minimise dependence on mining.
- Both the ETC and the IEA have highlighted this risk, noting that the current pipeline of new mines is insufficient to meet requirements in 2030. Any issues could take several years to resolve, as this is how long it takes to develop new mines.
- Lots of materials are substitutable: for example, aluminium is almost as good a conductor as copper and can be used in most of the same applications, such as electricity transmission and distribution overhead lines. This could reduce supply risks, as has been seen recently through the ability of battery manufacturers to find alternative chemistries to mitigate against potential shortfalls in cobalt supply.[691]
Amount of mining
The total amount of critical mineral ore required globally is likely to be similar to or less than the amount of coal that is currently mined worldwide. Unlike fossil fuels, critical minerals can be recycled. This means that this is an upper bound – the amount of critical minerals needing to be mined should be less than the expected demand for those minerals.
- Using IEA forecasts of the demand for 37 critical minerals for the energy transition (including copper) and published estimates of the proportions of metal in mined critical mineral ores, the globally required weight of critical mineral ore is expected to peak at around 90% of current global coal demand (which is the highest coal demand has ever been).[692];[693];[694];[695];[696];[697];[698]
- When comparing instead to all fossil fuels, the total weight of critical mineral ore is likely to peak at around 40% of current annual fossil fuel extraction. Even accounting for the typically higher amount of waste rock produced during mining of critical minerals, we estimate that the total weight of material extracted through critical mineral mining is likely to be no higher than that currently extracted in fossil fuel production.[699]
- The ETC estimates that recycling is likely to meet less than 10% of critical mineral demand up to 2030, but by 2050 this could be 10–80% depending on the mineral. The IEA reached a similar conclusion, that increased recycling could reduce new mining activity by 25–40%.[700]
- The CMIC has emphasised the importance of growing UK recycling supply chains, both as a means to increase resilience of supply through diversification and to reduce the environmental impact of new extraction.
Sustainability of mining
There are a range of sustainability concerns associated with mining, many of which are similar to those around existing mineral extraction, for example oil drilling.[701] The Government should engage with the international community to tackle these issues.
- Damage to public health and the environment from mining operations is one area of concern. This includes concerns around CO2 emissions embedded in the mining processes, effects on water scarcity in arid regions, impacts on local ecosystems and potential pollution of local watercourses.
- Critical mineral extraction can also damage public health and there are concerns around human rights violations and child labour in certain mining locations. It is vital to eliminate this by supporting responsible production in these markets and establishing common expectations of what level of assurance should be expected through technology manufacturers’ value chains.
- For critical minerals used in battery manufacture, there has been some progress in bringing together organisations operating across the supply chain to develop approaches to address these issues.[702] From 2027, all batteries over 2 kWh sold in the EU will require a ‘battery passport’ which will help track sustainability of production and ensure minimum recyclability standards.[703] A similar approach could be applied to other technologies such as wind turbines.
Critical mineral imports
The weight of critical mineral imports is not expected to place significant strain on UK import or transportation systems. However, these imports are expected to be disproportionately high in value. Many of these imports are likely to be contained within manufactured goods (including finished low-carbon technologies).
- We estimate that the weight of the UK’s additional demand for critical minerals implied by our pathway will peak at about 0.1% of total current imports by road, rail, and ship.[704];[705];[706] Therefore, these imports should not result in significant strain on UK import systems.
- The demand for these minerals for high-value manufacturing and their inclusion within desirable low-carbon technologies means that the unit cost is likely to be quite high compared to the average import unit cost. Therefore, we estimate that the total cost of the UK’s demand for key minerals for the energy transition in 2040 is likely to be around 0.9% of the current total value of goods imports.[707];[708];[709];[710] This import value share is similar to that of coffee, tea, and cocoa.
- These import estimates are based on a scenario with no domestic critical minerals recycling industry. But as highlighted above, the ETC estimates that recycling could meet 10–80% of demand for different minerals by 2050 – some or all of this recycling could take place in the UK, reducing reliance on imports. Clear recyclability standards and/or regulations, as well as targets for recycled content, are options to make this happen.
The UK has always relied on trade, and this will continue to be the case in our pathway. While recycled and domestically produced materials may play a key role in some areas, in others it will likely be more efficient or necessary to participate in global markets. The Government and UK businesses should aim to ensure that supply chains are diverse, resilient, and sustainable.
10.3 Imported emissions
10.3.1 Current emissions from imports
The UK’s legally binding targets are set on the basis of territorial emissions (that is, emissions within the UK’s territorial borders), but other accounting frameworks provide important complementary perspectives. Emissions associated with imports are similar in magnitude to territorial emissions and are therefore a significant part of the UK’s contribution to climate change (Figure 10.12).[711]
- In 2021, imported emissions were 381 MtCO2e, compared to 423 MtCO2e for territorial emissions.[712];[713] As the UK decarbonises domestically, imported emissions will make up an increasingly large proportion of the UK’s impact on the climate, and may exceed territorial emissions by the Seventh Carbon Budget period (2038 to 2042).
- While territorial emissions have fallen significantly, imported emissions have stayed relatively flat since 1990. Previous CCC analysis has shown that improvements in the carbon intensity of production by trade partners have been offset by increased consumption in absolute terms, resulting in a fairly flat trend overall.[714]
- The largest contributing regions to our imported emissions are the EU (29%) and China (12%), with many other regions with significant shares. Food and agricultural products are the single largest source (21%), with industrial products also contributing significantly. Transport products and services make up 15%, highlighting that the UK’s imported emissions are generally from the embodied carbon in imported goods, rather than their transportation (Figure 10.13).
| Figure 10.12 UK territorial and imported emissions since 1990 |
 Description: Territorial emissions have decreased significantly, while emissions from imports have stayed relatively flat. |
| Figure 10.13 Imported emissions by region and product (in 2019) |
  Description: The UK’s imported emissions are distributed across many regions, with the EU being the largest contributor. Food (and forestry products) is the largest individual source of emissions. Source: Defra (2024), UK and England’s carbon footprint to 2021; University of Leeds (unpublished data); CCC analysis. Notes: (1) 2019 is chosen as the years 2020 and 2021 were distorted by the COVID-19 pandemic. (2) ‘Other services’ consists of over 30 categories including public administration and defence services, education services, and real estate and accommodation services. |
There are significant climate benefits to addressing emissions from imports. The UK can demonstrate leadership by recognising that its impact on the climate includes activities beyond its territorial boundaries and maximise its positive impact on the climate.
- Limiting carbon leakage: this would prevent the UK’s strong domestic climate policy from being undermined by increased emissions elsewhere, while helping to ensure competitiveness for UK industry. Importantly, leakage can also occur indirectly due to factors other than domestic climate policy, highlighting the need for a wider strategy on international competitiveness (see Section 7.4 and Section 9.2). Domestic decarbonisation will also result in increased imports of some low-carbon technologies, such as EVs. While lifetime emissions from EVs are significantly lower than petrol and diesel vehicles, it is important to minimise the embodied emissions from these imports (see Section 7.1).
- Driving global emissions reductions: addressing emissions from imports provides an opportunity to support the growth of low-carbon markets, which is imperative for sustained global emissions reductions to occur.
- Demonstrating leadership: few countries have taken concrete steps to reduce emissions from imports. The UK has an opportunity to be a leader in this area and set a useful precedent for similar countries to follow.
Since our previous review of the UK’s imported emissions in our 2020 Sixth Carbon Budget advice, there have been a number of contextual changes and developments in this area. These include the move towards targets and benchmarks on consumption-based emissions by some countries including France, collaborative agreements between trade partners (such as Just Energy Transition Partnerships), and unilateral measures, such as the EU and UK’s carbon border adjustment mechanisms (CBAMs) and the US’s Inflation Reduction Act.[715] This new context has implications for the UK’s approach to managing its emissions from imports.
10.3.2 Defining a benchmark for imported emissions
The Committee proposes that the UK set a non-legally binding benchmark on imported emissions as a supplementary aim alongside the territorial emissions targets. The benchmark should set out the Government’s expectations for how emissions from imports should develop in line with a proportionate UK contribution to reducing global emissions.
- Such a benchmark would set a clear direction for policymakers, while avoiding the issues associated with a legal target on imported emissions.
- Legal targets for emissions from imports could undermine the accountability of other countries for their territorial emissions. While there is a clear need for the importers of goods to recognise and minimise the climate impacts of their consumption, ultimate responsibility for reducing emissions lies with the producer. Producer countries also have direct control over the emissions sources, whereas importers have only indirect levers in most cases.
- The published statistics on imported emissions are estimated using financial spend data, with monetary flows acting as a proxy for physical flows between countries. These statistics give a useful indication of the scale of the issue (Box 10.3), but the method is inherently uncertain and would be problematic for a formal target. In contrast, a benchmark is more flexible and can be adjusted as data quality improves.
The benchmark should be aligned with the Paris Agreement goal to limit warming to 1.5°C. There are established methodologies for projecting emissions from imports under global decarbonisation scenarios, such as that developed by the University of Leeds (see our 2013 report Reducing the UK’s carbon footprint and managing competitiveness risks).[716]
- This method involves using an integrated assessment model to project the carbon intensities of production across different sectors and regions at a rate consistent with a global decarbonisation pathway. The principle of common-but-differentiated responsibilities can be accounted for, with richer countries decarbonising faster than poorer countries. These intensities are then applied to the UK’s imports data.
- Where appropriate, the benchmark can be accompanied by more specific quantitative targets, for example on priority sources of imported emissions (see Section 10.3.3 below), including industrial consumption-based emissions (see Section 7.3).
A benchmark on emissions from imports would place the UK among the leading countries in this area globally. France has committed to setting indicative carbon budgets on consumption-based emissions in their upcoming National Low-Carbon Strategy (SNBC3).[717] Sweden’s Ministry for the Environment has also consulted on a consumption-based emissions target, proposed by the Cross-Party Committee on Environmental Objectives, although the target itself has not yet been set. Denmark and Norway have received recommendations to set consumption-based emissions targets or benchmarks from their climate change advisory bodies.[718];[719]
| Box 10.3 Improving the statistics on emissions from imports |
| There is scope to enhance the measurement and reporting of emissions from imports to provide more policy-relevant information. The statistics published by Defra are derived from financial spend data from the UK’s national accounts. Emissions factors are applied to the expenditure data, at a resolution of 112 sectors and 15 regions. Trade flows between countries are approximated with a multi-regional input-output model, meaning that the upstream emissions from UK imports are captured through the whole supply chain.
This method gives valuable information on the magnitude and general trend of emissions from imports, and the data quality is sufficient for the purpose of setting a benchmark as described in this section, as well as for identifying priority sources of imported emissions. The method also has the advantage of being consistent with economic data, and provides a complete estimate, except for emissions from land use change. However, these statistics alone are limited in their ability to provide policy-relevant insights: the sector classification used in the national accounts was not designed with carbon footprint analysis in mind, meaning that trends are difficult to interpret at more granular levels, and the estimates can be subject to inflationary effects that distort the results. To manage emissions from imports more effectively in the long term, the Government needs to improve the range and quality of the datasets available. This was a recommendation in our 2022 and 2023 progress reports.
These improvements will require increased investment in imported emissions data from the Government. Establishing a benchmark on emissions from imports, as recommended in this chapter, could help drive forward these methodological improvements. Source: University of Leeds (2024) 2024 data release of consumption-based accounts for the UK: summary of methods. |
10.3.3 Addressing emissions from imports
If the UK’s imported emissions estimates deviate significantly from the benchmark, it suggests that the UK’s trade partners may not be decarbonising at the required rate, carbon/investment leakage may be occurring, or the consumption of high-carbon goods may be increasing. The Government should act proactively to avoid this eventuality and prepare contingency measures that could be deployed if needed. In doing so, the Government should first identify priority sources of imported emissions, where there is significant potential for abatement. Once identified, these sources can be addressed by applying policy at various points in the supply chain.
Identifying priority sources of imported emissions
The UK’s consumption footprint is very heterogeneous, composed of a large variety of goods and services from many countries. To achieve significant and measurable reductions in imported emissions, it will be necessary to focus on the most impactful parts of the footprint. To help achieve this, the Committee recommends that the Government identifies priority sources of imported emissions, where there is significant potential for emissions savings.
A subset of the UK’s imported emissions could be considered a priority source if it is significant on one or more of the following factors:
- Contribution: the source contributes a significant percentage to the UK’s emissions from imports or has high abatement potential. Food and agricultural products are the largest contributor to the UK’s imported emissions footprint. Some other examples include transportation products and services (15%) and building and construction (10%). Smaller sources may still be considered significant if there is higher abatement potential.
- Source region: the source emissions are from regions decarbonising more slowly than their proportionate contribution to a Paris-aligned pathway. Acknowledging the principle of common-but-differentiated responsibilities, imports from countries decarbonising more slowly than the UK are not necessarily a concern, so long as these regions are contributing proportionately to a Paris-aligned global pathway. Where this is not the case, high-carbon imports from such regions should be seen as problematic. Around 40% of our imported emissions are from the EU or OECD, who are broadly expected to decarbonise at a similar rate as the UK, but the remaining 60% are distributed across many regions with varying levels of ambition.
- Competitiveness risk: the imported emissions relate to UK sectors which face greater competitiveness risks from the transition. Domestic decarbonisation should not result in an unnecessary increase in emissions from imports. Food is a key sector where this applies, as well as emerging industries for low-carbon products.
- Available levers: there are clear domestic levers to reduce the imported emissions from this source. It is easier to address areas of our imported emissions footprint where the demand is from a well-defined group or actor. For example, a significant fraction of imported emissions is from public procurement, particularly the health system.[722] The Government has more direct decision-making power over this than for imported consumer goods bought by households.
Hierarchy of policy interventions
Emissions are most effectively mitigated at their source. Helping trade partners to decarbonise will have a far greater climate benefit than solely cutting domestic consumption, which typically accounts for only a small fraction of overall production. This implies that supply-orientated measures for imported emissions in internationally traded products and services should take precedence over those focused on domestic demand alone, though both levers are necessary in the policy mix.
- In some cases, supply-oriented measures for reducing territorial emissions need to be coupled with demand-side equivalents to avoid carbon leakage. For example, if UK farmers are incentivised to reduce domestic livestock numbers, there is a risk that this would lead to an increased consumption of imported meat. A corresponding reduction in meat consumption is therefore necessary to avoid offshoring emissions associated with livestock.
- In many sectors, no single policy or approach will be sufficient in isolation, and a layered assemblage of policy measures will be needed.[723] These should be placed up and down the supply chain and involve multiple delivery actors.
The following sections summarise the Committee’s proposed hierarchy of policy interventions on imported emissions, in order of impact.
Extending the scope of existing policy instruments
There are fewer barriers, both political and practical, to extending existing policies.
- Carbon border adjustment mechanisms: the UK CBAM is a policy that could be expanded in scope. However, there are limits to what the CBAM can achieve in isolation.
- The UK CBAM will be introduced from 2027. It is currently limited to certain sectors within the UK ETS and will likely only include primary products as opposed to finished goods. This could be improved over time as accounting frameworks develop, however there may still be significant gaps in coverage, even within sectors covered by the UK ETS.
- There are some areas where a CBAM is less suited. Sectors outside the UK ETS already face a legal hurdle for inclusion, and calculating embodied emissions at a product level is non-trivial in many instances.[724] Despite this, there remains potential for the inclusion of certain emissions-intensive products, for instance beef, so long as these barriers can be overcome.
- While the CBAM is an important step, it remains a complex and untested policy mechanism. It is unclear how its success will be measured, and there is a risk that it could be undermined by inadequate emissions accounting on behalf of exporters.
- Product standards: minimum standards can be applied to producers or purchasers. This mechanism is considered effective for managing carbon leakage in the long term, potentially superseding measures such as the CBAM.[725] Following a consultation in 2023, the Government announced that it would work with industry to establish voluntary product standards, which could pave the way for mandatory standards to be introduced in the future.[726] Mandatory standards have the advantage over pricing mechanisms as they set an absolute cap on embodied emissions, rather than simply a financial penalty. However, standards require highly developed reporting and accounting frameworks.
Interventions targeted towards the supply side
This includes multilateral agreements or partnerships aimed at reducing emissions at their source. Such measures have potential to drive emissions reductions beyond what would be possible with a CBAM alone, since the UK’s imported emissions are small in global terms. Helping a trade partner decarbonise will reduce the imported emissions of all its exports, not just those to the UK.
- Multinational partnerships: the UK’s participation in Just Energy Transition Partnerships (JETPs), such as those with South Africa, Vietnam, and Indonesia, sets an important precedent for the value of collaborative action between trade partners.[727];[728];[729] JETPs are financing arrangements for emerging economies to transition away from coal. Such agreements can be positive for diplomatic relationships and mitigate the negative perceptions linked to unilateral policies such as CBAMs, which are sometimes seen as protectionist measures. The UK could prioritise efforts in countries and sectors that supply a significant share of its imports.
- This could be well suited to the more heterogeneous areas of our imported emissions footprint, such as manufactured products. Decarbonising the energy supply and improving the emissions intensity of key industrial products used for production of manufactured goods would be more effective in reducing global emissions than an array of separate demand-side measures for individual manufactured products.
- The Government’s International Climate Finance (ICF) commitments can also contribute to this goal. Setting a benchmark on emissions from imports would strengthen the case to leverage ICF to support the decarbonisation of low-income trade partners.
- Business and public sector supply chains: businesses and the public sector can work with their suppliers to help reduce the emissions intensity of their products. In a similar way to collaborative agreements between trade partners, a company supporting its suppliers to decarbonise will bring climate benefits beyond those attributable to the company’s demand alone.
- The Task Force on Climate-related Financial Disclosure (TCFD) and initiatives such as Science Based Targets (SBTi) provide frameworks for companies to disclose and set meaningful targets on their supply chain emissions (Scope 3).
- While some parts of the TCFD are mandatory for large companies, reporting on Scope 3 emissions and setting targets remain largely voluntary.[730];[731] As a consequence, there is little obligation for companies to be informed or act on the climate impacts of their supply chains.
Demand-side policy, with business and government as the delivery actor
Businesses and the public sector are often better placed than the general public to make low-carbon choices and undertake resource efficiency measures. There are practical benefits to demand-related measures that involve a smaller number of larger actors, as opposed to those that rely on efforts from individual households.
- Resource efficiency: a number of the resource efficiency measures in our Balanced Pathway also provide significant reductions in imported emissions. These include the refurbishment of the current building stock (as opposed to new construction) and reducing overdesign and waste from the construction process. Analysis from Leeds University suggests that the imported emissions savings could be of a similar magnitude to the territorial savings from these measures (see Section 7.3)
- Low-carbon public procurement: the public sector can initiate many of the changes required during the transition, for example, by leading the take up of voluntary and mandatory product standards placed upon purchasers. One area particularly relevant to imported emissions is the health system, whose ‘carbon footprint plus’ (including Scope 3 emissions from the supply chain of medicines and medical equipment) is around 25 MtCO2e.[732]
Demand-side policy, with citizens as the delivery actor
Chapter 8 sets out what the transition means for households and highlights the key low-carbon household choices from a territorial emissions perspective. Many of these choices will also help to reduce the UK’s imported emissions. While these measures do not give rise to as far-reaching reductions as supply-oriented measures, they still make an important contribution in certain areas.
- Reducing demand for meat and dairy products: a shift towards lower-carbon food is a key part of reducing emissions from agriculture (see Section 7.4). Imports meet a significant proportion of the UK’s demand for meat (around a third of meat is imported), so reducing domestic demand will also reduce emissions in other countries.[733]
- Managing growth in aviation demand: our territorial emissions pathway includes emissions from international flights that depart from the UK. Emissions from all other air travel purchased by UK residents are included in the UK’s imported emissions. In the Balanced Pathway, aviation demand grows at a slower rate than it would under a baseline of no further decarbonisation action, saving almost 10 MtCO2e of territorial emissions. Given that many international flights involve a return journey, demand management would also reduce imported emissions from aviation.
- Other demand-side actions from the public: there are some measures that are not included in the Balanced Pathway (as they do not have a major effect on UK territorial emissions), but would nonetheless reduce emissions from imports. This includes more efficient and longer-lasting use of electronics, textiles, and consumer goods more generally. The Centre for Research into Energy Demand Solutions reviewed the potential for a wide range of such measures in its 2021 report.[734]
The Government and businesses have a role in incentivising low-carbon choices. Chapter 8 outlines a number of ways in which government policy and businesses can make these choices accessible, attractive, and affordable for households.
Annex 1: Priority recommendations
| Table A1 Priority recommendations |
||
|---|---|---|
| Sector | Recommendations | |
| Seventh Carbon Budget |
|
|
| Cross-cutting |
|
|
| Surface transport |
|
|
| Buildings |
|
|
| Industry |
|
|
| Agriculture and land use |
|
|
| Energy supply |
|
|
| Aviation |
|
|
| Waste |
|
|
| Shipping |
|
|
| Engineered removals |
|
|
Copernicus Climate Change Service (2025) The 2024 annual climate summary: global climate highlights 2024. https://climate.copernicus.eu/global-climate-highlights-2024.
These estimates are based on the IPCC’s Sixth Assessment Report methodology. Long-term warming refers to the average level of warming over a multi-decadal period, as distinct from the warming observed in a single year (such as that referred to for 2024).
At the time of writing, long-term warming trends have not yet been updated to include 2024 warming data.
Copernicus Climate Change Service (2024) Warmest January on record, 12-month average over 1.5°C above preindustrial. https://climate.copernicus.eu/warmest-january-record-12-month-average-over-15degc-above-preindustrial.
World Meteorological Organization (2024) State of the Global Climate 2023. https://library.wmo.int/idurl/4/68835.
Palazzo Corner, S. et al (2023) The Zero Emissions Commitment and climate stabilization. Frontiers in Science. https://doi.org/10.3389/fsci.2023.1170744.
Rogelj, J., Schleussner, C.-F., and Hare, W. (2017) Getting it right matters: Temperature goal interpretations in geoscience research. Geophysical Research Letters. https://doi.org/10.1002/2017GL075612.
Forster, P. et al (2024) Indicators of Global Climate Change 2023: annual update of key indicators of the state of the climate system and human influence. Earth Syst. Sci. https://doi.org/10.5194/essd-16-2625-2024.
Copernicus Climate Change Service (2024) Copernicus: June 2024 marks 12th month of global temperature reaching 1.5°C above pre-industrial. https://climate.copernicus.eu/copernicus-june-2024-marks-12th-month-global-temperature-reaching-15degc-above-pre-industrial.
Copernicus Climate Change Service (2025) The 2024 annual climate summary: global climate highlights 2024. https://climate.copernicus.eu/global-climate-highlights-2024.
‘Overshoot’ refers to the temporary exceedance of a given level of warming, after which temperatures fall back to below that level.
United Nations Environment Programme (2023) Emissions Gap Report 2023: Broken Record – Temperatures hit new highs, yet world fails to cut emissions (again). https://doi.org/10.59117/20.500.11822/43922.
United Nations Environment Programme (2024) Emissions Gap Report 2024: No more hot air … please! With a massive gap between rhetoric and reality, countries draft new climate commitments. https://doi.org/10.59117/20.500.11822/46404.
International Energy Agency (2024) World Energy Outlook 2024. https://www.iea.org/reports/world-energy-outlook-2024.
A tipping point refers to a critical threshold in the Earth’s system or related processes which, if passed, can cause sudden, dramatic, or even irreversible changes to some of the Earth’s largest systems.
Met Office (2023) What do we mean by a climate tipping point? https://www.metoffice.gov.uk/blog/2023/what-do-we-mean-by-a-climate-tipping-point.
Schleussner, C.-F. et al (2024) Overconfidence in climate overshoot. Nature. https://doi.org/10.1038/s41586-024-08020-9.
Intergovernmental Panel on Climate Change (2021) Summary for Policymakers. Climate Change 2021: The Physical Science Basis. Contribution of Working Group I to the Sixth Assessment Report of the Intergovernmental Panel on Climate Change. https://www.ipcc.ch/report/ar6/wg1/.
Smith, C. et al (2024) ClimateIndicator/data: Indicators of Global Climate Change 2023 revision (v2024.05.29b). Zenodo. https://doi.org/10.5281/zenodo.11388387.
Friedlingstein et al. (2024) Global Carbon Budget 2024, Earth Syst. Sci. (preprint) https://doi.org/10.5194/essd-2024-519.
Intergovernmental Panel on Climate Change (2021) Summary for Policymakers. Climate Change 2021: The Physical Science Basis. Contribution of Working Group I to the Sixth Assessment Report of the Intergovernmental Panel on Climate Change. https://www.ipcc.ch/report/ar6/wg1/.
Crippa et al. (2024) GHG emissions of all world countries. Publications Office of the European Union, Luxembourg. https://doi.org/10.2760/4002897.
Gütschow, J., Busch, D., Pflüger, M. (2024) The PRIMAP-hist national historical emissions time series v2.6 (1750-2023). Zenodo. https://doi:10.5281/zenodo.13752654.
Smith, C. et al (2024) ClimateIndicator/data: Indicators of Global Climate Change 2023 revision (v2024.05.29b). Zenodo. https://doi.org/10.5281/zenodo.11388387.
For consistency, these estimates are based on a third-party source rather than official inventories for which up-to-date figures are not available for all countries.
Gütschow, J., Pflüger, M. (2022) The PRIMAP-hist national historical emissions time series v2.4 (1750-2021). Zenodo. https://doi:10.5281/zenodo.7179775.
Gütschow, J., Busch, D., Pflüger, M. (2024) The PRIMAP-hist national historical emissions time series v2.6 (1750-2023). Zenodo. https://doi:10.5281/zenodo.13752654.
World Bank (2023) Population, Total. https://data.worldbank.org/indicator/SP.POP.TOTL. (Accessed: 10 December 2024).
International Energy Agency (2024) World Energy Outlook 2024. https://www.iea.org/reports/world-energy-outlook-2024.
Bloomberg New Energy Finance (2024) New Energy Outlook 2024. https://about.bnef.com/new-energy-outlook/. (Accessed: 10 December 2024).
United Nations Framework Convention on Climate Change (2024) Nationally determined contributions under the Paris Agreement. Synthesis report by the secretariat. https://unfccc.int/documents/641792.
Riahi, K. et al (2022) Mitigation pathways compatible with long-term goals. In IPCC, 2022: Climate Change 2022: Mitigation of Climate Change. Contribution of Working Group III to the Sixth Assessment Report of the Intergovernmental Panel on Climate Change. Cambridge University Press, Cambridge, UK and New York, NY, USA. doi: 10.1017/9781009157926.005.
O’Neill, B. et al (2022) Key Risks Across Sectors and Regions. In: Climate Change 2022: Impacts, Adaptation and Vulnerability. Contribution of Working Group II to the Sixth Assessment Report of the Intergovernmental Panel on Climate Change. Cambridge University Press, Cambridge, UK and New York, NY, USA, pp. 2411–2538, doi:10.1017/9781009325844.025.
Burke, M., Hsiang, S., and Miguel, E. (2015) Global non-linear effect of temperature on economic production. Nature 527, 235–239. https://doi.org/10.1038/nature15725.
Trust, S. et al (2023) The emperor’s new climate scenarios. https://actuaries.org.uk/emperors-new-climate-scenarios.
Trust, S. et al (2024) Climate scorpion: the sting is in the tail. https://actuaries.org.uk/media/g1qevrfa/climate-scorpion.pdf.
United Nations Environment Programme (2023) Emissions Gap Report 2023: Broken Record – Temperatures hit new highs, yet world fails to cut emissions (again). https://doi.org/10.59117/20.500.11822/43922.
World Resources Institute (2022) Climate Watch Historical GHG Emissions. https://www.climatewatchdata.org/ghg-emissions. (Accessed: 10 December 2024).
Climate Action Tracker (2024) China. https://climateactiontracker.org/countries/china/. (Accessed: 10 December 2024).
Myllyvirta, L. (2024) Analysis: Monthly drop hints that China’s CO2 emissions may have peaked in 2023. Carbon Brief. https://www.carbonbrief.org/analysis-monthly-drop-hints-that-chinas-co2-emissions-may-have-peaked-in-2023/.
United States Energy Information Administration (2024) What’s driving decreasing gasoline consumption in China? https://www.eia.gov/todayinenergy/detail.php?id=63764.
King, B. (2024) Rhodium Group – Taking Stock 2024: US Energy and Emissions Outlook. https://rhg.com/research/taking-stock-2024/.
Clean Investment Monitor (2024) Clean Investment Monitor: Q3 2024 Update. https://www.cleaninvestmentmonitor.org/reports/clean-investment-monitor-q3-2024-update.
Climate Action Tracker (2024) EU. https://climateactiontracker.org/countries/eu/. (Accessed: 10 December 2024).
European Parliament (2024) Energy policy: general principles. https://www.europarl.europa.eu/factsheets/en/sheet/68/energy-policy-general-principles. (Accessed: 10 December 2024).
International Energy Agency (2024) Breakthrough Agenda Report 2024. https://www.iea.org/reports/breakthrough-agenda-report-2024.
International Energy Agency (2024) World Energy Investment 2024. https://www.iea.org/reports/world-energy-investment-2024.
Several organisations project future warming using different methodologies and making different assumptions, particularly on long-term emissions trends. For simplicity, here we refer to warming estimates associated with a 50% probability from the UNEP Emissions Gap Report 2024, rounded to the nearest 0.5ºC to avoid false precision.
Intergovernmental Panel on Climate Change (2021) Summary for Policymakers. In: Climate Change 2021: The Physical Science Basis. Contribution of Working Group I to the Sixth Assessment Report of the Intergovernmental Panel on Climate Change. https://www.ipcc.ch/report/ar6/wg1/.
Friedlingstein, P. et al (2024) Global Carbon Budget 2024, Earth Syst. Sci. (preprint) https://doi.org/10.5194/essd-2024-519.
United Nations Environment Programme (2024) Emissions Gap Report 2024: No more hot air … please! With a massive gap between rhetoric and reality, countries draft new climate commitments. https://doi.org/10.59117/20.500.
International Energy Agency (2024) World Energy Outlook 2024. https://www.iea.org/reports/world-energy-outlook-2024.
United Nations Environment Programme (2015) The Emissions Gap Report 2015. https://www.unep.org/resources/emissions-gap-report-2015.
University of Bristol, University of Exeter, and Met Office Hadley Centre (2023) Reviewing climate change attribution in UK natural hazards and their impacts. https://www.ukclimaterisk.org/publications/reviewing-climate-change-attribution-in-uk-natural-hazards-and-their-impacts/.
Kendon, M. et al (2024) State of the UK Climate 2023. International Journal of Climatology. https://doi.org/10.1002/joc.8553.
Precise referenced period is the average over 1961–1990, presented as “1960s, 1970s and 1980s” for ease of interpretation.
Kendon, M. et al (2024) State of the UK Climate 2023. International Journal of Climatology. https://doi.org/10.1002/joc.8553.
Kendon, M. et al (2024) State of the UK Climate 2023. International Journal of Climatology. https://doi.org/10.1002/joc.8553.
Met Office (2024) Past weather events. https://www.metoffice.gov.uk/weather/learn-about/past-uk-weather-events. (Accessed: 10 December 2024).
Howarth C et al. (2024) Turning up the heat: Learning from the summer 2022 heatwaves in England to inform UK policy on extreme heat. London: Grantham Research Institute on Climate Change and the Environment, London School of Economics and Political Science. https://www.lse.ac.uk/granthaminstitute/wp-content/uploads/2024/02/Turning-up-the-heat-learning-from-the-summer-2022-heatwaves-in-England-to-inform-UK-policy-on-extreme-heat.pdf.
Large wildfires are defined as those that are greater than 30 hectares in extent.
UK Government (2022) UK Climate Change Risk Assessment 2022. https://www.gov.uk/government/publications/uk-climate-change-risk-assessment-2022.
Crippa et al. (2024) GHG emissions of all world countries, Publications Office of the European Union, Luxembourg, doi:10.2760/4002897, JRC138862.
Friedlingstein, P. et al (2023) Global Carbon Budget 2023, Earth Syst. Sci. https://doi.org/10.5194/essd-15-5301-2023.
Climate Change Committee (2008) Building a low-carbon economy – the UK’s contribution to tackling climate change. https://www.theccc.org.uk/publication/building-a-low-carbon-economy-the-uks-contribution-to-tackling-climate-change-2/.
Climate Change Committee (2010) The Fourth Carbon Budget – reducing emissions through the 2020s. https://www.theccc.org.uk/publication/the-fourth-carbon-budget-reducing-emissions-through-the-2020s-2/.
Climate Change Committee (2015) Advice on the fifth carbon budget. https://www.theccc.org.uk/publication/the-fifth-carbon-budget-the-next-step-towards-a-low-carbon-economy/.
Climate Change Committee (2020) Sixth Carbon Budget. https://www.theccc.org.uk/publication/sixth-carbon-budget/.
UK Government (2009) The Carbon Budget Order 2009. https://www.legislation.gov.uk/uksi/2009/1259/made.
UK Government (2011) The Carbon Budget Order 2011. https://www.legislation.gov.uk/uksi/2011/1603/made.
UK Government (2016) The Carbon Budget Order 2016. https://www.legislation.gov.uk/uksi/2016/785/made.
UK Government (2021) The Carbon Budget Order 2021. https://www.legislation.gov.uk/uksi/2021/750/contents/made.
This is the change to 2022 rather than 2023.
Where we refer to ‘today’, we typically mean the latest year for which data was available at the time of analysis. In most sectors this is 2023, but in some areas it will be 2022.
Department for Energy Security and Net Zero (2023) Energy and emissions projections 2022 to 2040. https://www.gov.uk/government/publications/energy-and-emissions-projections-2022-to-2040.
HM Treasury (2022) The green book. https://www.gov.uk/government/publications/the-green-book-appraisal-and-evaluation-in-central-government/the-green-book-2020.
Department for Transport (2022) National road traffic projections. https://www.gov.uk/government/publications/national-road-traffic-projections.
In aviation, a small annual improvement to aircraft efficiencies is built into the DfT model and therefore into our baseline.
AFRY (2024) About BID3. https://bid3.afry.com/publicpages/about-bid3.html.
The citizens’ panel did not focus on appropriate levels of action (for example, the level of meat reduction or pace of heat pump deployment), but took these as given, and explored what would make these actions accessible and affordable.
There are interdependencies between these actions (for example, technology can enable reductions in demand).
In our emissions modelling, we generally account for emissions reductions due to measures to reduce demand for high-carbon activities (including low-carbon choices and efficiencies) first, before the impact of low-carbon technologies. The abatement for these measures therefore shows what these measures would achieve with the baseline mix of technologies.
Department for Energy Security and Net Zero (2021) Valuing greenhouse gas emissions in policy appraisal. https://www.gov.uk/government/publications/valuing-greenhouse-gas-emissions-in-policy-appraisal.
Bloomberg New Energy Finance (2023) Battery price survey. https://about.bnef.com/blog/lithium-ion-battery-pack-prices-hit-record-low-of-139-kwh/.
Our World in Data (2024) Solar panel prices have fallen by around 20% every time global capacity doubled. https://ourworldindata.org/data-insights/solar-panel-prices-have-fallen-by-around-20-every-time-global-capacity-doubled.
Way, R. et al (2022) Empirically grounded technology forecasts and the energy transition. https://www.cell.com/joule/fulltext/S2542-4351(22)00410-X.
International Energy Agency (2023) ETP clean energy technology guide. https://www.iea.org/data-and-statistics/data-tools/etp-clean-energy-technology-guide.
We use the International Energy Agency’s framework and assessment as the basis for our TRLs, but we deviate from these in some areas based on our understanding of the latest evidence. For example, hydrogen aircraft were excluded from consideration because their development is not sufficiently well advanced to give confidence that they will be ready to play a significant role by 2050. We have also minimised reliance on laboratory-grown meat, as this is likely at or below TRL 6.
Gross, R. et al (2018) How long does innovation and commercialisation in the energy sectors take? https://www.sciencedirect.com/science/article/pii/S0301421518305901.
Bloomfield, H. (2025) Reasonable worst-case stress test scenarios for the UK energy sector in the context of the changing climate.
Nesta (2022) How to scale up a highly skilled heat pump industry. https://www.nesta.org.uk/report/how-to-scale-a-highly-skilled-heat-pump-industry/.
Environmental Audit Committee (2024) Enabling sustainable electrification of the economy. https://publications.parliament.uk/pa/cm5804/cmselect/cmenvaud/278/report.html.
Ofgem (2024) Preparing for a faster, more efficient electricity connections process. https://www.ofgem.gov.uk/blog/preparing-faster-more-efficient-electricity-connections-process.
The interaction between the factors described in this section can be complex in driving consumer and business purchasing decisions. We follow a similar approach to that described for more sustained choices in Section 2.4 in developing our evidence base for which factors are expected to determine these one-off choices.
New Automotive (2024) Price parity 2024. https://newautomotive.org/research/price-parity-2024.
HM Treasury (2006) Stern review: the economics of climate change. https://webarchive.nationalarchives.gov.uk/ukgwa/20100407172811/https:/www.hm-treasury.gov.uk/stern_review_report.html.
Energy UK and One Home (2024) Energy efficiency week 2024 polling report. https://www.energy-uk.org.uk/publications/energy-efficiency-week-2024-polling-report/.
Rogers, E.M. (1962) Diffusion of innovations. Springer VS, Wiesbaden. https://doi.org/10.1007/978-3-658-09923-7_9.
Carbon Tracker Initiative (2023) Gradually, then suddenly: the power of S-curves. https://carbontracker.org/s-curves-in-the-driving-seat-of-the-energy-transition/.
Davis, F.D. (1989) Perceived usefulness, perceived ease of use, and user acceptance of information technology. https://doi.org/10.2307/249008.
Nash, N. et al (2017) Climate-relevant behavioral spillover and the potential contribution of social practice theory. https://wires.onlinelibrary.wiley.com/doi/abs/10.1002/wcc.481.
Department for Energy Security and Net Zero (2024) DESNZ Public Attitudes Tracker: Net Zero and climate change Summer 2024, UK. https://assets.publishing.service.gov.uk/media/671a44b2593bb124be9c1445/desnz-pat-summer-2024-net-zero-and-climate-change.pdf.
Savanta (2023) Savanta eco segmentation: insight to power a greener economy. https://info.savanta.com/savanta-sustainability-segmentation-2022-pdf.
Opinion (2022) Nordic EV Barometer 2021. https://www.nordicenergy.org/wordpress/wp-content/uploads/2021/05/Nordic-EV-barometer-2021-ENG-1.pdf.
Institute for Government (2020) Net Zero: how Government can achieve its climate change target. https://www.instituteforgovernment.org.uk/publication/report/net-zero-how-government-can-meet-its-climate-change-target.
UK Parliamentary Office of Science and Technology (2021) Woodland creation. https://post.parliament.uk/research-briefings/post-pn-0636/.
This section covers our approach to shifts that involve repeatedly choosing lower-carbon alternatives or a repeated overall reduction in high-carbon activities. It does not include the role of choices in one-off purchases of low-carbon technology (for example, purchase of a heat pump or an EV), which fall within the considerations for technology roll-out in Section 2.3.
International Transport Forum (2017) Quantifying the socio-economic benefits of transport. https://www.oecd.org/en/publications/2017/01/quantifying-the-socio-economic-benefits-of-transport_g1g742ae.html.
International Energy Agency (2017) Capturing the multiple benefits of energy efficiency. https://www.iea.org/reports/capturing-the-multiple-benefits-of-energy-efficiency.
World Economic Forum (2023) Consumers want sustainable options. What food producers, suppliers, and retailers can do now. https://www.weforum.org/stories/2023/01/consumer-power-net-zero-food-producer-retailer-davos23/.
UK Energy Research Centre (2024) UK public is becoming more ‘carbon capable’ – here’s what that means. https://ukerc.ac.uk/news/uk-public-is-becoming-more-carbon-capable-heres-what-that-means/.
WSP for the Climate Change Committee (2023) Understanding the requirements and barriers for modal shift. https://www.theccc.org.uk/publication/understanding-the-requirements-and-barriers-for-modal-shift-wsp/.
Milner, J. et al (2023) Impact on mortality of pathways to net zero greenhouse gas emissions in England and Wales: a multisectoral modelling study. https://www.thelancet.com/journals/lanplh/article/PIIS2542-5196(22)00310-2/.
Davies, M. (2023) Policy and implementation for climate and health equity. https://wellcome.org/grant-funding/people-and-projects/grants-awarded/policy-and-implementation-climate-health-equity.
Centre for Climate Change and Social Transformations for the Climate Change Committee (2023) The implications of behavioural science for effective climate policy. https://www.theccc.org.uk/publication/the-implications-of-behavioural-science-for-effective-climate-policy-cast/.
NatCen Social Research (2020) Impact of interventions encouraging a switch from cars to more sustainable modes of transport. https://www.gov.uk/government/publications/switching-to-sustainable-transport-a-rapid-evidence-assessment.
Raghoeber, S., Van Kleef, E, and De Vet, E. (2020) Increasing the proportion of plant-based foods available to shift social consumption norms and food choice among non-vegetarians. https://www.mdpi.com/2071-1050/12/13/5371.
Boston Consulting Group (2022) Nudging consumers towards sustainability. https://www.bcg.com/publications/2022/nudging-consumers-to-make-sustainable-choices.
Oxera (2022) Decarbon-nudge? https://www.oxera.com/insights/agenda/articles/decarbon-nudge/.
Department for Energy Security and Net Zero (2023) Unlocking resource efficiency. https://www.gov.uk/government/publications/unlocking-resource-efficiency.
Department for Energy Security and Net Zero (2024) Business energy efficiency campaign. https://businessenergyefficiency.campaign.gov.uk/.
Department for Energy Security and Net Zero (2024) Household energy efficiency statistics, detailed report 2023. https://www.gov.uk/government/statistics/household-energy-efficiency-statistics-detailed-report-2023.
Our analysis covers emissions of all targeted GHGs in the Climate Change Act, aggregated using the GWP100 metric.
Department for Energy Security and Net Zero (2024) UK shows international leadership in tackling climate crisis. https://www.gov.uk/government/news/uk-shows-international-leadership-in-tackling-climate-crisis.
HM Government (2021) Explanatory memorandum to the carbon budget order 2021. https://www.legislation.gov.uk/uksi/2021/750/pdfs/uksiem_20210750_en.pdf.
Intergovernmental Panel on Climate Change (2013) Climate change 2013: the physical science basis. Contribution of Working Group I to the Fifth Assessment Report of the Intergovernmental Panel on Climate Change. https://www.ipcc.ch/report/ar5/wg1/.
Greenhouse Gas Protocol (2016) Global warming potential values. https://ghgprotocol.org/sites/default/files/Global-Warming-Potential-Values%20%28Feb%2016%202016%29_1.pdf.
Department for Energy Security and Net Zero and Department for Business, Energy and Industrial Strategy (2021-2024) UK greenhouse gas emissions statistics: planned methodology changes. https://www.gov.uk/government/publications/planned-methodology-changes-for-uk-greenhouse-gas-emissions.
Department for Transport (2024) Road traffic estimates in Great Britain: 2023. https://www.gov.uk/government/statistics/road-traffic-estimates-in-great-britain-2023.
Innovate UK (2024) UK CHEM 2050 – Sustainable carbon ambition for the UK chemicals industry. https://iuk.ktn-uk.org/wp-content/uploads/2024/08/IUK-Sustainable-Carbon-Report.pdf.
The UK is a participant in the Global Methane Pledge, which is a collective effort to reduce global methane emissions by at least 30% from 2020 levels by 2030.
While these removals should eventually be paid for by the relevant polluting sectors (notably aviation), government support is likely to be needed in the near term.
National Aeronautics and Space Administration (2023) Major greenhouse gas sources, lifespans, and possible added heat. https://science.nasa.gov/resource/graphic-major-greenhouse-gas-sources-lifespans-and-possible-added-heat/.
UK Woodland Carbon Code (2011) Managing risks and permanence. https://www.woodlandcarboncode.org.uk/standard-and-guidance/2-project-governance/2-3-management-of-risks-and-permanence.
Our baseline generally maintains the stock of low-carbon technologies that exist today (primarily renewable energy and EVs), making adjustments for GDP and population growth (see Chapter 2).
All our cost analysis is in 2023 prices, unless otherwise stated.
HM Treasury (2022), The Green Book. https://www.gov.uk/government/publications/the-green-book-appraisal-and-evaluation-in-central-government/the-green-book-2020.
Office for National Statistics (ONS) (2016) National accounts. https://www.ons.gov.uk/economy/nationalaccounts/uksectoraccounts/methodologies/nationalaccounts.
Department for Energy Security and Net Zero (DESNZ) (2012) Green Book supplementary guidance: valuation of energy use and greenhouse gas emissions for appraisal. https://www.gov.uk/government/publications/valuation-of-energy-use-and-greenhouse-gas-emissions-for-appraisal.
Office for Budget Responsibility (OBR) (2023) Economic and fiscal outlook – March 2023. https://obr.uk/efo/economic-and-fiscal-outlook-march-2023/.
The World Bank (2023) Gross fixed capital formation (% of GDP) – United Kingdom, OECD members. https://data.worldbank.org/indicator/NE.GDI.FTOT.ZS?locations=GB-OE.
The central carbon value sets out the value to UK society of abating 1 tCO2e (tonne of carbon dioxide equivalent), using central assumptions.
Measures are aggregated in Figure 4.6, using a weighted average of abatement. Some measures which abate very little have an abatement cost above the carbon price. However, these are not significant once all measures are combined.
Note that these quantified co-impacts are not included in the whole-economy costs presented in Section 4.2.1.
This is based on OBR’s projected total managed expenditure from 2025 to 2029. For 2030 onwards, we assume an average of total managed public expenditure from 2025 to 2029. We make no adjustments from 2030 for GDP, effectively assuming for these calculations that it does not change from levels in 2025 to 2029.
Office of Budget Responsibility (OBR) (2021) Fiscal Risks Report. https://obr.uk/docs/dlm_uploads/Fiscal_risks_report_July_2021.pdf.
Office for National Statistics (ONS) (2022) Recent and upcoming changes to public sector finance statistics: January 2022. https://www.ons.gov.uk/economy/governmentpublicsectorandtaxes/publicsectorfinance/articles/developmentofpublicsectorfinancestatistics/january2022.
Office for National Statistics (ONS) (2024) UK Environmental Taxes. https://www.ons.gov.uk/economy/environmentalaccounts/bulletins/ukenvironmentaltaxes/2023.
All our price-based indicators are in 2023 prices.
Heating and Hot Water Industry Council (2021) Boilers bounce back as consumers invest in home renovation. https://www.hhic.org.uk/news/boilers-bounce-back-as-consumers-invest-in-home-renovation.
Department for Energy Security and Net Zero (DESNZ) (2024) British Industry Supercharger gives huge boost to UK businesses. https://www.gov.uk/government/news/huge-boost-for-uk-industry-as-government-supercharger-rolls-out.
We show this indicator as a range because the impact of EV rebound effects (that is, the potential for the lower cost of motoring for electric cars to lead to an increase in car-kilometres) is uncertain and could be managed through policies. We do include such effects in our modelling of the electricity supply required to support electrification of transport.
Department for Environment Food and Rural Affairs (Defra) (2024) Family food survey. https://www.gov.uk/government/statistics/family-food-fye-2023.
Pastorino et al. (2023) The future of meat and dairy consumption in the UK: exploring different policy scenarios to meet net zero targets and improve population health. https://www.cambridge.org/core/journals/global-sustainability/article/future-of-meat-and-dairy-consumption-in-the-uk-exploring-different-policy-scenarios-to-meet-net-zero-targets-and-improve-population-health/8F4D09F2A88EF2FA16E2E237B5F30B21.
The aviation sector uses 2025 as a reference year for flying demand as 2023 demand still appears to be rebounding from the COVID-19 pandemic and because 2025 is when the high carbon value is introduced in the modelling (see Section 7.6).
World Bank (2023) Mobile cellular subscriptions (per 100 people) – United Kingdom. https://data.worldbank.org/indicator/IT.CEL.SETS.P2?locations=GB.
Institute of Refrigeration (2016) Refrigeration at home timeline. https://www.fantasticfridges.com/YoungLearners/RefrigerationatHometimeline.
World Bank (2023) Individuals using the internet (% of population) – United Kingdom. https://data.worldbank.org/indicator/IT.NET.USER.ZS?locations=GB.
Society of Motor Manufacturers and Traders (2024) Brits enjoy best ever EV choice with more than a hundred models now available. https://www.smmt.co.uk/2024/05/brits-enjoy-best-ever-ev-choice-with-more-than-a-hundred-models-now-available/.
European Heat Pump Association (2024) European heat pump market and statistics report 2024. https://www.ehpa.org/product/2024-market-report/.
Bloomberg New Energy Finance (2023) Battery price survey. https://about.bnef.com/blog/lithium-ion-battery-pack-prices-hit-record-low-of-139-kwh/.
Our World in Data (2024) Solar panel prices have fallen by around 20% every time global capacity doubled. https://ourworldindata.org/data-insights/solar-panel-prices-have-fallen-by-around-20-every-time-global-capacity-doubled.
Rogers, E.M. (1962) Diffusion of innovations. Springer VS, Wiesbaden. https://doi.org/10.1007/978-3-658-09923-7_9.
Regen UK (2023) Making the most of contracts for difference to deliver wider energy system benefits. https://www.regen.co.uk/making-the-most-of-contracts-for-difference-to-deliver-wider-energy-system-benefits/.
Department for Energy Security and Net Zero (2024) Government secures record pipeline of clean cheap energy projects. https://www.gov.uk/government/news/government-secures-record-pipeline-of-clean-cheap-energy-projects.
Vivid Economics for the Climate Change Committee (2019) The future of carbon pricing in the UK. https://www.theccc.org.uk/publication/the-future-of-carbon-pricing-in-the-uk-vivid-economics/.
Williams, T. (1981) A history of the British gas industry. Oxford; New York. Oxford University Press.
Sheail, J. (1991) Power in trust: the environmental history of the Central Electricity Generating Board.
Department for Transport (2024) Road length (miles) by road type in Great Britain, 1914 to 2023. https://assets.publishing.service.gov.uk/media/65fb00519316f5001164c41a/rdl0103.ods.
United Nations Climate Change Katowice Committee on Impacts (2022) Implementation of just transition and economic diversification strategies. https://unfccc.int/sites/default/files/resource/A%20compilation%20of%20best%20practices%20on%20JT%20and%20EDT.pdf.
Department for Energy Security and Net Zero (2023) New laws passed to bolster energy security and deliver Net Zero. https://www.gov.uk/government/news/new-laws-passed-to-bolster-energy-security-and-deliver-net-zero.
Department for Energy Security and Net Zero (2024) Strategic spatial energy plan: commission to NESO. https://www.gov.uk/government/publications/strategic-spatial-energy-plan-commission-to-neso.
Thomas, R.M. and edie (2024) How can the UK crowd in private finance for a sustainable future?. https://www.edie.net/how-can-the-uk-crowd-in-private-finance-for-a-sustainable-future/.
Confederation of British Industry (2021) Driving green growth and the transition to Net Zero. https://www.cbi.org.uk/our-campaigns/driving-green-growth-and-the-transition-to-net-zero/.
Money Saving Expert (2024) Green mortgages. https://www.moneysavingexpert.com/mortgages/green-mortgages/. (Accessed: 29 November 2024).
Nationwide (2024) Nationwide customers can borrow up to £20,000 interest free to green their homes. https://www.nationwidemediacentre.co.uk/news/nationwide-customers-can-borrow-up-to-gbp-20-000-interest-free-to-green-their-homes/. (Accessed: 29 November 2024).
Resolution Foundation (2022) Enduring strengths: the economy 2030 inquiry. https://www.resolutionfoundation.org/app/uploads/2022/04/Enduring-strengths.pdf.
Institute for Public Policy Research (2024) Manufacturing matters. https://www.ippr.org/articles/manufacturing-matters.
US Government Accountability Office (2021) Improved performance planning could strengthen technology transfer. https://www.gao.gov/assets/gao-21-202.pdf.
Oliver Wyman and World Economic Forum (2023) Financing the transition to a Net Zero future. https://www.oliverwyman.com/our-expertise/insights/2021/oct/financing-the-transition-to-a-net-zero-future.html.
Health and Safety Executive (2009) Gas safe register. https://www.hse.gov.uk/gas/domestic/newschemecontract.html.
BetaTeach, IMS Heat Pumps, and Nesta (2024) How to install more heat pumps: insights from a survey of heating engineers. https://www.nesta.org.uk/report/how-to-install-more-heat-pumps-insights-from-a-survey-of-heating-engineers/.
Climate Change Committee (2024) Progress in reducing emissions in Scotland – 2023 report to Parliament. https://www.theccc.org.uk/publication/progress-in-reducing-emissions-in-scotland-2023-report-to-parliament/.
Climate Change Committee (2023) Progress report: reducing emissions in Wales. https://www.theccc.org.uk/publication/2023-progress-report-reducing-emissions-in-wales/.
National Audit Office, Audit Scotland, Audit Wales and Northern Ireland Audit Office (2023) Approaches to achieving Net Zero across the UK. https://www.nao.org.uk/reports/approaches-to-achieving-net-zero-across-the-uk/.
Climate Emergency UK and mySociety (2024) Climate action plan explorer. https://cape.mysociety.org/councils/.
Local Government Association (2024) Local government white paper. https://www.local.gov.uk/publications/local-government-white-paper.
Convention of Scottish Local Authorities (2024) Council leaders seek urgent Budget meeting with Deputy First Minister. https://www.cosla.gov.uk/news/2024/council-leaders-seek-urgent-budget-meeting-with-deputy-first-minister.
UK100 (2024) Local Net Zero 2.0. https://www.uk100.org/publications/local-net-zero-20-moment-deliver.
Local Government Association (2021) Delivering local Net Zero. https://www.local.gov.uk/publications/delivering-local-net-zero.
National Audit Office (2021) Local government and Net Zero in England. https://www.nao.org.uk/reports/local-government-and-net-zero-in-england/.
Department for Levelling Up, Housing, and Communities (2023) Greater Manchester Combined Authority Trailblazer deeper devolution deal. https://www.gov.uk/government/publications/greater-manchester-combined-authority-trailblazer-deeper-devolution-deal/greater-manchester-combined-authority-trailblazer-deeper-devolution-deal.
Department for Energy Security and Net Zero (DESNZ) (2024) DESNZ Public Attitudes Tracker: Net Zero and climate change Summer 2024, UK. https://assets.publishing.service.gov.uk/media/671a44b2593bb124be9c1445/desnz-pat-summer-2024-net-zero-and-climate-change.pdf.
Ipsos (2023) One in four Britons think climate change is out of control. https://www.ipsos.com/en-uk/one-four-britons-think-climate-change-out-control.
Department for Energy Security and Net Zero (DESNZ) (2024) DESNZ Public Attitudes Tracker: Net Zero and climate change Summer 2024, UK. https://assets.publishing.service.gov.uk/media/671a44b2593bb124be9c1445/desnz-pat-summer-2024-net-zero-and-climate-change.pdf.
BEIS (2020) BEIS Public Attitudes Tracker (September 2020, wave 35, UK). https://assets.publishing.service.gov.uk/media/5fac0fe0e90e075c51b736d6/BEIS_PAT_W35_-_Key_findings.pdf.
Ipsos (2024) Technology Tracker: wave 11. https://assets.publishing.service.gov.uk/media/66f3dc255316e21be6c4bc37/dft-tchnology-tracker-wave-11.pdf.
Department for Energy Security and Net Zero (DESNZ) (2024) DESNZ Public Attitudes Tracker: heat and energy in the home Winter 2023, UK. https://assets.publishing.service.gov.uk/media/65fc5d5e65ca2f001b7da82c/DESNZ_Public_Attitudes_Tracker_Winter_2023_Heat_and_Energy_in_the_Home__Revised_.pdf.
Civil Aviation Authority (2024) Flying in 2023. https://www.caa.co.uk/publication/download/20986.
Civil Aviation Authority (2022) UK aviation consumer survey, wave 10 (autumn 2021), environmental findings. https://www.caa.co.uk/publication/download/19366.
Bussel et al. (2022) Consumers’ perceptions on food-related sustainability: A systematic review. https://www.sciencedirect.com/science/article/pii/S095965262200542X.
Centre for Climate and Social Transformations (2022) The road to net zero: UK public preferences for low-carbon lifestyles. https://cast.ac.uk/wp-content/uploads/2022/09/CM_UOB_49-CAST-Report_v5_FINAL_27.9.22.pdf.
Ipsos (2022) Survey of consumer perceptions of alternative, or novel, sources of protein. https://www.food.gov.uk/print/pdf/node/7991.
Ipsos (2024) Technology tracker: wave 11. https://assets.publishing.service.gov.uk/media/66f3dc255316e21be6c4bc37/dft-tchnology-tracker-wave-11.pdf.
YouGov (2024) Climate barometer public poll – Apr 2024. https://d3nkl3psvxxpe9.cloudfront.net/documents/Climate_Barometer_Public_April2024_UK_Climate_Barometer_client_website.pdf.
Department for Energy Security and Net Zero (DESNZ) (2024) DESNZ public attitudes tracker: heat and energy in the home winter 2023, UK. https://assets.publishing.service.gov.uk/media/65fc5d5e65ca2f001b7da82c/DESNZ_Public_Attitudes_Tracker_Winter_2023_Heat_and_Energy_in_the_Home__Revised_.pdf.
Energy Systems Catapult (2022) All housing types are suitable for heat pumps, finds Electrification of Heat project. https://es.catapult.org.uk/news/electrification-of-heat-trial-finds-heat-pumps-suitable-for-all-housing-types/.
Westlake, S., Demski, C. and Pidgeon, N. (2024) Leading by example from high-status individuals: exploring a crucial missing link in climate change mitigation. https://www.nature.com/articles/s41599-024-03787-8.
Intergovernmental Science-Policy Platform on Biodiversity and Ecosystem Services (2022) The global assessment report on biodiversity and ecosystem services. https://www.ipbes.net/global-assessment.
ARUP (2022), Addressing overheating risk in UK homes. https://www.theccc.org.uk/publication/addressing-overheating-risk-in-existing-uk-homes-arup/.
Institut National de l’Information Géographique et Forestiere (2024) Inventaire forestier national: mémento édition 2024. https://inventaire-forestier.ign.fr/spip.php?rubrique219.
Climate Change Committee and UK Centre for Ecology and Hydrology (UKCEH) (2025) The Seventh Carbon Budget land use modelling report. https://www.theccc.org.uk/publication/land-use-modelling-report-ukceh.
Office for National Statistics (2023) 2020-based interim national population projections: year ending June 2022 estimated international migration variant. https://www.ons.gov.uk/peoplepopulationandcommunity/populationandmigration/populationprojections/datasets/2020basedinterimnationalpopulationprojectionsyearendingjune2022estimatedinternationalmigrationvariant.
Office for Budget Responsibility (2023) Economic and fiscal outlook – March 2023. https://obr.uk/efo/economic-and-fiscal-outlook-march-2023/.
Department for Transport (2024) Aviation modelling framework. https://www.gov.uk/government/publications/aviation-modelling-framework.
Fouquet, R. and O’Garra, T. (2022) In pursuit of progressive and effective climate policies: Comparing an air travel carbon tax and a frequent flyer levy. https://doi.org/10.1016/j.enpol.2022.113278.
Seetram et al. (2018) Estimating willingness to pay air passenger duty. Annals of Tourism Research. https://www.sciencedirect.com/science/article/abs/pii/S0160738318300689.
National Atmospheric Emissions Inventory (2024) About the inventory. https://naei.energysecurity.gov.uk/about-inventory.
United Nations Framework Convention on Climate Change (2022) United Kingdom. 2022 National Inventory Report (NIR). Annex Issue 1. https://unfccc.int/documents/461922.
United Nations Framework Convention on Climate Change (2018) Proposal by the President. https://unfccc.int/sites/default/files/resource/Informal%20Compilation_proposal%20by%20the%20President_rev.pdf.
Forster, P. et al (2021) The Earth’s Energy Budget, Climate Feedbacks, and Climate Sensitivity. In Climate Change 2021: The Physical Science Basis. Contribution of Working Group I to the Sixth Assessment Report of the Intergovernmental Panel on Climate Change. Cambridge University Press. https://www.ipcc.ch/report/ar6/wg1/downloads/report/IPCC_AR6_WGI_Chapter07.pdf.
Department for Energy Security and Net Zero (2023) Fossil fuel price assumptions: 2023. https://www.gov.uk/government/publications/fossil-fuel-price-assumptions-2023.
Met Office (2022) UKCP18 key results. https://www.metoffice.gov.uk/binaries/content/assets/metofficegovuk/pdf/research/ukcp/ukcp18-key-results.xlsx.
When combining uncertainties, uncertainties from different sources are assumed to be uncorrelated apart from GDP and population. Uncertainties from a given source are assumed to be correlated between sectors (so for example, if gas prices are low for one sector, they are also assumed to be low for all others), except for inventory uncertainties which are not correlated between sectors.
Office for National Statistics (2018) The 2008 recession 10 years on. https://www.ons.gov.uk/economy/grossdomesticproductgdp/articles/the2008recession10yearson/2018-04-30.
Center for Automotive Research (2022) Automotive Supply Chain Update. https://www.cargroup.org/auto-supply-chain-update/.
Bloomberg New Energy Finance (2022) Battery price survey 2022. https://about.bnef.com/blog/lithium-ion-battery-pack-prices-rise-for-first-time-to-an-average-of-151-kwh/.
European Investment Bank (2024) Invested in renewables. The only way forward. http://www.eib.org/en/essays/europe-energy-transition-renewable.
European Heat Pump Association (2024) RePowerEU and the EU heat pump action plan. https://www.ehpa.org/policy/repowereu-and-the-eu-heat-pump-action-plan/.
Transport and Environment (2022) T&E’s analysis of electric car lifecycle CO2 emissions. https://www.transportenvironment.org/uploads/files/TE_LCA_Update-June_corrected.pdf.
Global CCS Institute (2020) Scaling up the CCS market to deliver Net Zero emissions. https://www.globalccsinstitute.com/wp-content/uploads/2020/04/Thought-Leadership-Scaling-up-the-CCS-Market-to-Deliver-Net-Zero-Emissions-Digital-6.pdf.
Our contingency actions to accelerate the roll-out of low-carbon technology in the electricity supply sector would result in unabated gas providing 5% of generation under an average weather year in 2030.
Figure based on CCC analysis, calculated by taking historical test-cycle results uprated using real-world emissions data.
Department for Transport (2024) VEH1103a: Vehicle licensing statistics data tables. https://www.gov.uk/government/statistical-data-sets/vehicle-licensing-statistics-data-tables.
Metz, D. (2024) Driving Change. Travel after the pandemic. https://drivingchange.org.uk/travel-after-the-pandemic/.
Independent Transport Commission (2024) The longer-term impacts of the Covid-19 pandemic on Transport and Land Use in Britain. https://www.theitc.org.uk/wp-content/uploads/2024/03/ITC-Impacts-of-the-Pandemic-Report-March-2024.pdf.
When we refer to electric vehicles, we include only battery-electric vehicles. Hybrids (including plug-in hybrids) are not included in these percentage shares.
Department for Transport (2024) VEH1103a: Vehicle licensing statistics data tables. https://www.gov.uk/government/statistical-data-sets/vehicle-licensing-statistics-data-tables.
New Automotive (2024) Price parity 2024: the final mile. https://newautomotive.org/research/price-parity-2024.
Bloomberg New Energy Finance (2023) Electric vehicle outlook 2023. https://assets.bbhub.io/professional/sites/24/2431510_BNEFElectricVehicleOutlook2023_ExecSummary.pdf.
Carello, F. (2024) Ayvens. Examining total cost of ownership: battery electric vs internal combustion engine vehicles. https://www.ayvens.com/en-cp/blog/total-cost-of-ownership/tco-ev-ice-comparison/.
Auto Trader (2024) The road to 2035 by Auto Trader. https://www.autotraderroadto2035.co.uk/#:~:text=The%20Road%20to%202035%20report,new%20petrol%20and%20diesel%20cars.
International Council on Clean Transportation (2022) Real-world usage of plug-in hybrid vehicles in Europe: a 2022 update on fuel consumption, electric driving, and CO2 emissions. https://theicct.org/publication/real-world-phev-use-jun22/.
Department for Transport (2024) Electric vehicle public charging infrastructure statistics: July 2024 tables. https://www.gov.uk/government/statistics/electric-vehicle-public-charging-infrastructure-statistics-july-2024.
UK Research and Innovation (2024) Demonstrating the transition to electric HGVs. https://www.ukri.org/who-we-are/how-we-are-doing/research-outcomes-and-impact/innovate-uk/demonstrating-the-transition-to-electric-hgvs/.
Environmental Resources Management (ERM) (2025) ZEV HDV uptake trajectories modelling assumptions. https://www.theccc.org.uk/publication/zev-hdv-uptake-trajectories-modelling-assumptions-erm/.
Ford Trucks Global (2021) A pioneering project from Ford Trucks to shape the future of logistics: NextETRUCK. https://fordtrucksglobal.com/next-etruck.
Mercedez Benz Trucks (no date) eMobility – The eActros and its services. https://www.mercedes-benz-trucks.com/en_GB/emobility/world/our-offer/eactros-and-services.html.
Volvo Trucks (2024) Breakthrough: Volvo to launch electric truck with 600 km range. https://www.volvotrucks.com/en-en/news-stories/press-releases/2024/sep/breakthrough-volvo-to-launch-electric-truck-with-600-km-range.html.
Environmental Resources Management (ERM) (2025) ZEV HDV uptake trajectories modelling assumptions. https://www.theccc.org.uk/publication/zev-hdv-uptake-trajectories-modelling-assumptions-erm/.
Mobilität in Deutschland (2017) Mobilität in Tabellen. https://mobilitaet-in-tabellen.dlr.de/login.html?brd.
Federal Statistical Office (2023) Population’s transport behaviour, synthesis tables. https://opendata.swiss/en/dataset/verkehrsverhalten-der-bevolkerung-synthesetabellen1.
CBS StatLine (2024) Mobility; per person, modes of travel, purposes of travel and regions. https://opendata.cbs.nl/statline/#/CBS/en/dataset/84710ENG/table?ts=1695198666028.
Department for Transport (2024) NTS0303: Average number of trips, stages, miles and time spent travelling by mode: England, 2002 onwards. https://www.gov.uk/government/statistical-data-sets/nts03-modal-comparisons#trips-stages-distance-and-time-spent-travelling.
Department for Transport (2023) Zero emissions vehicle mandate and non-ZEV efficiency requirements consultation-stage cost benefit analysis. https://assets.publishing.service.gov.uk/media/64537b34c33b46000cf5e631/zev-mandate-cost-benefit-analysis.pdf.
Climate Change Committee (2023) 2023 Progress Report to Parliament. https://www.theccc.org.uk/publication/2023-progress-report-to-parliament/.
Heritage Railway Association (no date) Key issues. https://www.hra.uk.com/resources/key-issues-for-heritage-rail.
International Council on Clean Transportation (2022) Assessment of light-duty electric vehicle costs and consumer benefits in the United States in the 2022–2035 time frame. https://theicct.org/publication/ev-cost-benefits-2035-oct22/.
This estimate uses a different methodology to the CCC analysis used in our pathway and Table 7.1.1, and therefore it is not included in our indicator charts in Figure 7.1.4.
New Automotive (2024) Price parity 2024: the final mile. https://newautomotive.org/research/price-parity-2024.
New Automotive (2024) Price parity 2024: the final mile. https://newautomotive.org/research/price-parity-2024.
Environmental Resources Management (ERM) (2025) Understanding the tail of the electric vehicle transition. https://www.theccc.org.uk/publication/understanding-the-tail-of-the-electric-vehicle-transition-erm/.
Environmental Resources Management (ERM) (2025) Understanding the tail of the electric vehicle transition. https://www.theccc.org.uk/publication/understanding-the-tail-of-the-electric-vehicle-transition-erm/.
PwC (2025) The distribution of climate action co-benefits – NZCM Methodology Report. Unpublished.
BMW Group (2023) MINI Plant Oxford goes Electric: £600m investment for all-electric MINI production in the UK. https://www.press.bmwgroup.com/united-kingdom/article/detail/T0436869EN_GB/mini-plant-oxford-goes-electric:-%C2%A3600m-investment-for-all-electric-mini-production-in-the-uk?language=en_GB.
Vauxhall (no date) Vauxhall Electric – Electrifying Britain. https://www.vauxhall.co.uk/electric/our-electric-mission.html.
Leggett, T (2021) Jaguar car brand to be all-electric by 2025. BBC News. https://www.bbc.co.uk/news/business-56072019.
Department for Business and Trade (2024) UK trade in numbers. https://www.gov.uk/government/statistics/uk-trade-in-numbers/uk-trade-in-numbers-web-version#export-statistics.
Society of Motor Manufacturers and Traders (SMMT) (2024) Motor industry facts. SMMT-Motor-Industry-Facts-2024-August.pdf.
CBI Economics and Energy and Climate Intelligence Unit (ECIU) (2024) Electrifying growth: Exploring what electrification could mean for the UK’s automotive industry. https://www.cbi.org.uk/media/qoxp3pn4/cbi-economics-eciu-ev-sector-report-2024.pdf.
Society of Motor Manufacturers and Traders (2023) UK automotive trade report 2023. https://www.smmt.co.uk/wp-content/uploads/SMMT-Automotive-Trade-Report-2023.pdf.
Society of Motor Manufacturers and Traders (2023) UK automotive trade report 2023. https://www.smmt.co.uk/wp-content/uploads/SMMT-Automotive-Trade-Report-2023.pdf.
Society of Motor Manufacturers and Traders (2024) Key exports data. https://www.smmt.co.uk/industry-topics/europe-and-international-trade/key-exports-data/.
Society of Motor Manufacturers and Traders (2023) UK Automotive trade report 2023. https://www.smmt.co.uk/wp-content/uploads/SMMT-Automotive-Trade-Report-2023.pdf.
AutoExpress (2024) New BYD Seagull will come to the UK in 2025 to rival the Dacia Spring. https://www.autoexpress.co.uk/byd/362943/new-byd-seagull-will-come-uk-2025-rival-dacia-spring.
Stellantis (2024) Leapmotor International introduces the UK’s best value electric cars. https://www.media.stellantis.com/uk-en/leapmotor/press/leapmotor-international-introduces-the-uk-s-best-value-electric-cars.
CBI Economics and Energy and Climate Intelligence Unit (ECIU) (2024) Electrifying growth: Exploring what electrification could mean for the UK’s automotive industry. https://www.cbi.org.uk/media/qoxp3pn4/cbi-economics-eciu-ev-sector-report-2024.pdf.
Transportation Energy Institute (2022) Life cycle analysis comparison: electric and internal combustion engine vehicles. https://www.transportationenergy.org/research/reports/life-cycle-analysis-comparison-electric-and-internlife-cycle-analysis-comparison-electric-and-intern.
Energy and Climate Intelligence Unit (ECIU) (2024) Poll: Most petrol car drivers score just 2 out of 10 for EV knowledge. https://eciu.net/media/press-releases/2024/poll-most-petrol-car-drivers-score-just-2-out-of-10-for-ev-knowledge.
Electricity use in residential buildings also produces indirect emissions, which we account for in the electricity supply sector (see Section 7.5).
Energy-using product standards have historically been used to regulate boiler standards and efficiencies. Since 2018, all gas boilers installed into existing systems in England have been required to have an efficiency of 92%. The Government has supported energy efficiency schemes that have improved the energy performance of UK homes, such as the Energy Company Obligation, which has been running since 2013. Progress on delivering energy efficiency measures has slowed in recent years.
Department for Energy Security and Net Zero (2024) Household Energy Efficiency Statistics. https://www.gov.uk/government/collections/household-energy-efficiency-national-statistics.
Department for Business Energy and Industrial Strategy (2017) Heat in buildings: Boiler Plus. https://assets.publishing.service.gov.uk/media/5a81fde340f0b62305b91e6c/Boiler_Plus_final_policy_and_consultation_response.pdf.
A hybrid heat pump uses a standard heat pump alongside an additional heat source. In our modelling, the most common hybrid is a combination of a heat pump with point-of-use hot water. We do not consider fossil fuel or hydrogen hybrids.
UK Heat Pump Association (no date) UK Heat Pump Association Statistics: Statistics – Heat Pumps. https://www.heatpumps.org.uk/resources/statistics/.
European Heat Pump Association (2024) Market report 2024. https://www.ehpa.org/product/2024-market-report/.
European Heat Pump Association (2024) Market report 2024. https://www.ehpa.org/product/2024-market-report/.
Department for Levelling Up, Housing and Communities (2023) English Housing Survey English Housing Survey. https://www.gov.uk/government/collections/english-housing-survey#2023-to-2024.
Data for efficiencies of heat pumps was primarily taken from the Electrification of Heat demonstrator project run by DESNZ with Energy Systems Catapult in 2023.
Energy Systems Catapult (2025) Electrification of heat demonstration project. Unpublished.
This calculation assumes households do not increase their overall heat demand to reflect lower energy prices and higher levels of energy efficiency, with benefits only accruing due to higher minimum temperatures in winter from higher heat retention. In practice, some households in fuel poverty may increase their heat demand if bills fall, leading to larger co-benefits, but smaller bill savings – this is not modelled here.
Climate Change Committee (2019) UK housing fit for the future. https://www.theccc.org.uk/wp-content/uploads/2019/02/UK-housing-Fit-for-the-future-CCC-2019.pdf.
The figures are based on the UK Government’s provisional figures for 2023 emissions. For our modelling, we used a higher figure for iron and steel in 2023 (9.8 MtCO2e), which we calculated using UK ETS reporting for 2023. ‘Other industry’, a miscellaneous category comprising a wide range of manufacturing, emitted 10.1 MtCO2e in 2023.
UK Steel (2022) Net Zero Steel: A vision for the future of UK steel production. https://www.makeuk.org/about/uk-steel/net-zero-steel—a-vision-for-the-future-of-uk-steel-production.
Mineral Products Association (2024). Unpublished.
Innovate UK (2024) UK CHEM 2050 – sustainable carbon ambition for the UK chemicals industry. https://iuk.ktn-uk.org/wp-content/uploads/2024/08/IUK-Sustainable-Carbon-Report.pdf.
Office for National Statistics (2024) Regional gross value added (balanced) by industry: all ITL regions. https://www.ons.gov.uk/economy/grossvalueaddedgva/datasets/nominalandrealregionalgrossvalueaddedbalancedbyindustry.
Department for Energy Security and Net Zero (2024) Energy consumption in the UK (ECUK): energy intensity tables, Table I4. https://www.gov.uk/government/statistics/energy-consumption-in-the-uk-2024.
UK Government (2024) UK ETS public reports: UK ETS recorded emissions and surrendered allowances data 2024. https://reports.view-emissions-trading-registry.service.gov.uk/ets-reports.html.
Department for Energy Security and Net Zero (2024) Enabling industrial electrification. call for evidence on fuel-switching to electricity: Summary of responses. https://assets.publishing.service.gov.uk/media/66e013650f4ba0621b086702/electrification-call-for-evidence-formal-summary-of-responses.pdf.
Global CCS Institute (2023) Global status of CCS 2023: scaling up through 2030. https://status23.globalccsinstitute.com.
Glass International (2023) AGC successfully uses hydrogen as fuel in glass production test. https://www.glass-international.com/news/agc-successfully-uses-hydrogen-as-fuel-in-glass-production-test.
Department for Energy Security and Net Zero (2023) Industrial non-road mobile machinery decarbonisation options: techno-economic feasibility study. https://www.gov.uk/government/calls-for-evidence/non-road-mobile-machinery-decarbonisation-options.
Department for Energy Security and Net Zero (2023) Industrial non-road mobile machinery decarbonisation options: techno-economic feasibility study. https://www.gov.uk/government/calls-for-evidence/non-road-mobile-machinery-decarbonisation-options.
Beyond Zero Emissions (2018) Electrifying industry. https://www.bze.org.au/research/report/electrifying-industry.
International Energy Agency (2023) High-temperature heat pumps task 1 – technologies task report. https://heatpumpingtechnologies.org/annex58/wp-content/uploads/sites/70/2023/09/annex-58-task-1-technologies-task-report.pdf.
International Energy Agency (2022) The future of heat pumps. https://www.iea.org/reports/the-future-of-heat-pumps.
International Energy Agency (2023) High-temperature heat pumps task 1 – technologies task report. https://heatpumpingtechnologies.org/annex58/wp-content/uploads/sites/70/2023/09/annex-58-task-1-technologies-task-report.pdf.
Boldrini, A. et al (2024) Flexibility options in a decarbonising iron and steel industry. Renewable and Sustainable Energy Reviews. https://www.sciencedirect.com/science/article/pii/S1364032123008468.
Renewable Thermal Coalition (2023) Thermal batteries: opportunities to accelerate decarbonization of industrial heat. https://www.renewablethermal.org/tes-assessment-report.
Renewable Thermal Coalition (2023) Thermal batteries: opportunities to accelerate decarbonization of industrial heat. https://www.renewablethermal.org/tes-assessment-report.
HM Treasury (2023) Pro-innovation regulation of technologies review. https://www.gov.uk/government/collections/pro-innovation-regulation-of-technologies-review.
UK Green Building Council (2021) Net zero whole life carbon roadmap a pathway to net zero for the UK built environment. https://ukgbc.org/our-work/topics/whole-life-carbon-roadmap/.
Environmental Audit Committee (2022) Building to net zero: costing carbon in construction: first report of session 2022–23. https://committees.parliament.uk/publications/22427/documents/165446/default.
Department for Energy Security and Net Zero (2024) Enabling industrial electrification. Call for evidence on fuel-switching to electricity: summary of responses. https://assets.publishing.service.gov.uk/media/66e013650f4ba0621b086702/electrification-call-for-evidence-formal-summary-of-responses.pdf.
Gailani, A. and Taylor, P., UK Energy Research Centre and University of Leeds (2024) Assessing electricity network capacity requirements for industrial decarbonisation in Great Britain. https://arxiv.org/abs/2411.17384.
Department for Energy Security and Net Zero (2024) Enabling industrial electrification. Call for evidence on fuel-switching to electricity: summary of responses. https://assets.publishing.service.gov.uk/media/66e013650f4ba0621b086702/electrification-call-for-evidence-formal-summary-of-responses.pdf.
Provisional 2023 emissions data are not used as these are not available for GHGs other than CO2, which make up the majority of emissions in this sector.
Forest Research (2024) Woodland Statistics. https://www.forestresearch.gov.uk/tools-and-resources/statistics/time-series/.
Scotland’s Rural College (2025) Greenhouse gas abatement in the agricultural sector by 2050 – update for the Seventh Carbon Budget advice. Unpublished.
Patrick, K. and Johnson B. (2024) Bacon, sandwich ham and salami: How does processed and red meat cause cancer and how much matters?. Cancer Research UK .https://news.cancerresearchuk.org/2024/08/01/bacon-ham-hot-dogs-salami-how-does-processed-meat-cause-cancer-and-how-much-matters/.
Department for Environment Food and Rural Affairs (2024) Family food survey. https://www.gov.uk/government/statistics/family-food-fye-2023.
Pastorino S. et al. (2023) The future of meat and dairy consumption in the UK: exploring different policy scenarios to meet net zero targets and improve population health. https://www.cambridge.org/core/journals/global-sustainability/article/future-of-meat-and-dairy-consumption-in-the-uk-exploring-different-policy-scenarios-to-meet-net-zero-targets-and-improve-population-health/8F4D09F2A88EF2FA16E2E237B5F30B21.
Whole foods refer to foods that have not been processed, including legumes, pulses, and grains.
Department for Environment Food and Rural Affairs (2024) Agriculture in the United Kingdom, 2023. https://www.gov.uk/government/statistics/agriculture-in-the-united-kingdom-2023.
Department for Environment Food and Rural Affairs (2024) Agriculture in the United Kingdom, 2023. https://www.gov.uk/government/statistics/agriculture-in-the-united-kingdom-2023.
This level of reduction by 2030 is consistent with the UN Sustainable Development Goal 12.3, which has been adopted by WRAP and Defra.
To align with the UK GHG inventory, our peatland modelling aligns with areas as reported in the inventory, which are based on rewetting. In the absence of accurate, UK-level reporting of annual peatland restoration rates, this acts as a proxy for restoration. However, a wider suite of restoration measures alongside rewetting, such as establishment of vegetation, stabilisation, and grazing management, are required for peatlands to be resilient.
Evans, C.D. et al (2021) Overriding water table control on managed peatland greenhouse gas emissions. Nature. https://doi.org/10.1038/s41586-021-03523-.
Paludiculture or ‘wet-farming’ is an agricultural approach to peatland management, where crops are grown under a high water table. Paludiculture is considered a novel production system.
When wider tree actions (see below) such as agroforestry, short rotation forestry, and small woodlands are considered, percentage cover rises to 22% by 2050.
The Balanced Pathway assumes woodland creation is directly planted rather than by natural regeneration.
Department for Environment Food and Rural Affairs (2024) Bioenergy crops in England and the UK: 2008-2023. https://www.gov.uk/government/statistics/bioenergy-crops-in-england-and-the-uk-2008-2023/bioenergy-crops-in-england-and-the-uk-2008-2023#plant-biomass-miscanthus-short-rotation-coppice-and-straw.
Energy Technologies Institute (2016) Insights into the future UK bioenergy sector, gained using the ETI’s Bioenergy Value Chain Model (BVCM). https://www.eti.co.uk/insights/bioenergy-insights-into-the-future-uk-bioenergy-sector-gained-using-the-etis-bioenergy-value-chain-model-bvcm.
Carey, P.D. et al (2009) Countryside survey: UK results from 2007. https://www.ceh.ac.uk/our-science/projects/cs-reports.
Gregg, R. et al (2021) Carbon storage and sequestration by habitat: a review of the evidence (second edition) Natural England Research Report NERR094. https://publications.naturalengland.org.uk/publication/5419124441481216.
When selecting species, consideration should be given to future climate change. This may mean choosing species local to the region or identifying suitable sub-species that can impart resilience to drought and warmer temperatures. Invasive species should be avoided.
Forestry Commission (2024) Woodland management matters: Ensuring the future health and resilience of our woodlands. https://www.gov.uk/government/publications/woodland-management-matters-ensuring-the-future-health-and-resilience-of-our-woodlands/woodland-management-matters-ensuring-the-future-health-and-resilience-of-our-woodlands.
Mercer, L. and Gregg, R. (2023) Exploring the carbon sequestration potential of rewilding in the UK: policy and data needs to support net zero. https://www.lse.ac.uk/granthaminstitute/publication/exploring-the-carbon-sequestration-potential-of-rewilding-in-the-uk-policy-and-data-needs-to-support-net-zero/.
Fletcher, T.I. et al (2021) The carbon sequestration potential of Scottish native woodland. Environmental Communications 3. https://iopscience.iop.org/article/10.1088/2515-7620/abf467.
Albanito, F. et al (2022) Agroecology – a rapid evidence review. https://www.theccc.org.uk/publication/agroecology-a-rapid-evidence-review-university-of-aberdeen/.
Climate Change Committee (2022) Briefing: blue carbon. https://www.theccc.org.uk/publication/briefing-blue-carbon/.
UK Centre for Ecology and Hydrology, Eunomia, and University of East Anglia (2025) UK rural land use archetypes, part two. Unpublished.
Espinosa, S.N. et al (2024) Mapping the evidence of novel plant-based foods: a systematic review of nutritional, health, and environmental impacts in high-income countries. https://academic.oup.com/nutritionreviews/advance-article/doi/10.1093/nutrit/nuae031/7656938.
Fang, Z. et al. (2024) Association of ultra-processed food consumption with all cause and cause specific mortality: population based cohort study. https://www.bmj.com/content/385/bmj-2023-078476.
Food Standard Scotland (2024) Modelling the impact of reductions in meat and dairy consumption on nutrient intakes and disease risk. https://www.foodstandards.gov.scot/publications-and-research/publications/modelling-the-impact-of-reductions-in-meat-and-dairy-consumption-on-nutrient-intakes-and-disease-risk.
Espinosa, S.N. et al (2024) Mapping the evidence of novel plant-based foods: a systematic review of nutritional, health, and environmental impacts in high-income countries. https://academic.oup.com/nutritionreviews/advance-article/doi/10.1093/nutrit/nuae031/7656938.
House of Commons Welsh Affairs Committee (2022) The economic and cultural impacts of trade and environmental policy on family farms in Wales. https://committees.parliament.uk/publications/9583/documents/162242/default/.
Our electricity supply sector comprises electricity generation, storage, and networks.
Department for Energy Security and Net Zero (2023) Electricity generation costs 2023. https://www.gov.uk/government/publications/electricity-generation-costs-2023.
Global Wind Energy Council (GWEC) (2024) Global offshore wind report 2024. https://gwec.net/global-offshore-wind-report-2024/.
The Crown Estate (2024) Offshore wind report 2023. https://www.thecrownestate.co.uk/our-business/marine/offshore-wind-report-2023.
The Crown Estate (2024) Future of offshore wind. https://www.datocms-assets.com/136653/1725984848-tce_future-offshore-wind.pdf.
Department for Energy Security and Net Zero (2023) National Policy Statement for renewable energy infrastructure (EN-3), https://www.gov.uk/government/publications/national-policy-statement-for-renewable-energy-infrastructure-en-3.
Copping, J. et al. (2024) Ambitious onshore renewable energy deployment does not exacerbate future UK land-use challenges. Cell Reports Sustainability. https://doi.org/10.1016/j.crsus.2024.100122.
House of Lords Library (2024) ‘Undergrounding’ electrical transmission cables. https://lordslibrary.parliament.uk/undergrounding-electrical-transmission-cables/.
National Energy System Operator (2024) ESO East Anglia network Study. https://www.neso.energy/about/our-projects/offshore-coordination-project/east-anglia-study.
Department for Energy Security and Net Zero (2024) National Policy Statements for energy infrastructure. https://www.gov.uk/government/collections/national-policy-statements-for-energy-infrastructure.
National Energy System Operator (2024) Security and quality of supply standard (SQSS). https://www.neso.energy/industry-information/codes/security-and-quality-supply-standard-sqss.
Bloomfield H. (2025) Reasonable worst-case stress-test scenarios for the UK energy sector in the context of the changing climate. Unpublished.
Residual demand is demand required to be met after taking account of generation from variable renewables.
There are a number of relevant factors that are challenging to capture within modelling (such as demand response of fuels outside of the electricity supply system) but could reduce the level of capacity required. We take a conservative approach to these and, as such, we view the above value as an upper bound.
Ofgem (2023) Gas Transporters License: standard conditions. https://www.ofgem.gov.uk/energy-policy-and-regulation/industry-licensing/licences-and-licence-conditions.
Department of Energy and Climate Change (2015) Contracts for Difference (CfD) Allocation Round One Outcome. https://www.gov.uk/government/publications/contracts-for-difference-cfd-allocation-round-one-outcome.
Department for Business, Energy and Industrial Strategy (2019) Contracts for Difference (CfD) Allocation Round 3: results. https://www.gov.uk/government/publications/contracts-for-difference-cfd-allocation-round-3-results.
Low Carbon Contracts Company (2016) Hinkley Point C CfD. https://www.lowcarboncontracts.uk/resources/guidance-and-publications/hinkley-point-c-cfd/.
Department for Energy Security and Net Zero (2023) Traded carbon values used for modelling purposes. https://www.gov.uk/government/publications/traded-carbon-values-used-for-modelling-purposes-2023.
National Grid (2024) History of the supergrid. https://www.nationalgrid.com/supergrid-history.
Williams, T. (1981) A history of the British gas industry. Oxford; New York. Oxford University Press.
Department of Energy and Climate Change (2012) Gas generation strategy. https://assets.publishing.service.gov.uk/media/5a78985fe5274a277e68df30/7165-gas-generation-strategy.pdf.
Department for Energy Security and Net Zero (2024) Historical electricity data, https://www.gov.uk/government/statistical-data-sets/historical-electricity-data.
Department for Energy Security and Net Zero (2023) Provisional UK greenhouse gas emissions national statistics 2023. https://www.gov.uk/government/statistics/provisional-uk-greenhouse-gas-emissions-national-statistics-2023.
Civil Aviation Authority (2024) UK airport data. https://www.caa.co.uk/data-and-analysis/uk-aviation-market/airports/uk-airport-data/.
Civil Aviation Authority (2010) CAA passenger survey report. https://www.caa.co.uk/media/dvcp2qho/caa-passenger-survey-report-2010.pdf.
Civil Aviation Authority (2023) Annual departing passenger survey reports. https://www.caa.co.uk/media/qqihn21y/t02_2023.pdf.
Department for Energy Security and Net Zero (2023) Traded carbon values used for modelling purposes. https://www.gov.uk/government/publications/traded-carbon-values-used-for-modelling-purposes-2023.
The aviation sector’s Balanced Pathway uses 2025 as a reference year for aviation demand as 2023 demand appears to still be rebounding from the COVID-19 pandemic (see Section 7.6.1) and because 2025 is when the DESNZ high carbon value is introduced in the modelling.
Department for Transport (2024) Aviation modelling framework. https://www.gov.uk/government/publications/aviation-modelling-framework.
Department for Transport (2017) UK aviation forecasts. https://assets.publishing.service.gov.uk/media/5e8dec2786650c18c9666633/uk-aviation-forecasts-2017.pdf.
The difference in growth rate between terminal passenger demand and passenger-km per capita is due to long-haul flight demand (mainly flights to outside of the UK and Europe) driving demand growth, which increases passenger-km more significantly than growth in domestic and short-haul flights (flights to Europe).
See the UK’s 1990–2021 Greenhouse Gas Inventory, Section 1.8.2.3, for the relevant guidelines.
Department for Energy Security and Net Zero (2023) UK Greenhouse Gas Inventory, 1990 to 2021. https://uk-air.defra.gov.uk/assets/documents/reports/cat09/2304171441_ukghgi-90-21_Main_Issue1.pdf#page=98.
Department for Transport (2024) Aviation modelling framework. https://www.gov.uk/government/publications/aviation-modelling-framework.
Fouquet, R. and O’Garra, T. (2022) In pursuit of progressive and effective climate policies: Comparing an air travel carbon tax and a frequent flyer levy. Energy Policy, Volume 171. https://doi.org/10.1016/j.enpol.2022.113278.
Seetaram, N. et al. (2018) Estimating willingness to pay air passenger duty. Annals of Tourism Research, Volume 72, pp 85-97. https://doi.org/10.1016/j.annals.2018.07.001.
This analysis assumes an average ticket price increase is passed through to ticket prices evenly. It forecasts 2050 real household income per capita using 2023 household real disposable income per capita and OBR projections of growth in real GDP per capita.
Office for National Statistics (2024) The effects of taxes and benefits on household income, disposable income estimate. https://www.ons.gov.uk/peoplepopulationandcommunity/personalandhouseholdfinances/incomeandwealth/datasets/householddisposableincomeandinequality.
Transport and Environment (2022) Applying kerosene duty to aviation. https://www.transportenvironment.org/uploads/files/2209-Kerosene-Duty.pdf.
Fouquet, R. and O’Garra, T. (2022) In pursuit of progressive and effective climate policies: Comparing an air travel carbon tax and a frequent flyer levy. Energy Policy, Volume 171. https://doi.org/10.1016/j.enpol.2022.113278.
Gossling, S. and Dolnicar, S. (2021) A review of air travel behavior and climate change. Wiley Interdisciplinary Reviews: Climate Change. https://wires.onlinelibrary.wiley.com/doi/pdf/10.1002/wcc.802.
Mitev, K. et al. (2023) The implications of behavioural science for effective climate policy, A report by the Centre for Climate Change and Social Transformations, commissioned by the Climate Change Committee. https://www.theccc.org.uk/wp-content/uploads/2023/09/The-Implications-of-Behavioural-Science-for-Effective-Climate-Policy-Literature-Review-and-Background-Report-CAST.pdf.
Lee, D.S. et al (2020) The contribution of global aviation to anthropogenic climate forcing for 2000 to 2018. Atmospheric environment. https://pmc.ncbi.nlm.nih.gov/articles/PMC7468346/.
Department of Energy Security and Net Zero (2024) Digest of UK Energy Statistics: Foreign trade statistics. https://www.gov.uk/government/statistics/dukes-foreign-trade-statistics.
UK Government (2024) Sustainable aviation fuel initiatives. https://www.gov.uk/government/speeches/sustainable-aviation-fuel-initiatives.
To avoid double counting of low-carbon fuel costs, in our economy-wide analysis, the costs of supplying low-carbon fuels are only captured within end-use sectors and not in fuel supply. Therefore, the fuel supply contributions to the analysis in Chapter 4 only include the costs associated with decarbonising fossil fuel supply. By contrast, Figure 7.7.4 shows all costs associated with the fuel supply sector.
North Sea Transition Authority (2024) OGA Plan to reduce UKCS greenhouse gas emissions. https://www.nstauthority.co.uk/media/laidjfqb/oga-plan-to-reduce-ukcs-greenhouse-gas-emissions.pdf.
North Sea Transition Authority (2024) Emissions monitoring report 2024. https://www.nstauthority.co.uk/media/nugh4i0q/emissions-monitoring-report-2024.pdf.
UK Government (2024) Government reignites industrial heartlands 10 days out from the International Investment Summit. https://www.gov.uk/government/news/government-reignites-industrial-heartlands-10-days-out-from-the-international-investment-summit.
Provisional 2023 emissions data are not used as these are not available for GHGs other than CO2, which make up the majority of emissions in this sector.
This estimate is based on a comparison of Defra’s 2024 UK statistics on waste and Local authority collected waste management publications.
Department for Environment, Food and Rural Affairs (2024) UK statistics on waste. https://www.gov.uk/government/statistics/uk-waste-data/uk-statistics-on-waste.
Department for Environment, Food and Rural Affairs (2024) Local authority collected waste management – annual results 2022/23. https://www.gov.uk/government/statistics/local-authority-collected-waste-management-annual-results/local-authority-collected-waste-management-annual-results-202223.
Department for Energy Security and Net Zero (2024) Final UK greenhouse gas emissions national statistics: 1990 to 2022. https://www.gov.uk/government/statistics/final-uk-greenhouse-gas-emissions-national-statistics-1990-to-2022.
Climate Change Committee (2024) Progress in reducing emissions: 2024 Report to Parliament. https://www.theccc.org.uk/publication/progress-in-reducing-emissions-2024-report-to-parliament/.
Ofgem (no date) Renewables Obligation (RO). https://www.ofgem.gov.uk/environmental-and-social-schemes/renewables-obligation-ro.
Climate Change Committee (2020) The Sixth Carbon Budget Methodology Report. https://www.theccc.org.uk/publication/sixth-carbon-budget/.
Climate Change Committee (2023) Progress in reducing emissions: 2023 Report to Parliament. https://www.theccc.org.uk/publication/2023-progress-report-to-parliament/.
United Nations Department of Economic and Social Affairs (no date) Goal 12 Ensure sustainable consumption and production patterns. https://sdgs.un.org/goals/goal12.https://sdgs.un.org/goals/goal12#targets_and_indicators.https://sdgs.un.org/goals/goal12.
Waste and Resources Action Programme (no date) The Courtauld Commitment 2030. https://www.wrap.ngo/taking-action/food-drink/initiatives/courtauld-commitment.
Waste and Resources Action Programme (no date) Action on food waste. https://www.wrap.ngo/taking-action/food-drink/actions/action-on-food-waste.
Waste and Resources Action Programme (2023) The Food Waste Reduction Roadmap progress update 2023. https://www.wrap.ngo/sites/default/files/2023-11/WRAP-Food-Waste-Reduction-Roadmap-Progress-Update-report-2023-V1.0_0.pdf.
Department for Environment, Food and Rural Affairs (2023) Consistency in household and business recycling in England government response. https://www.gov.uk/government/consultations/consistency-in-household-and-business-recycling-in-england/outcome/government-response.
Waste and Resources Action Programme (2024) Household food waste collections guide. https://www.wrap.ngo/sites/default/files/2024-02/WRAP-Household-Food-Waste-Collections-Guide-V17.pdf
Department for Environment, Food and Rural Affairs (2024) UK statistics on waste. https://www.gov.uk/government/statistics/uk-waste-data/uk-statistics-on-waste.
Commercial and industrial waste, and non-household municipal waste.
Department for Environment, Food and Rural Affairs (2019) Consistent municipal recycling collections in England – impact assessment. https://consult.defra.gov.uk/environmental-quality/consultation-on-consistency-in-household-and-busin/supporting_documents/recycleconsistencyconsultia.pdf.
Department for Environment, Food and Rural Affairs (2024) Simpler recycling in England – impact assessment. https://www.legislation.gov.uk/ukia/2024/97/pdfs/ukia_20240097_en.pdf.
Department of Agriculture, Environment and Rural Affairs (2024) Rethinking our resources: measures for climate action and a circular economy in NI – regulatory impact assessment. https://www.daera-ni.gov.uk/sites/default/files/consultations/daera/Rethinking%20Our%20Resources%20Annex%20C%20%C2%AD%20Regulatory%20Impact%20Assessment%20%28Final%20PDF%29.PDF
Department for Environment, Food and Rural Affairs (2023) Call for evidence to support the near elimination of biodegradable waste disposal in landfill from 2028. https://consult.defra.gov.uk/waste-and-recycling/cfe-near-elimination-bio-waste-to-landfill/supporting_documents/23.05.25_Near_Elim_Biodegradable_Waste_to_Landfill_CfE.pdf.
Department for Energy Security and Net Zero (2023) Cluster sequencing phase-2: shortlisted projects (power CCUS, hydrogen and ICC. https://www.gov.uk/government/publications/cluster-sequencing-phase-2-eligible-projects-power-ccus-hydrogen-and-icc/cluster-sequencing-phase-2-shortlisted-projects-power-ccus-hydrogen-and-icc-august-2022.
Arup (2025) Updating wastewater treatment pathways for the Seventh Carbon Budget. https://www.theccc.org.uk/publication/updating-wastewater-treatment-pathways-for-the-seventh-carbon-budget-arup/.
Committee on Climate Change (2016) Meeting Carbon Budgets – Progress Report to Parliament.
https://www.theccc.org.uk/publication/meeting-carbon-budgets-2016-progress-report-to-parliament/.
Office for National Statistics (2022) Energy use by industry, source and fuel.
https://www.ons.gov.uk/economy/environmentalaccounts/datasets/ukenvironmentalaccountsenergyusebyindustrysourceandfuel.
Valuation Office Agency (2022) Non-domestic rating: stock of properties including business floorspace, 2022. https://www.gov.uk/government/statistics/non-domestic-rating-stock-of-properties-2022.
Valuation Office Agency (2023) Non-domestic rating: stock of properties including business floorspace. https://www.gov.uk/government/statistics/non-domestic-rating-stock-of-properties-including-business-floorspace-2023.
The residual emissions consist of 0.3 MtCO2e from remaining use of anaesthetics and 0.4 MtCO2e from minor energy uses that have not been fully modelled. It should be possible to reduce emissions to less than 0.7 MtCO2e by 2050.
Department for Business, Energy and Industrial Strategy (2022) Evidence update of low carbon heating and cooling in non-domestic buildings.
https://www.gov.uk/government/publications/evidence-update-of-low-carbon-heating-and-cooling-in-non-domestic-buildings.
We have used the DfT’s emissions model as the starting point for our pathway (other than for naval shipping and inland waterways and leisure shipping, which are not included in DfT’s emissions model and are based on the GHG inventory). In line with previous CCC recommendations, the Balanced Pathway measures international shipping emissions based on the movements of ships on international voyages. This differs from the approach based on the sale of bunker fuels in the UK that is currently used in the inventory. The Balanced Pathway also uses more recent activity data for most domestic shipping than is used for the inventory. We have used this approach as we expect the inventory to adopt a similar methodology for domestic shipping in the near future. As a result, our starting point for shipping emissions is slightly higher than in the inventory.
Department for Transport (2024) Maritime Emissions Model. Unpublished.
International Maritime Organisation (2024) IMO’s work to cut GHG emissions from ships. https://www.imo.org/en/MediaCentre/HotTopics/Pages/Cutting-GHG-emissions.aspx. (Accessed: 10 December 2024).
Department for Transport (2023) COP26: Clydebank Declaration for green shipping corridors. https://www.gov.uk/government/publications/cop-26-clydebank-declaration-for-green-shipping-corridors/cop-26-clydebank-declaration-for-green-shipping-corridors.
Department for Transport (2024). Unpublished.
Department for Transport (2024) Port freight annual statistics 2023: Overview of port freight statistics and useful information. https://www.gov.uk/government/statistics/port-freight-annual-statistics-2023/port-freight-annual-statistics-2023-overview-of-port-freight-statistics-and-useful-information.
Department for Transport (2024) Port freight annual statistics 2023: Overview of port freight statistics and useful information, PORT0101. https://www.gov.uk/government/statistics/port-freight-annual-statistics-2023/port-freight-annual-statistics-2023-overview-of-port-freight-statistics-and-useful-information.
Department for Transport (2024) Port freight annual statistics 2023: Overview of port freight statistics and useful information, PORT0201. https://www.gov.uk/government/statistics/port-freight-annual-statistics-2023/port-freight-annual-statistics-2023-overview-of-port-freight-statistics-and-useful-information.
2003 is the earliest year with data on domestic sea passengers. Part of this effect may be due to the COVID-19 pandemic, but the number of sea passengers was falling prior to the pandemic.
Department for Transport (2024). Unpublished.
Department for Transport (2024). Unpublished.
Department for Transport (2024) Port freight annual statistics 2023: Overview of port freight statistics and useful information, PORT0101. https://www.gov.uk/government/statistics/port-freight-annual-statistics-2023/port-freight-annual-statistics-2023-overview-of-port-freight-statistics-and-useful-information.
Department for Transport (2024) Sea passenger statistics: Overview 2023. https://www.gov.uk/government/statistics/sea-passenger-statistics-all-routes-2023/sea-passenger-statistics-overview-2023.
International Energy Agency (2021) Ammonia technology roadmap. https://www.iea.org/reports/ammonia-technology-roadmap/executive-summary.
Det Norske Veritas (DNV) (2024) Investing in future ammonia markets. https://www.iea.org/reports/ammonia-technology-roadmap/executive-summary.
Current international carbon reporting guidelines are unclear regarding reporting of emissions savings derived from imported synthetic fuels. Due to this ambiguity, our analysis assumes synthetic fuels are produced in the UK. See the UK’s 1990–2021 Greenhouse Gas Inventory, Section 1.8.2.3, for the relevant guidelines. In practice, future synthetic fuel production and supply is likely to operate in an international market. IPCC inventory guidelines will need to be clarified to allow for imported synthetic fuels to contribute to UK territorial emissions savings.
UK Government (2023) UK Greenhouse Gas Inventory, 1990 to 2021: Annual Report for submission under the Framework Convention on Climate Change. https://naei.energysecurity.gov.uk/reports/uk-greenhouse-gas-inventory-1990-2021-annual-report-submission-under-framework-convention.
Offshore energy (2024) 23 methanol-powered ships ordered since the start of 2024. https://www.offshore-energy.biz/23-methanol-powered-ships-ordered-since-the-start-of-2024/. (Accessed: 9 December 2024).
Carbon Trust (2021) A roadmap for the decarbonisation of the European recreational marine craft sector. https://www.carbontrust.com/our-work-and-impact/guides-reports-and-tools/a-roadmap-for-the-decarbonisation-of-the-european-recreational-marine-craft-sector.
Bullock, S. (2020) Barriers and solutions for UK shore-power. Tyndall Centre for Climate Change Research, University of Manchester. https://www.britishports.org.uk/content/uploads/2021/02/Shore-power-Tyndall-FINAL-DEC-2020.pdf.
Inland Waterways Association (2024) Biofuels for greener boating. https://waterways.org.uk/campaigns/sustainable-boating/biofuels. (Accessed: 4 December 2024).
Clarksons (2024) Green technology & alternative fuel uptake. https://www.clarksons.com/home/news-and-insights/2024/green-technology-alternative-fuel-uptake/. (Accessed: 3 December 2024).
European Commission (2024) FAQ – Maritime transport in EU Emissions Trading System (ETS). https://climate.ec.europa.eu/eu-action/transport/reducing-emissions-shipping-sector/faq-maritime-transport-eu-emissions-trading-system-ets_en. (Accessed: 10 December 2024).
Provisional 2023 emissions data are not used as these are not available for GHGs other than CO2, which make up all emissions in this sector.
European Union (2024) Guidance on the EU’s F-gas regulation and its legal framework. https://climate.ec.europa.eu/eu-action/fluorinated-greenhouse-gases/eu-rules_en.
Although the baseline year for F-gases in the Climate Change Act is 1995, we have chosen to show changes with respect to 1990 for consistency with other sectors.
Department for Environment, Food and Rural Affairs (2024) Fluorinated gases (F gases). https://www.gov.uk/guidance/fluorinated-gases-f-gases. (Accessed: 29 November 2024).
European Union (2022) About F-gases. https://climate.ec.europa.eu/eu-action/fluorinated-greenhouse-gases/about-f-gases_en. (Accessed: 29 November 2024).
European Union (2015) The fluorinated greenhouse gases regulations 2015. https://www.legislation.gov.uk/uksi/2015/310/contents.
Fluorocarbons (2020) https://www.fluorocarbons.org/news/european-pharmaceutical-company-announces-low-gwp-hfc-152a-metered-dose-inhaler-mdi/.
Smith, S. et al (2024) The state of carbon dioxide removal 2024 – 2nd Edition. https://www.stateofcdr.org/.
Energy Technologies Institute (2016) CO2 stored database. https://www.co2stored.co.uk/. (Accessed: 4 December 2024).
In line with existing international biomass accounting rules, we assume negative emissions are counted at the point of capture.
Climeworks (no date) Orca is Climeworks’ new large-scale carbon dioxide removal plant. https://climeworks.com/plant-orca. (Accessed: 4 December 2024).
Climeworks (2024) Climeworks switches on world’s largest direct air capture plant. https://climeworks.com/press-release/climeworks-switches-on-worlds-largest-direct-air-capture-plant-mammoth.
1PointFive (2024) Ector County DAC – STRATOS. https://www.1pointfive.com/projects/ector-county-tx. (Accessed: 4 December 2024).
International Energy Agency (2024) Direct air capture. https://www.iea.org/energy-system/carbon-capture-utilisation-and-storage/direct-air-capture. (Accessed: 4 December 2024).
CO2RE – The Greenhouse Gas Removal Hub (2024) Enhanced rock weathering. https://co2re.org/ggr-projects/enhanced-rock-weathering/. (Accessed: 4 December 2024).
CO2RE – The greenhouse gas removal hub (2022) Biochar. https://co2re.org/ggr-projects/biochar/. (Accessed: 4 December 2024).
Kantzas, E.P. et al (2022) Substantial carbon drawdown potential from enhanced rock weathering in the United Kingdom. Nature Geoscience. https://doi.org/10.1038/s41561-022-00925-2.
UK Government (2021) Greenhouse gas removal methods: technology assessment report. https://www.gov.uk/government/publications/greenhouse-gas-removal-methods-technology-assessment-report.
Kantzas, E.P. et al (2022) Substantial carbon drawdown potential from enhanced rock weathering in the United Kingdom. Nature Geoscience. https://doi.org/10.1038/s41561-022-00925-2.
UK Government (2020) Carbon capture, usage and storage article great.gov.uk international. https://www.great.gov.uk/international/investment/sectors/carbon-capture-usage-and-storage/.
British Geological Survey (no date) CO2 storage capacity estimation. https://www.bgs.ac.uk/geology-projects/carbon-capture-and-storage/co2-storage-capacity-estimation/. (Accessed: 4 December 2024).
Occidental (2023) Occidental and ADNOC to commence preliminary engineering study of a Direct Air Capture facility in the UAE. https://www.oxy.com/news/news-releases/occidental-and-adnoc-to-commence-preliminary-engineering-study-of-a-direct-air-capture-facility-in-the-uae/.
As discussed in Chapter 3 and Section 7.4, in the Balanced Pathway, residual agriculture and land use emissions are considered to be offset by land use sinks; therefore, neither sector is considered in the allocation of engineered removals.
UK Government (2024) CCUS: non-pipeline transport and cross-border CO2 networks – call for evidence. https://www.gov.uk/government/calls-for-evidence/carbon-capture-usage-and-storage-ccus-non-pipeline-transport-and-cross-border-co2-networks/ccus-non-pipeline-transport-and-cross-border-co2-networks-call-for-evidence.
An average reduction of meat and dairy consumption by 2040 results in 8 MtCO2e of emissions reductions due to a reduction in livestock. Land use change enabled by this results in a further 11 MtCO2e of emissions reduction by 2050.
Energy saving practices include reducing boiler flow temperatures, adjusting thermostats, and other steps to reduce energy bills.
Department for Transport (2024) National Travel Survey, NTS9903. https://assets.publishing.service.gov.uk/media/66ce11021aaf41b21139cf7e/nts9903.ods.
Department for Transport (2024) National Travel Survey, NTS0705. https://assets.publishing.service.gov.uk/media/66ce119f8e33f28aae7e1f7d/nts0705.ods.
Department for Transport (2023) National Travel Survey, NTS0316. https://www.gov.uk/government/statistical-data-sets/nts03-modal-comparisons.
A small number of households, particularly homes where heat pumps or heat networks may not be an appropriate solution, install less efficient direct electric heating in our modelling.
Bernard, L. et al (2024) Decarbonizing Heat: The Impact of Heat Pumps and a Time-of-Use Heat Pump Tariff on Energy Demand. https://cdn.sanity.io/files/lrxd4jqj/production/85b1357ec84918b3b6e42b694f60b067c3f683fb.pdf.
In recent years, meat purchases have fallen more steeply, with a 10% fall in overall meat consumption between 2020 and 2022. This represents a faster rate of decline than in the Balanced Pathway. It is too early to tell whether this steeper-than-projected trend will continue in the long term or is a temporary response to the cost-of-living crisis, which saw an 11% decrease in overall food purchases by weight between 2020 and 2022.
Pastorino, S. et al. (2023) The future of meat and dairy consumption in the UK: exploring different policy scenarios to meet net zero targets and improve population health. Global Sustainability. https://www.cambridge.org/core/journals/global-sustainability/article/future-of-meat-and-dairy-consumption-in-the-uk-exploring-different-policy-scenarios-to-meet-net-zero-targets-and-improve-population-health/8F4D09F2A88EF2FA16E2E237B5F30B21.
When we discuss flying in this chapter, we refer to terminal passengers (passengers joining or leaving an aircraft in the UK).
Aviation demand projections and elasticities are highly uncertain (see Section 7.6 for more detail).
Department for Transport (2024) National Travel Survey, NTS0316. https://www.gov.uk/government/statistical-data-sets/nts03-modal-comparisons.
Department for Environment, Food and Rural Affairs (2024) Agriculture in the United Kingdom. https://www.gov.uk/government/statistical-data-sets/agriculture-in-the-united-kingdom.
Department for Energy Security and Net Zero (2024) DESNZ Public Attitudes Tracker. https://www.gov.uk/government/statistics/desnz-public-attitudes-tracker-spring-2024/desnz-public-attitudes-tracker-net-zero-and-climate-change-spring-2024-uk.
UNDP (2024) People’s Climate Vote – country results. https://peoplesclimate.vote/country-results.
National Health Service (no date) Meat in your diet. https://www.nhs.uk/live-well/eat-well/food-types/meat-nutrition/. (Accessed: 11 December 2024).
Ipsos (2025) Citizens’ Panel for an accessible and affordable household vision of Net Zero. Main report. https://www.theccc.org.uk/publication/citizens-panel-for-an-accessible-and-affordable-household-vision-of-net-zero-ipsos.
Ipsos (2025) Citizens’ Panel for an accessible and affordable household vision of Net Zero. Summary for policy makers. https://www.theccc.org.uk/publication/citizens-panel-for-an-accessible-and-affordable-household-vision-of-net-zero-ipsos.
The Behavioural Insights Team (2023) How to build a Net Zero society. https://www.bi.team/wp-content/uploads/2023/01/How-to-build-a-Net-Zero-society_Jan-2023-1.pdf.
Mitev, K. et al. (2023) The Implications of Behavioural Science for Effective Climate Policy. https://www.theccc.org.uk/wp-content/uploads/2023/09/The-Implications-of-Behavioural-Science-for-Effective-Climate-Policy-Literature-Review-and-Background-Report-CAST.pdf.
The ‘typical’ UK household is modelled based on median and modal household characteristics for the UK – a semi-detached, owner-occupied house with a gas boiler and one petrol car. This household has energy consumption in line with Ofgem’s average dual fuel bill household.
Home energy costs in this section include heating, cooking, lighting, and other home energy use, excluding car charging. By 2050, transport costs will be included in home energy bills for those households who charge their electric car at home, however, for the purposes of comparison we have considered driving costs separately.
For this calculation, we have annualised the cost of the heat pump over its assumed 15-year lifetime and the costs of any accompanying radiator upgrades over their assumed 50-year lifetime.
This is based on the two policy packages we discuss below, with the range showing the range of impacts for the typical household under our two policy packages.
This analysis assumes an average ticket price increase is passed through to ticket prices evenly. It forecasts 2050 real household income per capita using 2023 household real disposable income per capita and OBR projections of growth in real GDP per capita. It then divides the ticket price increase for each flight by the absolute increase in median household real disposable income per capita between 2023 and 2050.
In any given year, we use average energy bills and average installation costs associated with buying a new gas boiler or switching to a heat pump.
Both policy packages shift the Renewables Obligation, Energy Company Obligation, Feed-in Tariffs and legacy contract for difference payments (FIDER, Allocation Round 1, and Allocation Round 2) from electricity unit rates, and the Warm Homes Discount from electricity standing charges. Impacts shown in this section are for domestic policy costs only.
Zapmap (2024) Zapmap Price Index. https://www.zap-map.com/ev-stats/charging-price-index.
Department for Transport (2024) National Travel Survey, NTS9904. https://assets.publishing.service.gov.uk/media/66ce11024e046525fa39cf80/nts9904.ods.
Ministry of Housing, Communities and Local Government (2020) English Housing Survey 2018-19 – Size of English homes. https://assets.publishing.service.gov.uk/media/5f047a01d3bf7f2be8350262/Size_of_English_Homes_Fact_Sheet_EHS_2018.pdf.
We have only quantified co-impacts that are direct, likely to be significant, and feasible to quantify based on a sufficient evidence base. We have not quantified co-impacts on biodiversity.
Raw, G. et al. (2004) Exposure to air pollutants in English homes. Journal of Exposure Analysis and Environmental Epidemiology. https://www.researchgate.net/profile/Derrick-Crump/publication/8586064_Exposure_to_air_pollutants_in_English_homes/links/02e7e533598c030dc2000000/Exposure-to-air-pollutants-in-English-homes.pdf.
Whole foods refer to foods that have not been processed, including legumes, pulses, and grains.
Espinosa, S. N. et al (2024) Mapping the evidence of novel plant-based foods: a systematic review of nutritional, health, and environmental impacts in high-income countries. Nutrition Reviews. https://academic.oup.com/nutritionreviews/advance-article/doi/10.1093/nutrit/nuae031/7656938.
Fang, Z. et al (2024) Association of ultra-processed food consumption with all cause and cause specific mortality: population based cohort study. British Medical Journal (BMJ). https://www.bmj.com/content/385/bmj-2023-078476.
Hilgendorf, K. et al (2024) Precision fermentation for improving the quality, flavor, safety, and sustainability of foods. Current Opinion in Biotechnology. https://www.sciencedirect.com/science/article/abs/pii/S095816692400020X.
Chai, K. et al (2022) Precision fermentation to advance fungal food fermentations. Current Opinion in Food Science. https://www.sciencedirect.com/science/article/abs/pii/S2214799322000832.
Munteanu, C. et al (2021) Can Cultured Meat Be an Alternative to Farm Animal Production for a Sustainable and Healthier Lifestyle? Frontiers in Nutrition. https://pubmed.ncbi.nlm.nih.gov/34671633/.
Food Standards Scotland (2024) Modelling the impact of reductions in meat and dairy consumption on nutrient intakes and disease risk. https://www.foodstandards.gov.scot/publications-and-research/publications/modelling-the-impact-of-reductions-in-meat-and-dairy-consumption-on-nutrient-intakes-and-disease-risk.
Espinosa, S. N. et al (2024) Mapping the evidence of novel plant-based foods: a systematic review of nutritional, health, and environmental impacts in high-income countries. Nutrition Reviews. https://academic.oup.com/nutritionreviews/advance-article/doi/10.1093/nutrit/nuae031/7656938.
PSED obligations apply to the CCC because it is a formally recognised non-departmental government body which is exercising public functions assigned to it by the Climate Change Act (2008).
UK Government (2022) Fuel Poverty: ethnicity facts and figures. https://www.ethnicity-facts-figures.service.gov.uk/housing/housing-conditions/fuel-poverty/latest/.
UK Government (2022) Fuel Poverty: ethnicity facts and figures. https://www.ethnicity-facts-figures.service.gov.uk/housing/housing-conditions/fuel-poverty/latest/.
Regen (2022) Why are disabled people more vulnerable to rising energy costs and what should be done about it? https://www.regen.co.uk/disability-and-energy/.
Department for Energy Security and Net Zero (2023) Fuel poverty detailed tables 2024 (2023 data). https://www.gov.uk/government/statistics/fuel-poverty-detailed-tables-2024-2023-data.
Department for Environment, Food and Rural Affairs and Public Health England (2017) Air Quality: A briefing for directors of public health. https://www.local.gov.uk/sites/default/files/documents/6.3091_DEFRA_AirQualityGuide_9web_0.pdf.
Aether (2023) Greater London Authority air quality exposure and inequalities study. https://www.london.gov.uk/sites/default/files/2023-06/Air%20quality%20exposure%20and%20inequalities%20study%20-%20part%20one%20-%20London%20analysis.pdf.
The Health Foundation (2024) Inequalities in likelihood of living in polluted neighbourhoods. https://www.health.org.uk/evidence-hub/our-surroundings/air-pollution/inequalities-in-likelihood-of-living-in-polluted.
Climate Change Committee (2023) A Net Zero workforce. https://www.theccc.org.uk/wp-content/uploads/2023/05/CCC-A-Net-Zero-Workforce-Web.pdf.
Groundwork (2021) Out of bounds: equity in access to urban nature. https://www.groundwork.org.uk/wp-content/uploads/2021/05/Out-of-Bounds-equity-in-access-to-urban-nature.pdf.
Fair4AllFinance (2023) Levelling the playing field: building inclusive access to financial services for people from minority ethnic groups. https://fair4allfinance.org.uk/wp-content/uploads/2024/10/Levelling-the-playing-field-Building-inclusive-access-to-finance.pdf.
Ministry of Housing, Communities and Local Government (2020) Renting from a private landlord. https://www.ethnicity-facts-figures.service.gov.uk/housing/owning-and-renting/renting-from-a-private-landlord/latest/.
Ministry of Housing, Communities and Local Government (2020) Renting social housing. https://www.ethnicity-facts-figures.service.gov.uk/housing/social-housing/renting-from-a-local-authority-or-housing-association-social-housing/latest/.
Ministry of Housing, Communities and Local Government (2023) Home ownership. https://www.ethnicity-facts-figures.service.gov.uk/housing/owning-and-renting/home-ownership/latest/.
Regen (2022) Why are disabled people more vulnerable to rising energy costs and what should be done about it? https://www.regen.co.uk/disability-and-energy/.
Ofcom (2022) Digital exclusion: A review of Ofcom’s research on digital exclusion among adults in the UK. https://www.ofcom.org.uk/siteassets/resources/documents/research-and-data/media-literacy-research/adults/adults-media-use-and-attitudes-2022/digital-exclusion-review-2022.pdf?v=327651.
Office for National Statistics (2023) Families in England and Wales, Census 2021. https://www.ons.gov.uk/peoplepopulationandcommunity/birthsdeathsandmarriages/families/articles/familiesinenglandandwales/census2021.
NESO (2024) Demand Flexibility Service explained. https://www.neso.energy/industry-information/balancing-services/demand-flexibility-service/demand-flexibility-service-explained.
Trade Union Congress (2024) Making hybrid inclusive: Black workers experiences of hybrid working. https://www.tuc.org.uk/sites/default/files/inclusivehybridworking.pdf.
Office for National Statistics (2020) Household wealth by ethnicity, Great Britain. https://www.ons.gov.uk/peoplepopulationandcommunity/personalandhouseholdfinances/incomeandwealth/articles/householdwealthbyethnicitygreatbritain/april2016tomarch2018.
Sustrans (2023) Disables Citizens’ Inquiry: Giving disabled people a voice in walking and wheeling policy and practice. https://www.sustrans.org.uk/our-blog/research/disabled-citizens-inquiry/.
Motability (2023) EV design and disability inclusion. https://www.motabilityfoundation.org.uk/media/dg0bgzyd/est0062-motability-report-v15.pdf.
Ison, J. et al (2024) ’I’ll Try and Make Myself as Small as Possible’: Women and Gender-Diverse People’s Safety Work on Public Transport. Violence Against Women. https://journals.sagepub.com/doi/full/10.1177/10778012241270279.
Office for National Statistics (2020) Household wealth by ethnicity, Great Britain. https://www.ons.gov.uk/peoplepopulationandcommunity/personalandhouseholdfinances/incomeandwealth/articles/householdwealthbyethnicitygreatbritain/april2016tomarch2018.
Office for National Statistics (2023) Ethnicity pay gaps, UK. https://www.ons.gov.uk/employmentandlabourmarket/peopleinwork/earningsandworkinghours/articles/ethnicitypaygapsingreatbritain/2012to2022.
House of Lords Library (2022) Cost of living: impact of rising costs on disabled people. Cost of living: Impact of rising costs on disabled people – House of Lords Library.
UK Energy Research Centre (2018) Policy Pathways to Justice in Energy Efficiency. https://ukerc.ac.uk/publications/policy-pathways-to-justice-energy-efficiency/.
Regen (2022) Why are disabled people more vulnerable to rising energy costs and what should be done about it? https://www.regen.co.uk/disability-and-energy/.
Climate Change Committee (2020) Economic impact of the 6th Carbon Budget. https://www.theccc.org.uk/wp-content/uploads/2020/12/Cambridge-Econometrics-Economic-Impact-of-the-Sixth-Carbon-Budget.pdf.
The Advisory Group on Costs and Benefits of Net Zero (2019) Report to the Committee on Climate Change of the Advisory Group on Costs and Benefits of Net Zero. https://www.theccc.org.uk/wp-content/uploads/2019/05/Advisory-Group-on-Costs-and-Benefits-of-Net-Zero.pdf.
Pareliussen, J. et al (2022) Macroeconomic and distributional consequences of net zero policies in the United Kingdom. https://doi.org/10.1787/a8849581-en.
Hafner, S. et al (2021) Economic impacts of achieving a net-zero emissions target in the power sector. https://doi.org/10.1016/j.jclepro.2021.127610.
Department for Business, Energy and Industrial Strategy (2021) Net Zero Strategy: Build Back Greener. https://assets.publishing.service.gov.uk/media/6194dfa4d3bf7f0555071b1b/net-zero-strategy-beis.pdf.
HM Treasury (2021) Net Zero Review Final Report. https://www.gov.uk/government/publications/net-zero-review-final-report.
This figure represents the total additional capital investment required relative to the baseline, without removing double counting of energy costs (see Chapter 4).
Dibb, G. and Jung, C. (2024) Rock Bottom Low Investment in The UK Economy. https://ippr-org.files.svdcdn.com/production/Downloads/Rock_bottom_June24_2024-06-18-081624_arsv.pdf.
Total capital investment refers to gross fixed capital formation.
World Bank (2024) Database: Gross fixed capital formation (% of GDP). https://data.worldbank.org/indicator/NE.GDI.FTOT.ZS?locations=GB-OE. (Accessed: 11 December 2024).
Office for Budget Responsibility (2024) September 2024 Fiscal risks and sustainability – charts and tables: Chapter 2. https://obr.uk/frs/fiscal-risks-and-sustainability-september-2024/.
Office for Budget Responsibility (2024) Fiscal Risks and Sustainability Report. https://obr.uk/docs/dlm_uploads/Fiscal-risks-and-sustainability-report-September-2024.pdf.
Bank of England (2021) Key elements of the 2021 Biennial Exploratory Scenario: Financial risks from climate change. https://www.bankofengland.co.uk/stress-testing/2021/key-elements-2021-biennial-exploratory-scenario-financial-risks-climate-change. (Accessed: 11 December 2024).
Rising, J. et al. (2022) What will climate change cost the UK? Risks, impacts and mitigation for the net zero transition. What-will-climate-change-cost-the-UK-risks-impacts-mitigation-1.pdf.
Intergovernmental Panel on Climate Change (2022) Climate Change 2022: Impacts, Adaptation and Vulnerability. https://www.ipcc.ch/report/ar6/wg2/downloads/report/IPCC_AR6_WGII_FullReport.pdf.
Department for Energy Security and Net Zero (2024), Digest of UK Energy Statistics (DUKES): energy. https://www.gov.uk/government/statistics/energy-chapter-1-digest-of-united-kingdom-energy-statistics-dukes.
Office for Budget Responsibility (2022) Fiscal risks and sustainability July 2022. https://obr.uk/docs/dlm_uploads/Fiscal_risks_and_sustainability_2022-1.pdf.
Attahir, B. et al (2024) Inflation effects of oil and gas prices in the UK: Symmetries and asymmetries. https://doi.org/10.1016/j.jup.2024.101803.
Office for Budget Responsibility (2022) Fiscal risks and sustainability July 2022. https://obr.uk/docs/dlm_uploads/Fiscal_risks_and_sustainability_2022-1.pdf.
Office for National Statistics (2024) RPI All Items: Percentage change over 12 months: Jan 1987=100 (frequency: year). https://www.ons.gov.uk/economy/inflationandpriceindices/timeseries/czbh/mm23.
Office for National Statistics (2024) Unemployment rate (aged 16 and over, seasonally adjusted): % (frequency: year). https://www.ons.gov.uk/employmentandlabourmarket/peoplenotinwork/unemployment/timeseries/mgsx/lms.
House of Commons Library (2024) Gas and electricity prices during the ‘energy crisis’ and beyond. https://commonslibrary.parliament.uk/research-briefings/cbp-9714/.
Office for Budget Responsibility (2023) Fiscal risks and sustainability report July 2023. https://obr.uk/frs/fiscal-risks-and-sustainability-july-2023/.
Energy Crisis Commission (2024) Protecting the UK from a Future Energy Crisis. https://energycrisiscommission.uk/wp-content/uploads/2024/10/energy-crisis-commission-report-october-2024.pdf.
Office for Budget Responsibility (2023) Fiscal risks and sustainability(2023). https://obr.uk/frs/fiscal-risks-and-sustainability-july-2023/.
We use a threshold of 100 tCO2e per £m GVA to identify which sectors have relatively low emissions intensity today. ‘Low emissions intensity’ is a relative term, and the emissions intensity of all sectors will need to decrease over time.
HM Revenue and Customs (2023) UK trade in goods by businesses characteristics 2022. https://www.gov.uk/government/statistics/uk-trade-in-goods-by-business-characteristics-2022/uk-trade-in-goods-by-business-characteristics-2022#export-trade-by-industry-group. (Accessed: 11 December 2024).
Aviation is technically included within transport, freight, and logistics but remains emissions intensive in our Balanced Pathway, with engineered removals offsetting residual emissions in 2050.
Transition Plan Taskforce (2023) Disclosure Framework. https://www.ifrs.org/content/dam/ifrs/knowledge-hub/resources/tpt/disclosure-framework-oct-2023.pdf.
Rocky Mountain Institute (2024) Demand aggregation 101. https://rmi.org/demand-aggregation-101/. (Accessed: 11 December 2024).
Energy Systems Catapult (2024) Innovating to Net Zero 2024. https://esc-production-2021.s3.eu-west-2.amazonaws.com/wp-content/uploads/2024/04/27091409/ITNZ-Final.pdf.
Behavioural Insights Team (2023) How to build a Net Zero Society. How-to-build-a-Net-Zero-society_Jan-2023-1.pdf.
Bankers for Net Zero, WPI Economics, South Pole (2022) Mind the delivery gap Achieving net zero through finance and policy. https://www.bankersfornetzero.co.uk/wp-content/uploads/2022/10/Policy-Gap-Analysis-Final.pdf.
UK Business Climate Hub (2024) UK Net Zero Business Census 2024. https://businessclimatehub.uk/wp-content/uploads/2024/09/2024-UK-Net-Zero-Business-Census-Report.pdf.
Climate Change Committee (2023) A Net Zero Workforce. https://www.theccc.org.uk/wp-content/uploads/2023/05/CCC-A-Net-Zero-Workforce-Web.pdf.
The City UK and BNP Paribas (2022) Green finance: A quantitative assessment of market trends. https://www.thecityuk.com/media/l0lhnctn/green-finance-a-quantitative-assessment-of-market-trends-1.pdf.
Longfinance (2024) Global Green Finance Index 14. https://www.longfinance.net/media/documents/GGFI_14_Report_2024.10.24_v1.1.pdf.
De Lyon, J. et al. (2022) Enduring strengths: Analysing the UK’s current and potential economic strengths, and what they mean for its economic strategy, at the start of the decisive decade. https://economy2030.resolutionfoundation.org/wp-content/uploads/2022/04/Enduring_strengths.pdf.
UN Trade and Development (2024), Total trade in services. https://hbs.unctad.org/total-trade-in-services/. –(Accessed 11 December 2024).
Revealed comparative advantage is a measure of the relative contribution to exports from a given activity in a given country (in this case, the UK) compared to the global contribution to exports from that activity.
Curran, B. et al. (2023) Growing clean: Identifying and investing in sustainable growth opportunities across the UK. https://economy2030.resolutionfoundation.org/wpcontent/uploads/2022/05/Growing_clean_report.pdf.
Confederation of British Industry (2024) Going for green: The UK’s net zero growth opportunity. https://www.cbi.org.uk/media/pplbtdca/12820_green_growth_report.pdf.
North Sea Transition Authority (2023) news bulletin: Net zero boost as carbon storage licences accepted. https://www.nstauthority.co.uk/news-publications/net-zero-boost-as-carbon-storage-licences-accepted/. (Accessed: 11 December 2024).
Department for Energy Security and Net Zero (2023) Carbon Capture, Usage and Storage: A vision to establish a competitive market. https://assets.publishing.service.gov.uk/media/6594718a579941000d35a7bf/carbon-capture-usage-and-storage-vision-to-establish-a-competitive-market.pdf.
Department for Energy Security and Net Zero (2023) Carbon Capture, Usage and Storage: A vision to establish a competitive market. https://assets.publishing.service.gov.uk/media/6594718a579941000d35a7bf/carbon-capture-usage-and-storage-vision-to-establish-a-competitive-market.pdf.
Climate Change Committee (2023) A Net Zero Workforce. https://www.theccc.org.uk/wp-content/uploads/2023/05/CCC-A-Net-Zero-Workforce-Web.pdf.
National Grid (2022) Making the Switch. https://www.rgueti.com/wp-content/uploads/2022/05/Making-the-switch-images.pdf.
Green Alliance (2023) Appetite for Change. https://green-alliance.org.uk/wp-content/uploads/2023/08/Appetite_for_change.pdf.
Faraday Institute (2024) UK electric vehicle and battery production potential to 2040. https://www.faraday.ac.uk/wp-content/uploads/2024/09/Gigafactory-Report_2024_final_17Sept2024.pdf.
Climate Change Committee (2023) A Net Zero Workforce. https://www.theccc.org.uk/wp-content/uploads/2023/05/CCC-A-Net-Zero-Workforce-Web.pdf.
These estimates are based on the analysis in our report A Net Zero Workforce, updated with the Balanced Pathway from this advice.
Climate Change Committee (2023) A Net Zero Workforce. https://www.theccc.org.uk/wp-content/uploads/2023/05/CCC-A-Net-Zero-Workforce-Web.pdf.
ONS (2024), Workforce jobs by region and industry. https://www.ons.gov.uk/employmentandlabourmarket/peopleinwork/employmentandemployeetypes/datasets/workforcejobsbyregionandindustryjobs05/current.
WPI (2021) Green Renewal – The Economics of Enhancing the Natural Environment. https://wpieconomics.com/wp-content/uploads/2021/05/The-Economics-of-Enhancing-the-Natural-Environment-final-4.pdf.
Based on 2022 data.
HM Revenue and Customs (2023) UK trade in goods by businesses characteristics 2022. (https://www.gov.uk/government/statistics/uk-trade-in-goods-by-business-characteristics-2022/uk-trade-in-goods-by-business-characteristics-2022#export-trade-by-industry-group. Accessed: 11 December 2024).
European Commission (2024) Carbon Border Adjustment Mechanism. https://taxation-customs.ec.europa.eu/carbon-border-adjustment-mechanism_en. (Accessed: 11 December 2024).
HM Treasury (2021) Net Zero Review: Analysis exploring the key issues. https://assets.publishing.service.gov.uk/media/616eb3568fa8f52979b6ca3e/NZR_-_Final_Report_-_Published_version.pdf.
The green premium is the additional cost of producing a product a low-carbon way compared to the cost of producing it using fossil fuel technology.
Bloomberg New Energy Finance (2023) Green Steel Demand is Rising Faster Than Production Can Ramp Up. https://about.bnef.com/blog/green-steel-demand-is-rising-faster-than-production-can-ramp-up/. (Accessed: 11 December 2024).
ING (2023) Hydrogen sparks change for the future of green steel production. https://www.ing.com/Newsroom/News/Hydrogen-sparks-change-for-the-future-of-green-steel-production.htm?utm_source=substack&utm_medium=email. (Accessed: 11 December 2024).
Rocky Mountain Institute (2023) Five insights on the concrete and cement industry’s transition to Net Zero. https://rmi.org/five-insights-on-the-concrete-and-cement-industrys-transition-to-net-zero/. (Accessed: 11 December 2024).
Department for Environment, Food and Rural Affairs (2024) Accredited official statistics: Summary. https://www.gov.uk/government/statistics/agriculture-in-the-united-kingdom-2023/summary. (Accessed: 11 December 2024).
Department for Environment, Food and Rural Affairs (2024) Farming evidence – key statistics. https://www.gov.uk/government/publications/farming-evidence-pack-a-high-level-overview-of-the-uk-agricultural-industry/farming-evidence-key-statistics-accessible-version. (Accessed: 11 December 2024).
Office for National Statistics (2022) Agriculture by employment size, turnover size and region, 2019 to 2021. https://www.ons.gov.uk/businessindustryandtrade/business/activitysizeandlocation/adhocs/14236agriculturebyemploymentsizeturnoversizeandregion2019to2021. (Accessed: 11 December 2024).
Office for National Statistics (2024) A01: Summary of labour market statistics. https://www.ons.gov.uk/employmentandlabourmarket/peopleinwork/employmentandemployeetypes/datasets/summaryoflabourmarketstatistics. (Accessed: 11 December 2024).
Office for National Statistics (2024), Workforce jobs by region and industry. https://www.ons.gov.uk/employmentandlabourmarket/peopleinwork/employmentandemployeetypes/datasets/workforcejobsbyregionandindustryjobs05/current.
Department for Environment, Food and Rural Affairs (2024) Accredited official statistics: Farm Business Income. https://www.gov.uk/government/statistics/farm-business-income#distribution-of-farm-business-income. (Accessed: 11 December 2024).
Hammond, N., Onward (2023) Greener Pastures: Securing the economic and environmental future of Britain’s farms. https://www.ukonward.com/wp-content/uploads/2023/12/Onward-Greener-Pastures-16.12.23-2.pdf.
UK Centre for Ecology and Hydrology, Eunomia, and University of East Anglia (2025) UK rural land use archetypes, part 2. Unpublished.
Green Alliance (2023) Appetite for change. https://green-alliance.org.uk/wp-content/uploads/2023/08/Appetite_for_change.pdf.
Office for National Statistics (2024) Regional gross value added (balanced) by industry: all ITL regions. https://www.ons.gov.uk/economy/grossvalueaddedgva/datasets/nominalandrealregionalgrossvalueaddedbalancedbyindustry. (Accessed: 11 December 2024).
Good Food Institute (2023) Sustainable proteins in the United Kingdom: An ecosystem review. gfieurope.org/wp-content/uploads/2023/08/UK-ecosystem-report_Full_25aug23_final.pdf.
ICUN UK Peatland Programme (2018) UK peatland strategy. https://www.iucn-uk-peatlandprogramme.org/sites/default/files/2019-07/2018_UK%20Peatland%20Strategy_DIGITAL_3.pdf.
Department for Environment, Food and Rural Affairs (2024) Bluetongue: extended restricted zone and infected area (BTD 2024/92, BTD 2024/112 and BTD 2024/138). https://www.gov.uk/animal-disease-cases-england/bluetongue-near-haddiscoe-south-norfolk-norfolk-btd-2024-slash-92-tcz. (Accessed: 11 December 2024).
Department for Environment, Food and Rural Affairs (2024) Agricultural facts: East of England Region. https://www.gov.uk/government/statistics/agricultural-facts-england-regional-profiles/agricultural-facts-east-of-england-region. (Accessed: 11 December 2024).
Ned Hammond, Onward (2023) Greener Pastures: Securing the economic and environmental future of Britain’s farms. https://www.ukonward.com/wp-content/uploads/2023/12/Onward-Greener-Pastures-16.12.23-2.pdf.
Ministry of Food, Agriculture and Fisheries of Denmark (2024) Danish strategy for green proteins for animals and humans. https://fvm.dk/Media/638524902251150869/Strategy_green_Proteins_2024.pdf.
UK Research and Innovation (2022) Alternative proteins: Identifying UK priorities. https://www.ukri.org/wp-content/uploads/2022/06/IUK-100622-AlternativeProteinsReport-FINAL.pdf.
Good Food Institute (2024) State of the European alternative protein research ecosystem: funding 2020-April 2024. https://gfieurope.org/wp-content/uploads/2024/10/State-of-the-European-alternative-protein-research-ecosystem_publications-2019-2023.pdf.
Good Food Institute (2023) Sustainable proteins in the United Kingdom: An ecosystem review. gfieurope.org/wp-content/uploads/2023/08/UK-ecosystem-report_Full_25aug23_final.pdf.
Ipsos (2022) Making a plant-based future. https://www.ipsos.com/sites/default/files/ct/publication/documents/2022-12/Making%20a%20Plant%20Based%20Future.pdf.
North Sea Transition Authority (2024) Reserves and resources report as at end 2023. https://www.nstauthority.co.uk/news-publications/reserves-and-resources-report-as-at-end-2023/.
Climate Change Committee (2023) A Net Zero Workforce. https://www.theccc.org.uk/wp-content/uploads/2023/05/CCC-A-Net-Zero-Workforce-Web.pdf.
North Sea Transition Authority (2024) Production and expenditure projections. https://www.nstauthority.co.uk/data-and-insights/insights-and-analysis/production-and-expenditure-projections/. (Accessed: 11 December 2024).
This includes direct and indirect employment.
The Extractive Industries Transparency Initiative (2024) Estimating Employment and GVA impact of the UK Oil and Gas Industry. https://www.ukeiti.org/sites/default/files/Experian-Oil-and-Gas-Economic-Impact-Summary-Final-1%20(1).pdf.
Joshua Emden, Andrew Sudmant and Teresa Farinha, IPPR (2024) Skills Matter: shaping a just transition for workers in the energy sector. https://ippr-org.files.svdcdn.com/production/Downloads/Skills_matter_May24.pdf.
Offshore Energy UK (2023) Workforce Insight. https://oeuk.org.uk/product/oeuk-workforce-insight-2023/. (Accessed: 11 December 2024).
Climate Change Committee (2023) A Net Zero Workforce. https://www.theccc.org.uk/wp-content/uploads/2023/05/CCC-A-Net-Zero-Workforce-Web.pdf.
Aberdeen City Council (2021) Aberdeen Economic Report 2021. https://www.aberdeencity.gov.uk/sites/default/files/2021-12/Aberdeen%20Economic%20Report%202021%20Final_1.pdf.
The Extractive Industries Transparency Initiative (2023) Sector Data summary. https://www.ukeiti.org/sector-data. (Accessed: 11 December 2024).
Uplift (2024) A New Deal for the North Sea. https://cdn.prod.website-files.com/65fb114310747bea5850d1f4/66267cbb62a89c19a9dc93b3_NewDealNorthSea_UpliftBrief_042024.pdf.
Shapovalova D. et al. (2023) Measuring Just Transition: Indicators and scenarios for a Just Transition in Aberdeen and Aberdeenshire. https://aura.abdn.ac.uk/handle/2164/22364.
Uplift (2024) A New Deal for the North Sea. https://cdn.prod.website-files.com/65fb114310747bea5850d1f4/66267cbb62a89c19a9dc93b3_NewDealNorthSea_UpliftBrief_042024.pdf.
Aberdeen City Council Anti-Poverty and Inequality Committee (2023) Demographic information on child poverty, in-work poverty and other forms of poverty in the city. https://committees.aberdeencity.gov.uk/mgConvert2PDF.aspx?ID=141495.
Energy Transition Institute (2022) Making the Switch. https://www.rgueti.com/wp-content/uploads/2022/06/Making-the-switch-images.pdf.
Joshua Emden, Andrew Sudmant and Teresa Farinha, IPPR (2024) Skills Matter: shaping a just transition for workers in the energy sector. https://ippr-org.files.svdcdn.com/production/Downloads/Skills_matter_May24.pdf.
Fraser of Allander Institute (2023) The Economic Impact of Scotland’s Renewable Energy Sector – 2023 Update. https://fraserofallander.org/wp-content/uploads/2023/12/FINAL-The-Economic-Impact-of-Scotlands-Renewable-Energy-Sector-1.pdf.
Scottish Development International (2024) Realising Scotland’s potential in floating wind energy. https://www.sdi.co.uk/news/realising-scotland-s-potential-in-floating-wind-energy. (Accessed: 11 December 2024).
Curran B. et al. (2023) Growing clean: Identifying and investing in sustainable growth opportunities across the UK. https://economy2030.resolutionfoundation.org/wp-content/uploads/2022/05/Growing_clean_report.pdf.
Offshore Wind Scotland (2024) The Offshore Wind Market in Scotland. https://www.offshorewindscotland.org.uk/the-offshore-wind-market-in-scotland/floating-wind-in-scotland/. (Accessed: 11 December 2024).
Renewable UK (2024) Floating Wind: Anchoring the next generation offshore. https://www.renewableuk.com/media/scccdrxe/floating-offshore-wind-2050-vision-final.pdf.
Scottish Enterprise (2021) CCUS Economics Impacts Study. https://www.scottish-enterprise.com/media/jhic3qav/ccus-economic-impact-assessment-report.pdf.
LSE (2021) Siezing sustainable growth opportunities from carbon capture, usage and storage in the UK. https://www.lse.ac.uk/granthaminstitute/wp-content/uploads/2021/09/Seizing-Sustainable-Growth-Opportunities-from-CCUS-in-the-UK_FULL-REPORT-1.pdf.
Energy Transition Institute (2022) Making the Switch. https://www.rgueti.com/wp-content/uploads/2022/06/Making-the-switch-images.pdf.
Scottish Government Scotland’s Marine Economic Statistics 2021. https://www.gov.scot/publications/scotlands-marine-economic-statistics-2021/pages/13/. (Accessed: 11 December 2024).
Department for International Trade (2022) Floating Offshore Wind Manufacturing. https://www.offshorewindscotland.org.uk/media/13289/hpo-floating-offshore-wind-manufacturing-in-scotland.pdf.
Scottish Government (2023) Economy and Fair Work Committee. https://www.parliament.scot/api/sitecore/CustomMedia/OfficialReport?meetingId=15554.
Friends of the Earth (2023) Our power: Offshore workers’ demands for a just energy transition. Our-Power-Report.pdf.
Platform and Friends of the Earth (2023) Our Power Report. https://foe.scot/wp-content/uploads/2023/03/Our-Power-Report.pdf.
University of Aberdeen (2023) Just transition for workers and communities in Aberdeen and Aberdeenshire: Rapid evidence assessment report. https://www.abdn.ac.uk/media/site/geosciences/documents/JT_Aberdeen_Aberdeenshire_Phase_1.pdf.
Lee, Neil , Sissons, Paul and Jones, Katy (2015) The geography of wage inequality in British cities. The_geography_of_combined.pdf.
Institute for Fiscal Studies (2023) Earnings and income inequality. https://ifs.org.uk/sites/default/files/2023-07/IFS%20Slides%20RSE%20event%20-%20Labour%20market%20and%20income%20inequalities.pdf.
Climate Change Committee (2023) A Net Zero Workforce. https://www.theccc.org.uk/wp-content/uploads/2023/05/CCC-A-Net-Zero-Workforce-Web.pdf.
We have assessed the risk of carbon leakage within every piece of advice we have provided on setting the UK’s carbon budgets and the Net Zero target, and our advice has been supported by a wide body of external evidence.
HM Treasury (2021) Net Zero Review: Analysis exploring the key issues. https://assets.publishing.service.gov.uk/media/616eb3568fa8f52979b6ca3e/NZR_-_Final_Report_-_Published_version.pdf.
UK Government (2021) Net Zero strategy: build back greener. https://unfccc.int/sites/default/files/resource/UK%20Net%20Zero%20Strategy%20-%20Build%20Back%20Greener.pdf.
Net Zero Tracker (2024) Net Zero Tracker. https://zerotracker.net/. (Accessed: 6 December 2024).
Germany’s Net Zero target is for 2045.
Net Zero Tracker (2024) Net Zero tracker. https://zerotracker.net/. (Accessed: 6 December 2024).
United Nations Framework Convention on Climate Change (2023) Report of the Conference of the Parties serving as the meeting of the Parties to the Paris Agreement on its fifth session, held in the United Arab Emirates from 30 November to 13 December 2023. Part one: Proceedings. https://unfccc.int/documents/637072.
Intergovernmental Panel on Climate Change (2022) Climate Change 2022: Mitigation of Climate Change. Contribution of Working Group III to the Sixth Assessment Report of the Intergovernmental Panel on Climate Change. https://dx.doi.org/10.1017/9781009157926.
International Energy Agency (2023) Net Zero roadmap: a global pathway to keep the 1.5 °C goal in reach. https://www.iea.org/reports/net-zero-roadmap-a-global-pathway-to-keep-the-15-0c-goal-in-reach.
UK Government (2020) UK Nationally Determined Contribution: letter to the Climate Change Committee. https://www.gov.uk/government/publications/uk-nationally-determined-contribution-letter-to-the-climate-change-committee.
UK Government (2024) UK 2035 Nationally Determined Contribution. https://www.gov.uk/government/publications/uk-2035-nationally-determined-contribution.
The Climate Change Committee (2024) Letter: Advice on the UK’s 2035 Nationally Determined Contribution (NDC). https://www.theccc.org.uk/publication/letter-advice-on-the-uks-2035-nationally-determined-contribution-ndc/.
UK Government (2024) UK shows international leadership in tackling climate crisis. https://www.gov.uk/government/news/uk-shows-international-leadership-in-tackling-climate-crisis.
UK Government (2023) UK International Climate Finance Strategy. https://www.gov.uk/government/publications/uk-international-climate-finance-strategy.
UK Government (2024) Prime Minister’s National Statement at COP29: 12 November 2024. https://www.gov.uk/government/speeches/prime-ministers-national-statement-at-cop29-12-november-2024.
These risks are discussed in more detail in the Committee’s advice on Net Zero – The UK’s contribution to stopping global warming.
The numbers discussed here are final energy demands, which represent the amount of energy delivered to the end-use consumer. They may therefore differ from numbers in Section 7.5 and Section 7.7, which focus on the gross demand for each form of energy that needs to be met (also in Figure 10.4), including energy that is then transformed to another energy carrier before supply to the end-use consumer (for example, electricity used in the production of synthetic fuels).
The Supreme Court (2024) https://supremecourt.uk/cases/press-summary/uksc-2022-0064.
Department for Energy Security and Net Zero (2024) Updated oil and gas guidance following Supreme Court ruling.
https://www.gov.uk/government/news/updated-oil-and-gas-guidance-following-supreme-court-ruling.
London School of Economics (2024) What does more North Sea oil and gas mean for UK energy supply and net zero?
https://www.lse.ac.uk/granthaminstitute/explainers/what-does-more-north-sea-oil-and-gas-mean-for-uk-energy-supply-and-net-zero/.
Department for Energy Security and Net Zero (2024) Electricity generation costs 2023, Annex A.
https://www.gov.uk/government/publications/electricity-generation-costs-2023.
US Environment Protection Agency (EPA) (no date) Where the energy goes: electric cars.
https://www.fueleconomy.gov/feg/atv-ev.shtml.
Department for Energy Security and Net Zero (2024) Heat pumps explained: experts answer your questions.
https://www.gov.uk/government/news/heat-pumps-explained-experts-answer-your-questions.
Zenon Research (2023) Beyond primary energy: the energy transition needs a new lens.
https://www.zenon.ngo/en/insights/beyond-primary-energy-the-energy-transition-needs-a-new-lens.
Liebreich, M. (2024) Net zero will be harder than you think — and easier, part II: easier.
https://about.bnef.com/blog/liebreich-net-zero-will-be-harder-than-you-think-and-easier-part-ii-easier/.
Ritchie, H. and Rosado, P. (2021) What’s the difference between direct and substituted primary energy?
https://ourworldindata.org/energy-substitution-method.
North Sea Transition Authority (2024) March 2024 Oil and gas production projections and latest DESNZ and CCC demand projections. https://www.nstauthority.co.uk/data-and-insights/insights-and-analysis/production-and-expenditure-projections/.
Following the invasion of Ukraine, UK wholesale gas prices averaged 203 p/therm in 2022, a 292% increase on the five-year average of 52 p/therm between 2015 and 2019.
U.S. Geological Survey (2024) Mineral commodity summaries 2024. https://pubs.usgs.gov/publication/mcs2024.
UK Critical Minerals Intelligence Centre (2024) UK 2024 criticality assessment. https://ukcmic.org/downloads/reports/ukcmic-2024-criticality-assessment.pdf.
Energy Transitions Commission (2023) Material and resource requirements for the energy transition. https://www.energy-transitions.org/publications/material-and-resource-energy-transition/.
International Energy Agency (2024) Global critical minerals outlook 2024. https://www.iea.org/reports/global-critical-minerals-outlook-2024.
Rocky Mountain Institute (2023) X-change: cars. https://rmi.org/insight/x-change-cars/.
Some of these minerals are already being mined today. This number falls to 70% when comparing the forecast demand for critical minerals for the energy transition to the sum of existing demand for both critical minerals and coal.
International Energy Agency (2023) Energy statistics data browser. https://www.iea.org/data-and-statistics/data-tools/energy-statistics-data-browser.
Nassar, N. et al. (2022) Rock-to-Metal Ratio: A foundational metric for understanding mine wastes. Environmental Science and Technology. https://pubs.acs.org/doi/10.1021/acs.est.1c07875.
Nassar, N. et al. (2023) Rock-to-metal ratios of the rare earth elements. Journal of Cleaner Production. https://doi.org/10.1016/j.jclepro.2023.136958.
Nijnens, J. et al. (2023) Energy transition will require substantially less mining than the current fossil system. Joule. https://doi.org/10.1016/j.joule.2023.10.005.
Office for National Statistics (2022) Population estimates for the UK, England, Wales, Scotland and Northern Ireland: mid-2021. https://www.ons.gov.uk/peoplepopulationandcommunity/populationandmigration/populationestimates/bulletins/annualmidyearpopulationestimates/mid2021.
UN (2022) World population prospects. https://population.un.org/wpp/Download/Standard/MostUsed/.
Hatch (2022) Hatch analysis on the effectiveness of technologies to reduce mine waste. https://www.hatch.com/Expertise/Services-and-Technologies/Hatch-Tailings-Report.
International Energy Agency (2024) Recycling of critical minerals. https://www.iea.org/reports/recycling-of-critical-minerals.
Green Alliance (2024) Mission critical: safeguarding resources for UK energy security. https://green-alliance.org.uk/publication/mission-critical-safeguarding-resources-for-uk-energy-security/.
Global Battery Alliance, https://www.globalbattery.org/.
Centre for European Policy Studies (2024) Implementing the EU digital battery passport. https://circulareconomy.europa.eu/platform/sites/default/files/2024-03/1qp5rxiZ-CEPS-InDepthAnalysis-2024-05_Implementing-the-EU-digital-battery-passport.pdf.
Department for Transport (2024) International road freight activity (RFS02). https://www.gov.uk/government/statistical-data-sets/rfs02-international-road-haulage.
Department for Transport (2024) International road freight activity (RFS02). https://www.gov.uk/government/statistical-data-sets/rfs02-international-road-haulage.
Department for Transport (2024) Port and domestic waterborne freight statistics: data tables (PORT). https://www.gov.uk/government/statistical-data-sets/port-and-domestic-waterborne-freight-statistics-port.
Office for National Statistics (2024) Average Sterling exchange rate: US Dollar XUMAUSS. https://www.ons.gov.uk/economy/nationalaccounts/balanceofpayments/timeseries/auss/mret.
Office for National Statistics (2024) UK trade in goods, year in review: 2023. https://www.ons.gov.uk/economy/nationalaccounts/balanceofpayments/articles/uktradeingoodsyearinreview/2023.
Office for National Statistics (2022) Population estimates for the UK, England, Wales, Scotland and Northern Ireland: mid-2021. https://www.ons.gov.uk/peoplepopulationandcommunity/populationandmigration/populationestimates/bulletins/annualmidyearpopulationestimates/mid2021.
United Nations (2022) World population prospects. https://population.un.org/wpp/Download/Standard/MostUsed/.
Consumption-based emissions are equal to territorial emissions plus imports, minus exports. This section focuses on emissions from imports, capturing the UK’s indirect impact on the climate, while remaining distinct from territorial emissions.
Department for Environment Food and Rural Affairs (2024) UK and England’s carbon footprint to 2021.
https://www.gov.uk/government/statistics/uks-carbon-footprint.
Department for Energy Security and Net Zero (2024) Provisional UK greenhouse gas emissions national statistics 2023.
https://www.gov.uk/government/statistics/provisional-uk-greenhouse-gas-emissions-national-statistics-2023.
Climate Change Committee (2020) Reducing UK emissions Progress Report to Parliament.
https://www.theccc.org.uk/publication/reducing-uk-emissions-2020-progress-report-to-parliament/.
The CBAM is a policy designed to level the playing field between UK industry, who face climate policies, and other countries, by imposing a tariff on imports so that they incur an equivalent carbon price to those produced in the UK. It will apply to a subset of sectors within the UK ETS.
Climate Change Committee (2013) Reducing the UK’s carbon footprint and managing competitiveness risks.
https://www.theccc.org.uk/publication/carbon-footprint-and-competitiveness/.
French Government (2024) National energy and climate plan update.
https://commission.europa.eu/document/download/ab4e488b-2ae9-477f-b509-bbc194154a30_en?filename=FRANCE%20%E2%80%93%20FINAL%20UPDATED%20NECP%202021-2030%20%28English%29.pdf.
Danish Council on Climate Change (2023) Denmark’s global climate action.
https://klimaraadet.dk/sites/default/files/node/field_files/Denmark%27s%20Global%20Climate%20Action_English%20Summary_November%202023.pdf.
Norway 2050 Climate Change Committee (2023) Omstilling til lavutslipp.
https://files.nettsteder.regjeringen.no/wpuploads01/sites/479/2023/10/Klimautvalget-2050.pdf.
Office for Statistics Regulation (2023) Official Statistics in Development.
https://osr.statisticsauthority.gov.uk/policies/official-statistics-policies/official-statistics-in-development/.
Joint Nature Conservation Committee (no date) The global environmental impacts of consumption (GEIC) indicator. https://commodityfootprints.earth/. (Accessed: 11 December 2024).
National Health Service (NHS) England (2022) Delivering a ‘Net Zero’ National Health Service.
https://www.england.nhs.uk/greenernhs/wp-content/uploads/sites/51/2022/07/B1728-delivering-a-net-zero-nhs-july-2022.pdf.
Joint Nature Conservation Committee (2022) Policy interventions to encourage sustainable consumption.
https://hub.jncc.gov.uk/assets/859c5573-1f84-4122-b509-65d779489757.
Matthews, A. (2022). Trade policy approaches to avoid carbon leakage in the agri-food sector. https://left.eu/app/uploads/2023/02/GUE-Study-TRADE-Carbon-leakage.pdf.
Energy Systems Catapult (2020) Industrial decarbonisation: Net Zero carbon policies to mitigate carbon leakage and competitiveness impacts. https://www.theccc.org.uk/wp-content/uploads/2020/12/Energy-Systems-Catapult-Industrial-Decarbonisation-and-Mitigating-Carbon-Leakage.pdf.
HM Treasury, Department for Energy Security and Net Zero (2023) Addressing carbon leakage risk to support decarbonisation.
https://www.gov.uk/government/consultations/addressing-carbon-leakage-risk-to-support-decarbonisation.
British High Commission Pretoria and British Consulate-General Cape Town (2023) South Africa’s just energy transition is progressing.
https://www.gov.uk/government/news/south-africas-just-energy-transition-is-progressing.
Foreign, Commonwealth and Development Office (2023) Vietnam Just Energy Transition Partnership: joint statement.
https://www.gov.uk/government/news/viet-nam-just-energy-transition-partnership-joint-statement.
Cabinet Office (2022) Indonesia Just Energy Transition Partnership launched at G20.
https://www.gov.uk/government/news/indonesia-just-energy-transition-partnership-launched-at-g20.
Department for Business, Energy and Industrial Strategy (2021) UK to enshrine mandatory climate disclosures for largest companies in law.
https://www.gov.uk/government/news/uk-to-enshrine-mandatory-climate-disclosures-for-largest-companies-in-law.
Department for Energy Security and Net Zero (2023) Scope 3 Emissions in the UK Reporting Landscape.
https://assets.publishing.service.gov.uk/media/652ea475697260000dccf9db/scope-3-emissions-in-the-uk-reporting-landscape.pdf.
National Health Service (NHS) (2022) Delivering a ‘Net Zero’ National Health Service.
https://www.england.nhs.uk/greenernhs/wp-content/uploads/sites/51/2022/07/B1728-delivering-a-net-zero-nhs-july-2022.pdf.
Department for Environment Food and Rural Affairs (2024) Agriculture in the United Kingdom data sets.
https://www.gov.uk/government/statistical-data-sets/agriculture-in-the-united-kingdom.
Centre for Research into Energy Demand Solutions (2021) Resource efficiency scenarios for the UK: A technical report.
https://www.creds.ac.uk/publications/resource-efficiency-scenarios-for-the-uk-technical-report/.
Supporting research
Assessing the feasibility for large-scale DACCS deployment in the UK (City Science)
Assumptions for retrofitting residential buildings (PwC)
Citizens’ Panel for an accessible and affordable household vision of Net Zero (Ipsos)
Greenhouse gas abatement in UK agriculture 2024-2050 (SRUC)
Residential Archetypes Dataset Methodology (Kamma Climate)
Summary of Responses to the Call for Evidence (PwC)
The Agriculture Advisory Group report
The distribution of climate action co-benefits – Methodology Report
The Food and Trade Advisory Group report
The Net Zero Distributional Model – Methodology Report
The Seventh Carbon Budget Land Use Emission Pathways (UKCEH)
Understanding the tail of the electric vehicle transition (ERM)
Updating wastewater treatment pathways for the Seventh Carbon Budget (Arup)


Topics
Back to top