
Footnotes have been removed from the online version of this report. To read the footnoted version, please download the report.
Acknowledgements
The Committee would like to thank:
The team that prepared this report and its analysis. This was led by Emma Pinchbeck, James Richardson, Emily Nurse, Eoin Devane, James Tarlton, and Luke Jones and included Sasha Abraham, Rose Armitage, Florence Bates, Simona Battipaglia, Owen Bellamy, George Blake, Sandra Bogelein, Marili Boufounou, Marta Calore, Christian Calvillo Munoz, Rachel Carr-Whitworth, Lidice Cruz-Rodriguez, Selina Dagless, Bianca de Farias Letti, Victoria de la Cruz, Ramesh Deonarine, Joshua Deru, Tom Dooks, Caitlin Douglas, Kim Dowsett, Kieron Driscoll, Ahmed Gailani, Francesco Maria Giacomini, Ruth Gregg, Esther Harris, Cara Hawkins, Rachel Hay, Cilla Hellgren, Robbie Herring, Gemma Holmes, Daisy Jameson, Ariana Jessa, Sam Karslake, Emma Kearney, Miriam Kennedy, Michael Lord, Grace Macready, Luke Maxfield, Moryse McInniss, Aaron McMahon, Richard Millar, Bea Natzler, Chloe Nemo, Chris Parker, Finna Parkinson, Emma Patterson, Lois Player, Simon Rayner, Andrew Romang, Elena Saggioro, Miranda Schroder, Viv Scott, Penny Seera, Olivia Shears, Marcus Shepheard, Bryony Sheridan, Joris Simaitis, Thomas Smith, Rachael Steller, Felicity Taylor, Seán Taylor, Indra Thillainathan, Sam Van Stroud, Emma Vause, Sophie Vipond, Zelna Weich, Chloe Welsh, Eveline White, Hannah Williams, Kate Williamson, Louis Worthington, Charley Wright, Ken Wright, and Susie Wright.
Our previous Committee member, Professor Michael Davies.
Our expert advisor on the role of households and the public in the Net Zero transition, Professor Rebecca Willis.
A wide range of organisations and individuals who participated in workshops, engaged with us, submitted evidence, or met with the Committee bilaterally.
Executive summary
The climate is changing. Global warming has unequivocally been caused by greenhouse gas emissions, with 100% of the observed long-term temperature change attributable to human causes. Evidence of climate change is visible around the world, including in Scotland. In 2022, Scotland recorded its highest ever temperature of nearly 35°C in the Scottish Borders, impacting health, ecosystems, and infrastructure. In 2023, prolonged rainfall followed by Storm Babet led to widespread flooding and several deaths, as well as substantial disruption to transport and power systems.
The Climate Change (Scotland) Act 2009 (‘the Act’) sets the framework for the Scottish Government to address climate change. The Act has an ambitious target to reach Net Zero greenhouse gas emissions by 2045, with any residual emissions balanced by removing carbon dioxide from the atmosphere. This is five years earlier than the rest of the UK due to the greater potential for carbon sequestration in Scotland.
In 2024, Scotland’s interim emissions targets for 2030 and 2040 were repealed as the progress required to meet the 2030 target was deemed to be beyond what was credible. The Act was amended to replace interim targets with carbon budgets. Carbon budgets are legally binding caps on greenhouse gas emissions in Scotland over five-year periods. The UK, Wales, and Northern Ireland also use carbon budgets to set binding milestones for emissions reductions on the way to their Net Zero emissions targets.
In line with the Act, this report sets out the Committee’s advice on the level of Scotland’s four carbon budgets, covering the period 2026 to 2045. We recommend that the Scottish Government sets its carbon budgets, including Scotland’s share of international aviation and shipping emissions, at annual average levels of emissions that are:
- 57% lower than 1990 levels for the First Carbon Budget (2026 to 2030).
- 69% lower than 1990 levels for the Second Carbon Budget (2031 to 2035).
- 80% lower than 1990 levels for the Third Carbon Budget (2036 to 2040).
- 94% lower than 1990 levels for the Fourth Carbon Budget (2041 to 2045).
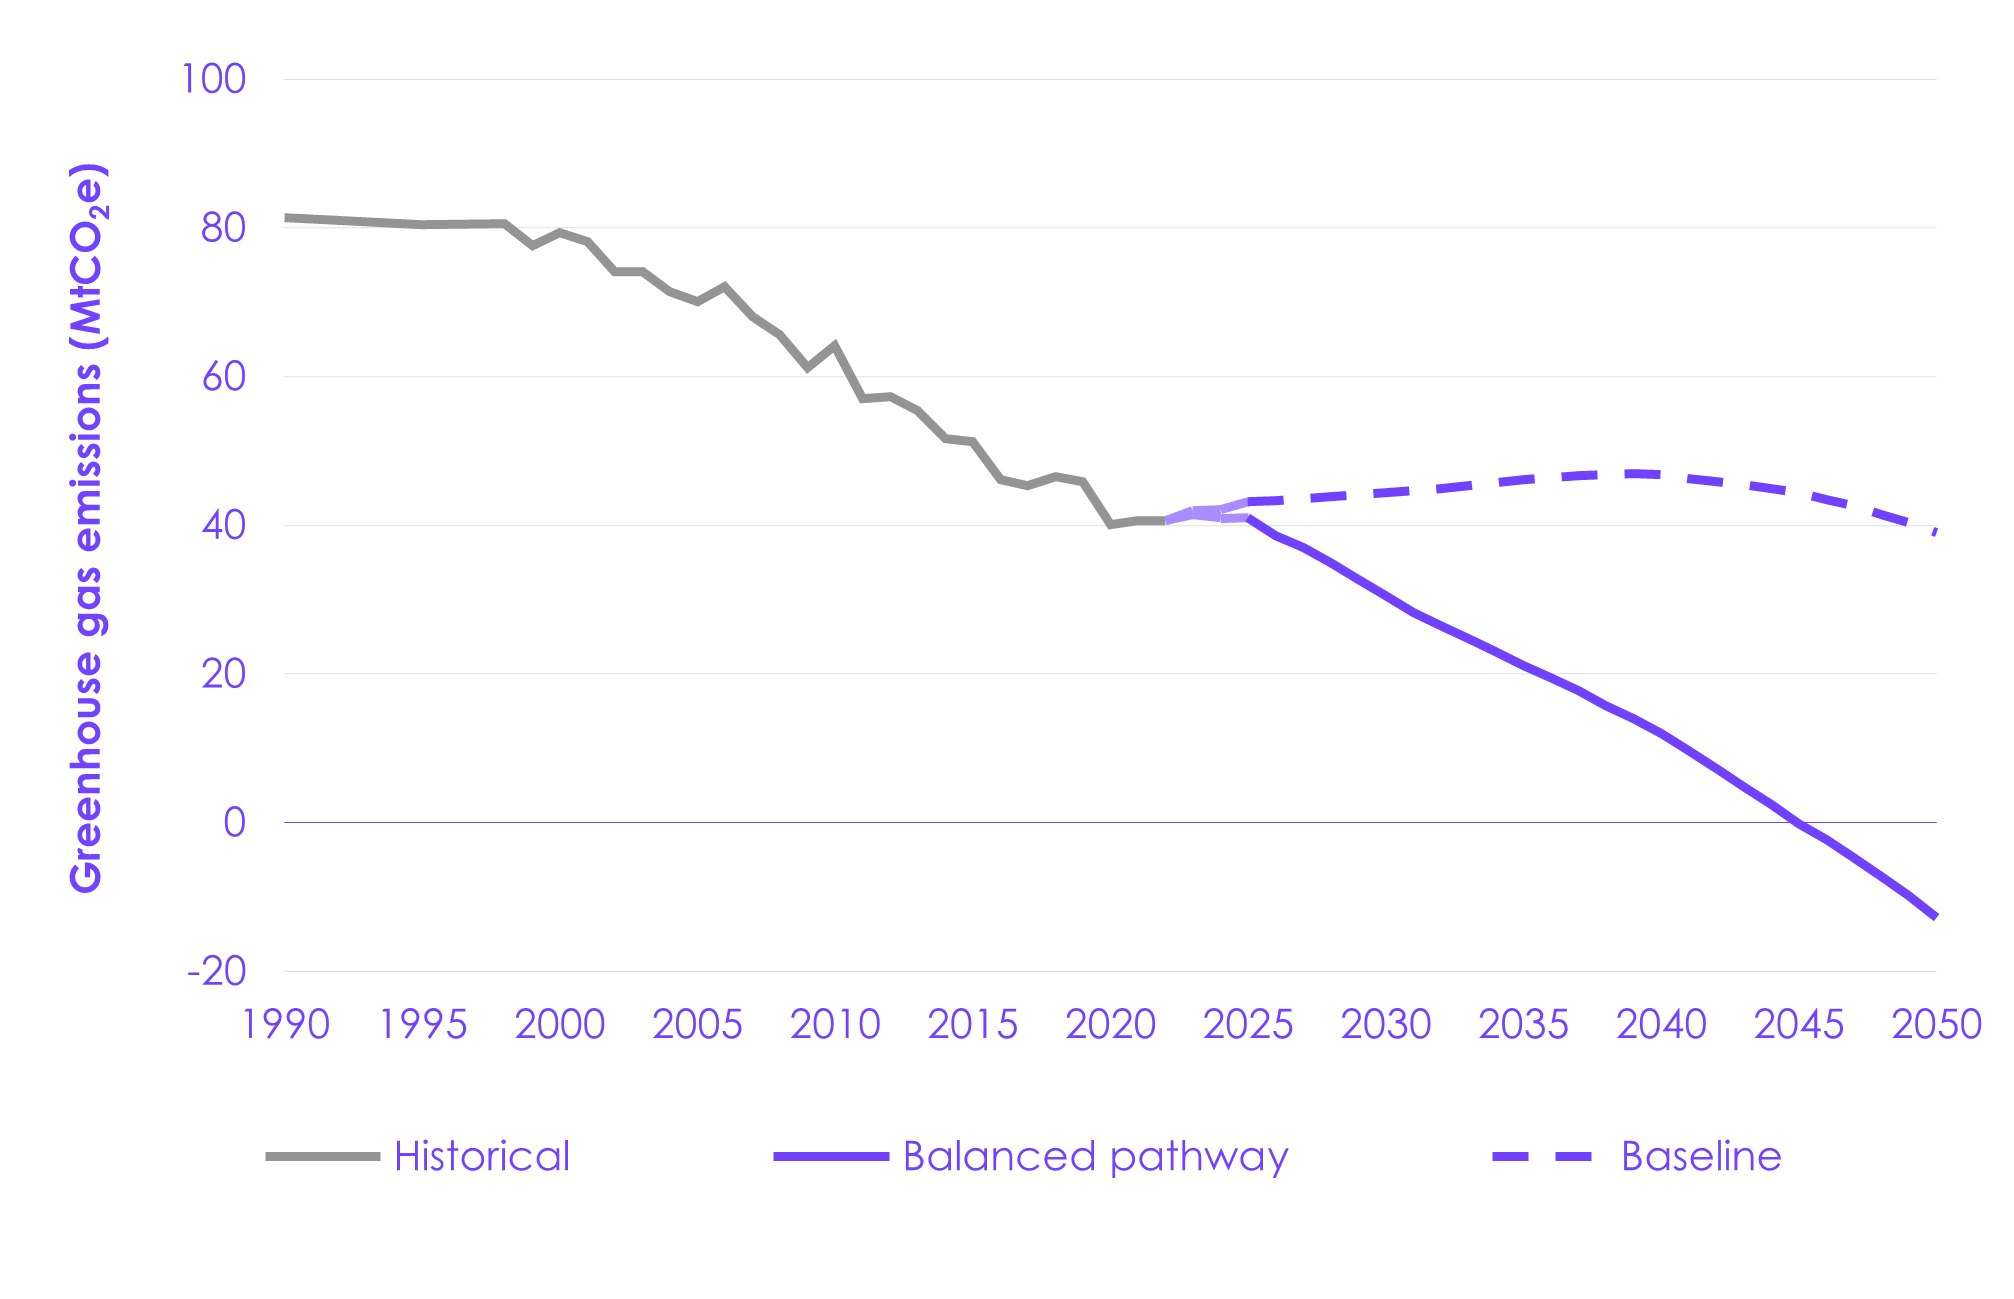
These carbon budgets are given as five-year average percentage reductions from 1990 levels. As of 2022, the latest year for which there is data, emissions were 50% below 1990 levels (Figure 1).
Our advice shows that these proposed carbon budgets are deliverable and Scotland can achieve its 2045 Net Zero target. Our advice is based on the latest technological, social, and economic evidence; extensive sector modelling; and engagement with stakeholders. The Committee’s advice also considers the relationship of UK-wide action on climate change to specific features of the Scottish economy and devolved powers. Our recommendations are based on our Balanced Pathway: an ambitious but credible route to Net Zero for Scotland by 2045.
Achieving these targets would mean households benefit from more efficient technologies, less draughty homes, and cleaner air. For many households, changes to travel and home heating will lead to savings, provided appropriate policy is in place.
Getting to Net Zero by 2045 will require immediate action, at pace and scale. While the Committee offers advice, decisions on the exact pathway and policies within devolved powers are for the Scottish Government and the Scottish Parliament.
Progress to date has largely come from electricity decarbonisation, reflecting Scotland’s abundant renewable resources. This is a reserved area of policy and Scotland has benefited from measures across Great Britain’s electricity system. Action will increasingly be required in predominantly devolved policy areas to hit the Net Zero 2045 target and the proposed carbon budgets. Now that the framework for climate action has been reset, the Scottish Government has the opportunity to use its powers to match its ambitions with action.
Alongside this, the Scottish Government will need to continue working with the UK Government, the Welsh Government and the Northern Ireland Executive to make progress where powers are shared or remain reserved. Making electricity cheaper, through rebalancing prices to remove policy levies from electricity bills, is a key recommendation the Committee have made to the UK Government and will be essential to delivering Scotland’s targets, in tandem with action by the Scottish Government.
|
Figure 1 The recommended carbon budgets for Scotland |
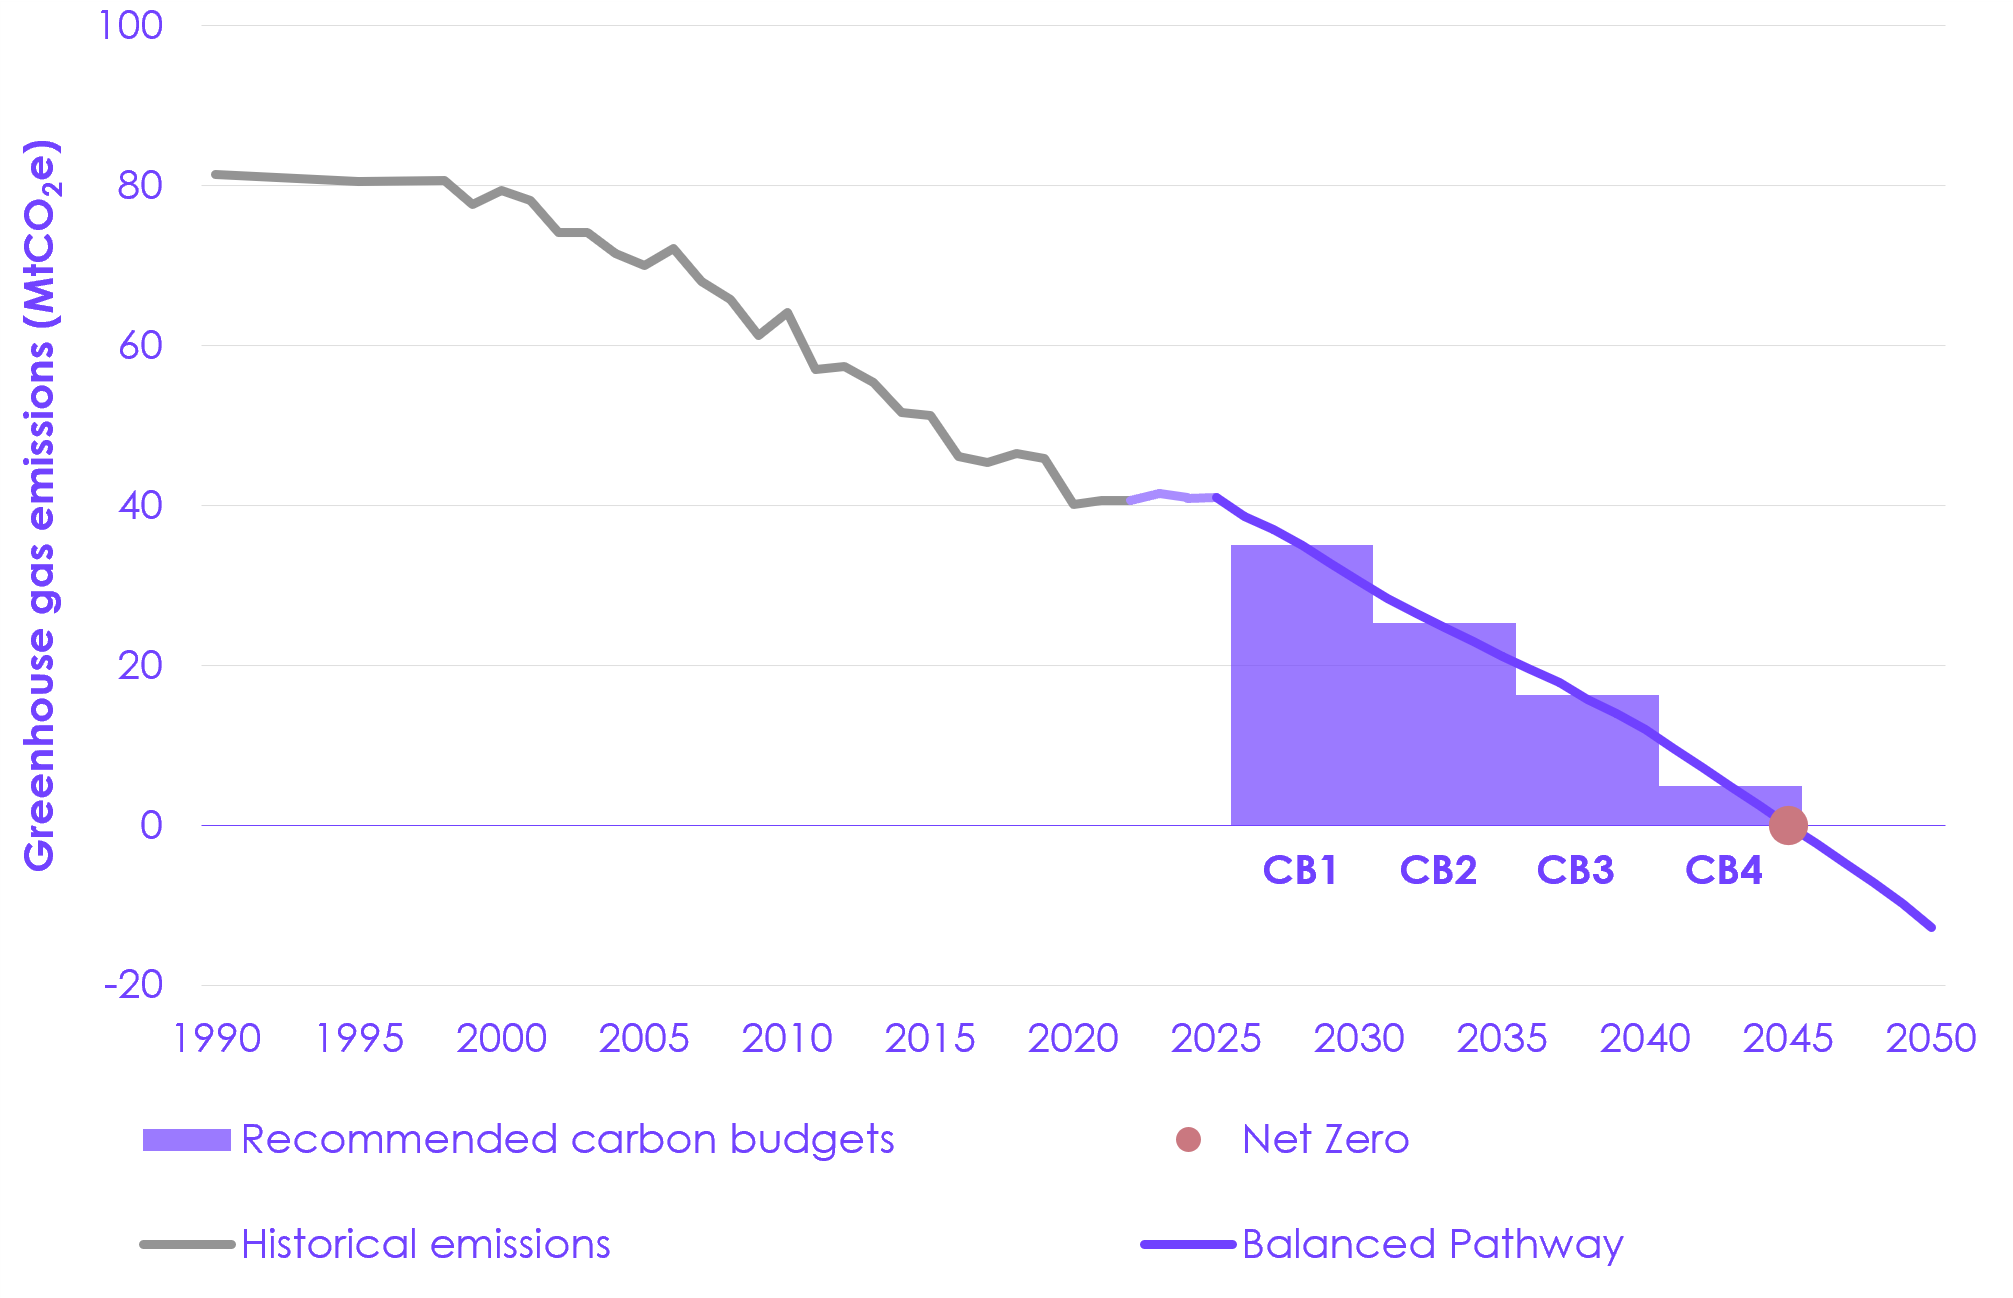
Description: The Balanced Pathway sets the recommended level of Scotland’s carbon budgets. |
Fair and safe Scottish emissions budget
The Act requires the setting of a ‘fair and safe Scottish emissions budget’. This is defined as the aggregate amount of net Scottish emissions of greenhouse gases for the period 2010 to 2050, consistent with Scotland contributing appropriately to holding the increase in global average temperature in line with the Paris agreement goal.[1] The Committee recommends that the fair and safe Scottish emissions budget is set at 1,129 MtCO2e. Reducing emissions in line with our Balanced Pathway would keep Scotland within this proposed fair and safe Scottish emissions budget.
Priority actions
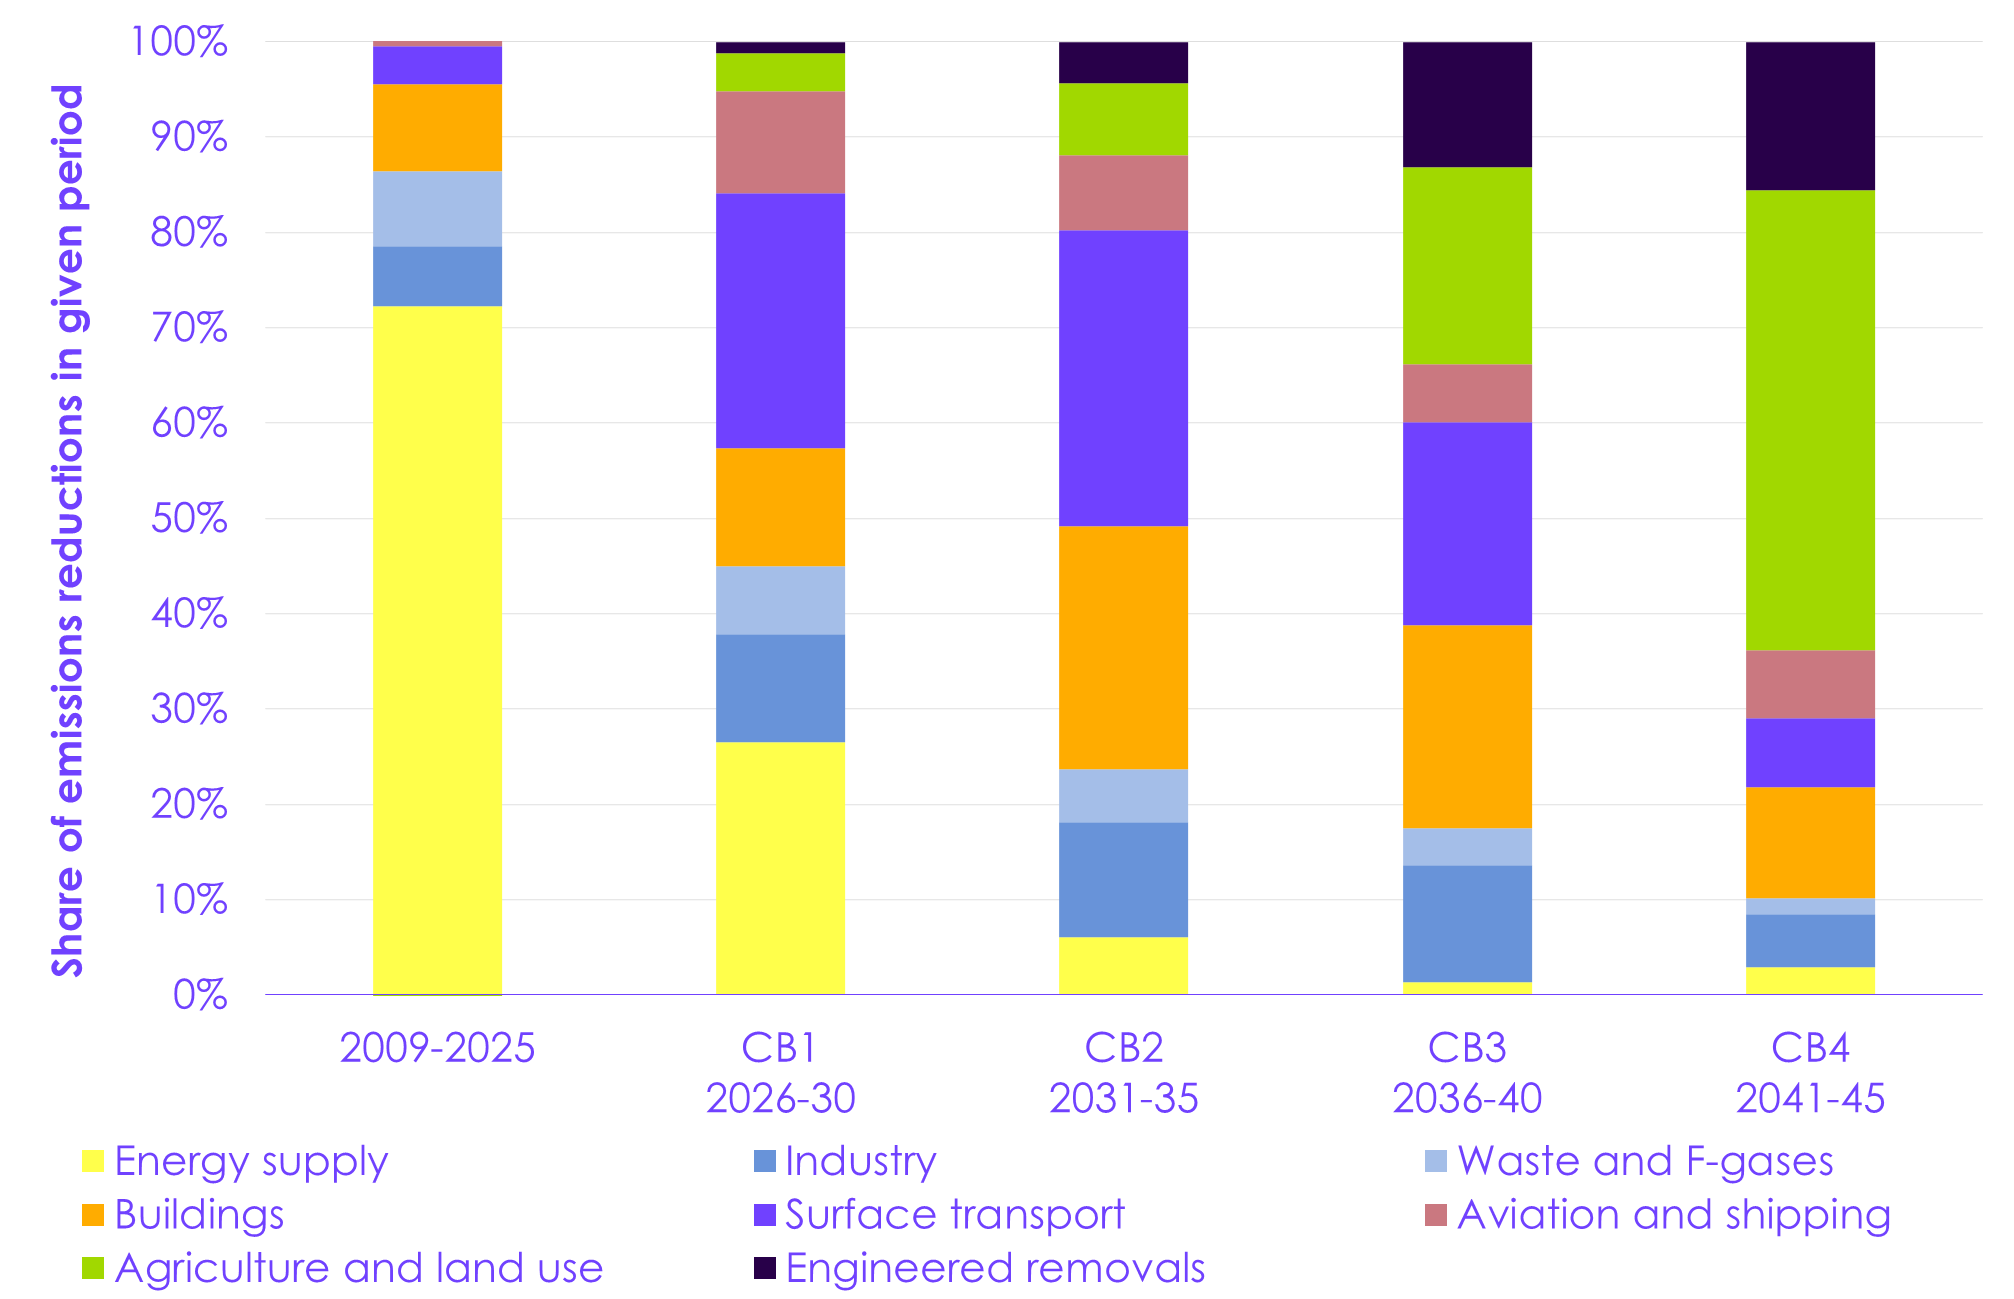
Since the introduction of the Act in 2009, over 70% of the emissions reduction seen in Scotland has been in the energy supply sectors. This is largely due to the phase-out of coal and the ramp-up of renewable electricity generation. The last coal power station in Scotland closed in 2016. Since then, emissions reductions have slowed (outside the effects of the COVID-19 pandemic). Achieving our recommended carbon budgets will require Scotland to resume the pace of emissions reduction that was seen between 2009 and 2016, with contributions broadening to more sectors across the economy (Figure 2).
Electric technologies are now the clear low-carbon choice in many areas. Technologies such as heat pumps and electric vehicles (EVs) are available today and could be deployed rapidly, provided the right incentives are in place. Almost half of emissions reductions in our Balanced Pathway come from electrification, particularly the roll-out of EVs and heat pumps and the remaining decarbonisation of electricity generation.
Emissions reductions from surface transport are the largest contribution to meeting the first two carbon budgets. With the cost of EVs falling, the Scottish Government has an important role in enabling successful implementation of the zero-emission vehicle (ZEV) mandate, including by expanding provision of charging infrastructure and providing reliable public information on EVs. The Scottish Government should also promote modal shift away from cars by improving public transport services and active travel infrastructure.
Emissions reductions from buildings are the second largest contribution to meeting the first two carbon budgets in our pathway. Together with energy efficiency measures, more efficient electrified heating can help reduce fuel poverty in Scottish households. Clean, efficient, electric technologies can offer wider benefits such as reduced air pollution and lower and less volatile energy bills compared to continued reliance on fossil fuel technologies.
It has been 18 months since the Scottish Government initially consulted on the Heat in Buildings Bill, which the Committee described in our 2023 report on Progress in reducing emissions in Scotland as a potential template for other parts of the UK. It is therefore disappointing that the proposals for regulations to upgrade properties at the point of sale have been abandoned, with, as yet, no specific alternative measures to deliver the target for heating to be zero emissions by 2045.
By the time of the Third and Fourth Carbon Budgets, the agriculture and land use sectors will be making the biggest contribution to emissions reduction in our pathway for Scotland. Together, agriculture and land use can reach Net Zero by 2045. Natural carbon sequestration, mostly increased tree planting and restoration of degraded peatlands, offsets the remaining emissions from livestock in 2045. This requires rapid scaling up of tree planting now because of the time it takes for trees to mature and start absorbing substantial amounts of carbon. The Scottish Government will need to support farmers and rural communities to diversify their incomes away from livestock farming and towards woodland creation, peatland restoration, agroforestry, and renewable energy.
|
Figure 2 Distribution of emissions reductions during each carbon budget period in the Balanced Pathway in Scotland |
|
Description: Action to reduce emissions is needed across a wide range of sectors. While the vast majority of emissions reductions to date since the introduction of the Climate Change (Scotland) Act 2009 have come in the energy supply sector, increasing contributions will be required from other sectors to meet the carbon budgets. |
Sources of future emissions reductions
The First and Second Carbon Budgets cover the next decade. In our pathway, they are predominantly met from electrification of key technologies across the economy and measures to reduce demand for high-carbon activities (Figure 3). There are also important contributions from low-carbon farming, low-carbon fuels, and carbon capture and storage (CCS). For the Third and Fourth Carbon Budgets, nature and engineered removals play more of a role in offsetting emissions in areas in which electrification is not possible. Action is needed now to ensure Scotland can deliver these future reductions.
1. Electricity
Electric technologies are now the clear low-carbon technology choice in many areas, including surface transport, buildings, and much of industry. They are available today and could be deployed rapidly in many cases, provided the right incentives are put in place. Scaling up these immediate options is key to meeting all of Scotland’s carbon budgets. Throughout the Balanced Pathway, electrification delivers almost half of the total required emissions reduction.
- Low-carbon supply: in our pathway, the capacity of variable renewables in Scotland (including offshore and onshore wind and solar) more than triples from 15 GW in 2023 to 49 GW by 2035, increasing to 66 GW by 2045. This provides 98% of electricity generation in Scotland in 2035 and caters for increasing demand in Scotland and the rest of Great Britain (GB). Grid storage, use of storable fuels on the GB-wide network, and smart demand flexibility ensure a reliable supply of electricity even in adverse weather years. These technologies need to be accompanied by rapidly expanding the transmission grid, upgrading the distribution network, and speeding up the grid connection process. To deliver clean electricity, the planning process to approve large electricity infrastructure projects in Scotland needs to be urgently improved.
- EVs: by 2035, around three-fifths of cars and vans on Scottish roads are fully electric in our pathway, compared to 2.2% for cars and 0.8% for vans in 2023. By 2045, this rises to 94% of cars and vans. This requires a rapid increase in the market share of new electric cars and vans, underpinned by the falling costs of EV batteries, with new electric cars and vans expected to reach price parity with petrol and diesel vehicles between 2026 and 2028.
- Heat pumps: by 2035, 40% of existing homes are heated by low-carbon electric systems in our pathway. The majority of these (around a quarter of existing homes) are heated by a heat pump, either as standalone or communal systems, with the rest heated by heat networks or direct electric systems.[2] By 2045, 92% of existing homes have low-carbon heat, reaching all homes by 2050. Annual heat pump installations in existing homes will need to accelerate rapidly, reaching nearly 35,000 by 2030. This rate of increase is in line with that seen in other European countries, such as the Republic of Ireland and the Netherlands. While this rapid increase in installation rates is feasible, it requires immediate policy support. For tenement buildings, communal heat pumps, including high temperature systems, and heat networks are likely to be the best solutions in many cases. Appropriate governance frameworks will be needed to coordinate residents and support their delivery.
- Industrial electrification: by 2035, the proportion of industrial energy supplied by electricity in our pathway doubles from levels in 2025, reaching around a third. This rises to 58% by 2045. Electric alternatives, such as electric steam crackers in the chemicals sector, replace most types of fossil fuel-fired industrial equipment. Electrifying industry allows manufacturers in Scotland to benefit from global demand for low-carbon goods.
2. Demand
Measures to reduce demand for high-carbon goods and services can be enacted from today and are particularly important to reduce emissions while high-carbon technologies are still being replaced by low-carbon alternatives. They can also deliver savings and health benefits. In 2035, 40% of cars and 60% of home heating systems in Scotland are still powered by fossil fuels in our pathway, so reducing demand and improving efficiency present a significant opportunity to decrease emissions over the first two carbon budgets.
- Increased efficiency: by 2035, our pathway sees cost-effective resource and/or energy efficiency measures deployed across most sectors. This includes home insulation, more efficient use of resources in industry, and reductions in commercial, household, and food waste.
- Low-carbon choices: by 2035, our pathway sees people make some shifts towards lower-carbon choices, including a shift to public transport and active travel, and a reduction in meat (especially beef and lamb) and dairy consumption, within overall healthier diets. This is enabled by making alternatives more available, cheaper, and more attractive. Diet change leads to reductions in livestock herds and their associated emissions as well as freeing up land for nature (see below). Flying remains close to today’s levels until technology develops, with flights to and from the Highlands and Islands assumed to continue, providing essential connectivity.
3. Low-carbon farming, low-carbon fuels, and CCS
While electrification is the main technological decarbonisation solution in key sectors, there is also an important supporting role for low-carbon fuels and CCS to address sources of emissions that are less well suited for electrification. Agriculture is a significant source of emissions in Scotland, so developing low-carbon farming practices is essential. Together, these make up around 10% of the total emissions reductions required in the Balanced Pathway.
- Low-carbon farming: a number of low-carbon farming practices and technologies are introduced in our pathway, providing around half the emissions reductions in the agriculture sector. Livestock dominates the sector in Scotland, with feed additives and waste and manure management being the most important measures.
- Low-carbon fuels: ships transition to a mix of low-carbon fuels, predominantly low-carbon ammonia and synthetic fuels. Planes transition to using some sustainable aviation fuels. Hydrogen plays a small but important role in industry and in larger off-road mobile vehicles in agriculture. However, we see no role for hydrogen in heating for buildings.
- CCS: carbon capture and storage plays an important role in industry, for example capturing emissions from chemicals and cement production. It is also used for some low-carbon hydrogen production, at Scotland’s energy from waste plants, and to underpin engineered removals in our pathway.
4. Nature
Nature-based measures, including restoring peatland and planting new woodland, are integral in growing land-based carbon sequestration. Together with renewables and agroforestry, they provide opportunities for Scottish farmers and land managers to diversify their income streams away from livestock farming.
Nature-based measures are vital for Scotland to achieve its longer-term targets, contributing 8% of the emissions reductions required by 2035. This increases to 13% by 2045. There is a delay between the planting of woodlands and the time it takes for them to reach peak rates of absorbing CO2, so immediate action is needed to capture these benefits later in the pathway. Scaling up these nature-based actions allows agriculture and land use together to reach Net Zero emissions by 2045.
- Peatlands: rewetting and restoration of degraded peatlands delivers the majority of the emissions reductions in land use in our pathway. Our pathway sees a rise in the proportion of peatland under such management from the current 29% to 45% in 2035, and to 67% by 2045.
- Woodland and agroforestry: 38% of the new woodland created in our UK-wide pathway between 2025 and 2050 is in Scotland. The proportion of woodland cover in Scotland rises from the current 19% to 21% in 2035, and 23% by 2045. Delivering this will require support for land managers and farmers to more than double planting rates over the next decade. Trees and hedges on farms also play a role, supporting continued food production alongside sequestration in vegetation and soils.
5. Engineered removals
Engineered removals help to balance residual emissions from sectors that cannot fully decarbonise. With emissions from agriculture balanced by land use sinks in our pathway, engineered removals are used to balance small residual emissions, especially in aviation and industry. Engineered removals contribute around 10% of the total emissions reductions required by 2045.
Our pathway sees a gradual ramp-up in engineered removals starting at the end of the First Carbon Budget and reaching -3.6 MtCO2e by 2045. It is predominantly a mix of direct air carbon capture and storage (DACCS) and bioenergy with carbon capture and storage (BECCS), with smaller contributions from enhanced weathering and biochar.
The amount of engineered removals in 2045 is driven by the need for the UK as a whole to balance residual emissions to achieve Net Zero in 2050, and a feasible scale-up to reach that level. Scotland’s share of engineered removals technologies is based on geographical assumptions in our pathway, such as the location of existing facilities and expected CCS clusters.
|
Figure 3 Sources of abatement in the Balanced Pathway |
|
Description: Scotland’s carbon budgets are delivered through five key routes: electricity; demand, low-carbon farming, low-carbon fuels, and CCS; nature; and engineered removals. The largest share of emissions reduction is from the switch from fossil fuels to electric technologies powered using low-carbon electricity. |

The cost of the transition
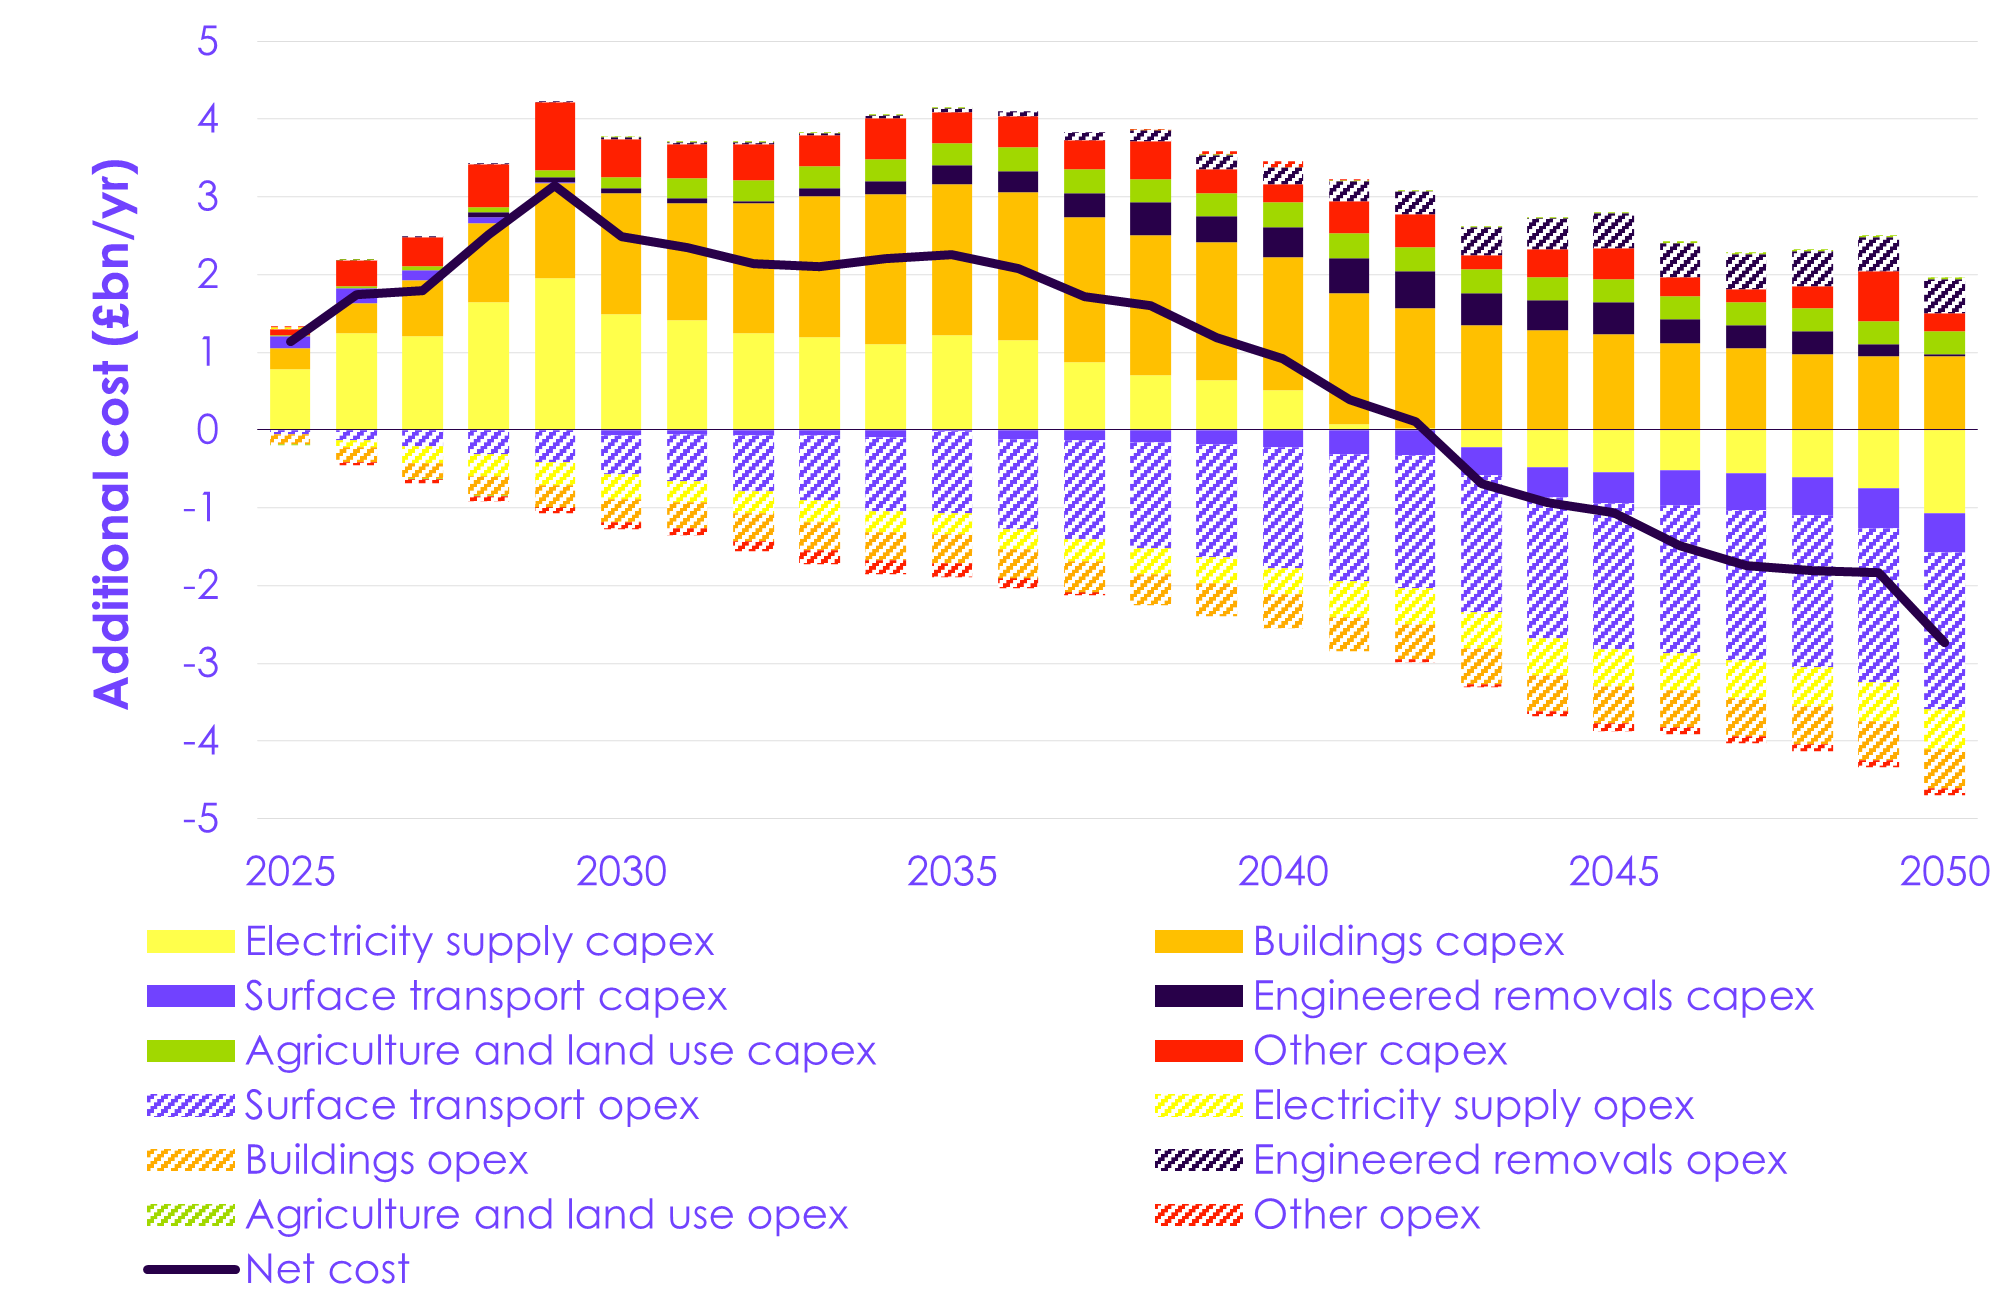
The Balanced Pathway requires upfront investment. In many sectors, this will lead to significant savings in the future as inefficient fossil fuel technologies are replaced by more efficient, low-carbon alternatives. When combining capital and operating costs, we expect the Balanced Pathway to result in a net saving during the early 2040s. On average, there will be a net cost of around £750 million per year between 2025 and 2050, which is around 0.4% of Scotland’s GDP (Figure 4).
- EVs will lead to a significant cost saving. Electric cars and vans are already generally cheaper to run and maintain, and will soon be cheaper to buy, than their fossil fuel-based alternatives. Households will see a significant reduction in the cost of driving.
- Heat pumps are more efficient than gas boilers, which should lead to lower household energy bills provided electricity is made cheaper, reflecting its true economic cost. However, homes in Scotland are predominantly designed around gas heating and will need a one-off improvement to be suitable for heat pumps in many cases. This upfront investment is a sizeable element of the total costs, and households will require policy support with these one-off costs.
- Electricity supply requires upfront investment in renewable generation and grid infrastructure. With much lower operating costs, this generates savings over time in our pathway.
- We include the costs of engineered removals in our costs analysis. Who pays for removals is a policy choice. In our UK-wide Seventh Carbon Budget advice (2025), we assumed that the costs of removals, UK-wide, are predominantly borne on a ‘polluter pays’ basis by industries such as aviation that have residual CO2 emissions. These costs would therefore be met by people across the UK, rather than necessarily in Scotland.
|
Figure 4 Additional capital expenditure and operating costs in the Balanced Pathway, compared to the baseline |
|
Description: Additional costs in the Balanced Pathway are frontloaded, peaking in 2029. Capital costs are offset by operating savings in later years, with the pathway becoming a net cost saving overall in 2043. |
Households and the economy
So far, emissions reductions in Scotland have largely involved actions by business and government. To meet Scotland’s carbon budgets, households will need to make some changes. The most important will be to buy heat pumps (including communal systems) and electric cars, when it is time to replace fossil fuel boilers or cars; to eat less meat and dairy, building on current dietary trends; and to keep flying close to today’s levels until technology develops. Policy and business action will need to make household low-carbon choices easy, attractive, and affordable, and ensure trusted information is provided to the public.
Households in Scotland, including those in less energy efficient properties or in fuel poverty (31% of Scottish households in 2022), will benefit from more efficient technologies, lower bills, less draughty homes, and cleaner air.
Most sectors of the economy, particularly in services, will see little change in activity other than switching to low-carbon heating and vehicles. However, it will be important to plan carefully for some sectors and regions:
- The oil and gas industry has been a key part of the Scottish economy, and in particular the local economy in Aberdeen and North East Scotland, for decades, alongside other industries. Regardless of the Net Zero transition, North Sea production will continue to decline, creating a requirement for new sources of well-paid employment. The Net Zero transition presents opportunities in low-carbon offshore industries, electricity network development, and onshore wind. The Scottish Government should work with communities, workers, and businesses to develop proactive transition plans that enable access to secure employment and business opportunities that come with the Net Zero transition.
- The Scottish Government needs to engage with farmers and their communities, and support them to diversify their incomes, including towards woodland creation, peatland restoration, agroforestry, and renewable energy. This should keep in mind implications for Scottish heritage and culture. UK-wide policy must protect against risks of carbon leakage from agricultural imports. In the Balanced Pathway, a reduction in demand for meat and dairy across the UK avoids imports of these products increasing. Carbon border adjustment mechanisms may also be needed.
Key actions
We have 18 priority recommendations for immediate action to put Scotland on track to deliver the carbon budgets. The full set can be found in Annex 1. Core themes include:
- Supporting households to install low-carbon heating. Scotland needs to rapidly transition to low-carbon electrified heat. While the transition should lead to lower energy bills for consumers, continued support is needed to address barriers in upfront costs, especially for low-income households. The Scottish Government urgently needs to develop an alternative to the abandoned proposals in the Heat in Buildings bill for regulations to upgrade properties at the point of sale. This will need to enable a rapid transition from fossil-fuel heating systems to low-carbon heating in privately owned homes, supporting the proposed heating decarbonisation target. The Scottish Government will need to develop governance frameworks to allow for the installation of communal low-carbon heating systems, where these are appropriate (in particular, in tenements).
- Supporting households to install home insulation measures. It is also important to provide effective support to households, particularly those on low incomes, to install home insulation measures. The Scottish Government should urgently consult on the details of the proposed minimum energy efficiency standards for privately owned homes, noting that delaying this further could have negative impacts on fuel poverty in Scotland.
- Expanding EV charging and travel infrastructure. The Scottish Government should support the deployment of public charge points across Scotland. The number of public EV charge points per capita in Scotland is 7% higher than the UK average but will need to continue to increase in line with EV uptake. With prices for new and second-hand EVs falling, there is an opportunity for rapid take-up provided the right infrastructure is in place and people are provided with accessible, accurate information on their benefits. Scotland should also invest to improve public transport services and active travel infrastructure.
- Farming and nature. Long-term certainty is needed on public funding for farming practices and technologies to reduce emissions from managing crops and livestock. The Scottish Government should provide incentives and markets for farmers and land managers to diversify their incomes for actions including woodland creation, peatland restoration, agroforestry, and renewable energy.
- Engagement. The Scottish Government should work with the UK Government to develop the existing engagement strategy. This should provide clear, trusted information about the most impactful low-carbon choices for households and businesses in Scotland to reduce emissions, and the benefits of low-carbon choices, signposting to available sources of advice and support.
- Jobs and industry. The Scottish Government should continue to work with the UK Government to support the development of plans to develop CCS and hydrogen in the Scottish Cluster and work with the UK Government to develop new low-carbon industrial opportunities, such as those identified by Project Willow for Grangemouth. The Scottish Government should work with communities, workers, and businesses to develop proactive transition plans that enable access to secure employment and business opportunities that come with the Net Zero transition.
Next steps
The Committee provides advice but does not set policy. Decisions remain with the Scottish Government and the Scottish Parliament. As set out in the Act, the Scottish Government needs to lay draft regulations to set the carbon budgets within three months of receiving this advice. The Scottish Government must also lay before the Scottish Parliament a draft Climate Change Plan (CCP) containing its proposals and policies to meet legislated emissions reduction targets for the relevant period of the CCP within two months of the regulations setting the carbon budgets coming into force.
We are only 20 years away from 2045. To deliver the pathway to Scotland’s Net Zero target, immediate action is necessary. The First Carbon Budget begins next year and requires significant reductions in emissions across the economy. Many of the actions needed are in devolved areas, where the Scottish Government has substantial powers. With a new framework of carbon budgets in place, it is time for the Scottish Government to take action to drive emissions reductions, cut bills, and increase the resilience of the Scottish economy.
Chapter 1: Introduction
Introduction and key messages
This report sets out the Committee’s advice to the Scottish Government on the level of Scotland’s carbon budgets, covering the period 2026 to 2045, as required by the Climate Change (Scotland) Act 2009 (‘the Act’). Our advice is based on analysis underpinning our UK-wide Seventh Carbon Budget advice. That advice report contains more detail on the analysis.
This chapter summarises the latest scientific knowledge about climate change, sets out Scotland’s current targets under the Act, and summarises current emissions trends in Scotland.
Our key messages are:
- The Earth’s climate is changing rapidly as human-induced warming is increasing at an unprecedented rate. Risks are increasing – extreme weather events show the impact that climate change is already having, globally, in the UK, and in Scotland. Every 0.1°C of additional warming creates increasing threats from climate change.
- The science is clear that human activities have driven increases in greenhouse gases (GHGs) in the atmosphere to levels not previously experienced by our species. Long-term human-induced warming now reaches around 1.3ºC above pre-industrial levels and is rising at over 0.2ºC per decade.
- Net Zero CO2 emissions as well as deep reductions in other GHG emissions globally are required to halt further global warming. While it is now almost inevitable that warming levels will exceed 1.5ºC in the next ten years, it may still be possible to limit warming close to 1.5ºC in the longer term, provided deep global emissions cuts begin immediately.
- Global action must speed up. The UN Framework Convention on Climate Change (UNFCCC) process, the Paris Agreement, government policies, action from non-state actors, and market initiatives are driving progress. Global GHG emissions are likely near their peak, and on a per capita basis have begun to fall. But much more action is needed.
- Emissions in Scotland, including Scotland’s share of international aviation and shipping, have decreased by 50% since 1990.[3] The highest-emitting sectors in 2022 were surface transport, agriculture, industry, and residential buildings, with significant contributions from other sectors.
1.1 The latest scientific knowledge about climate change
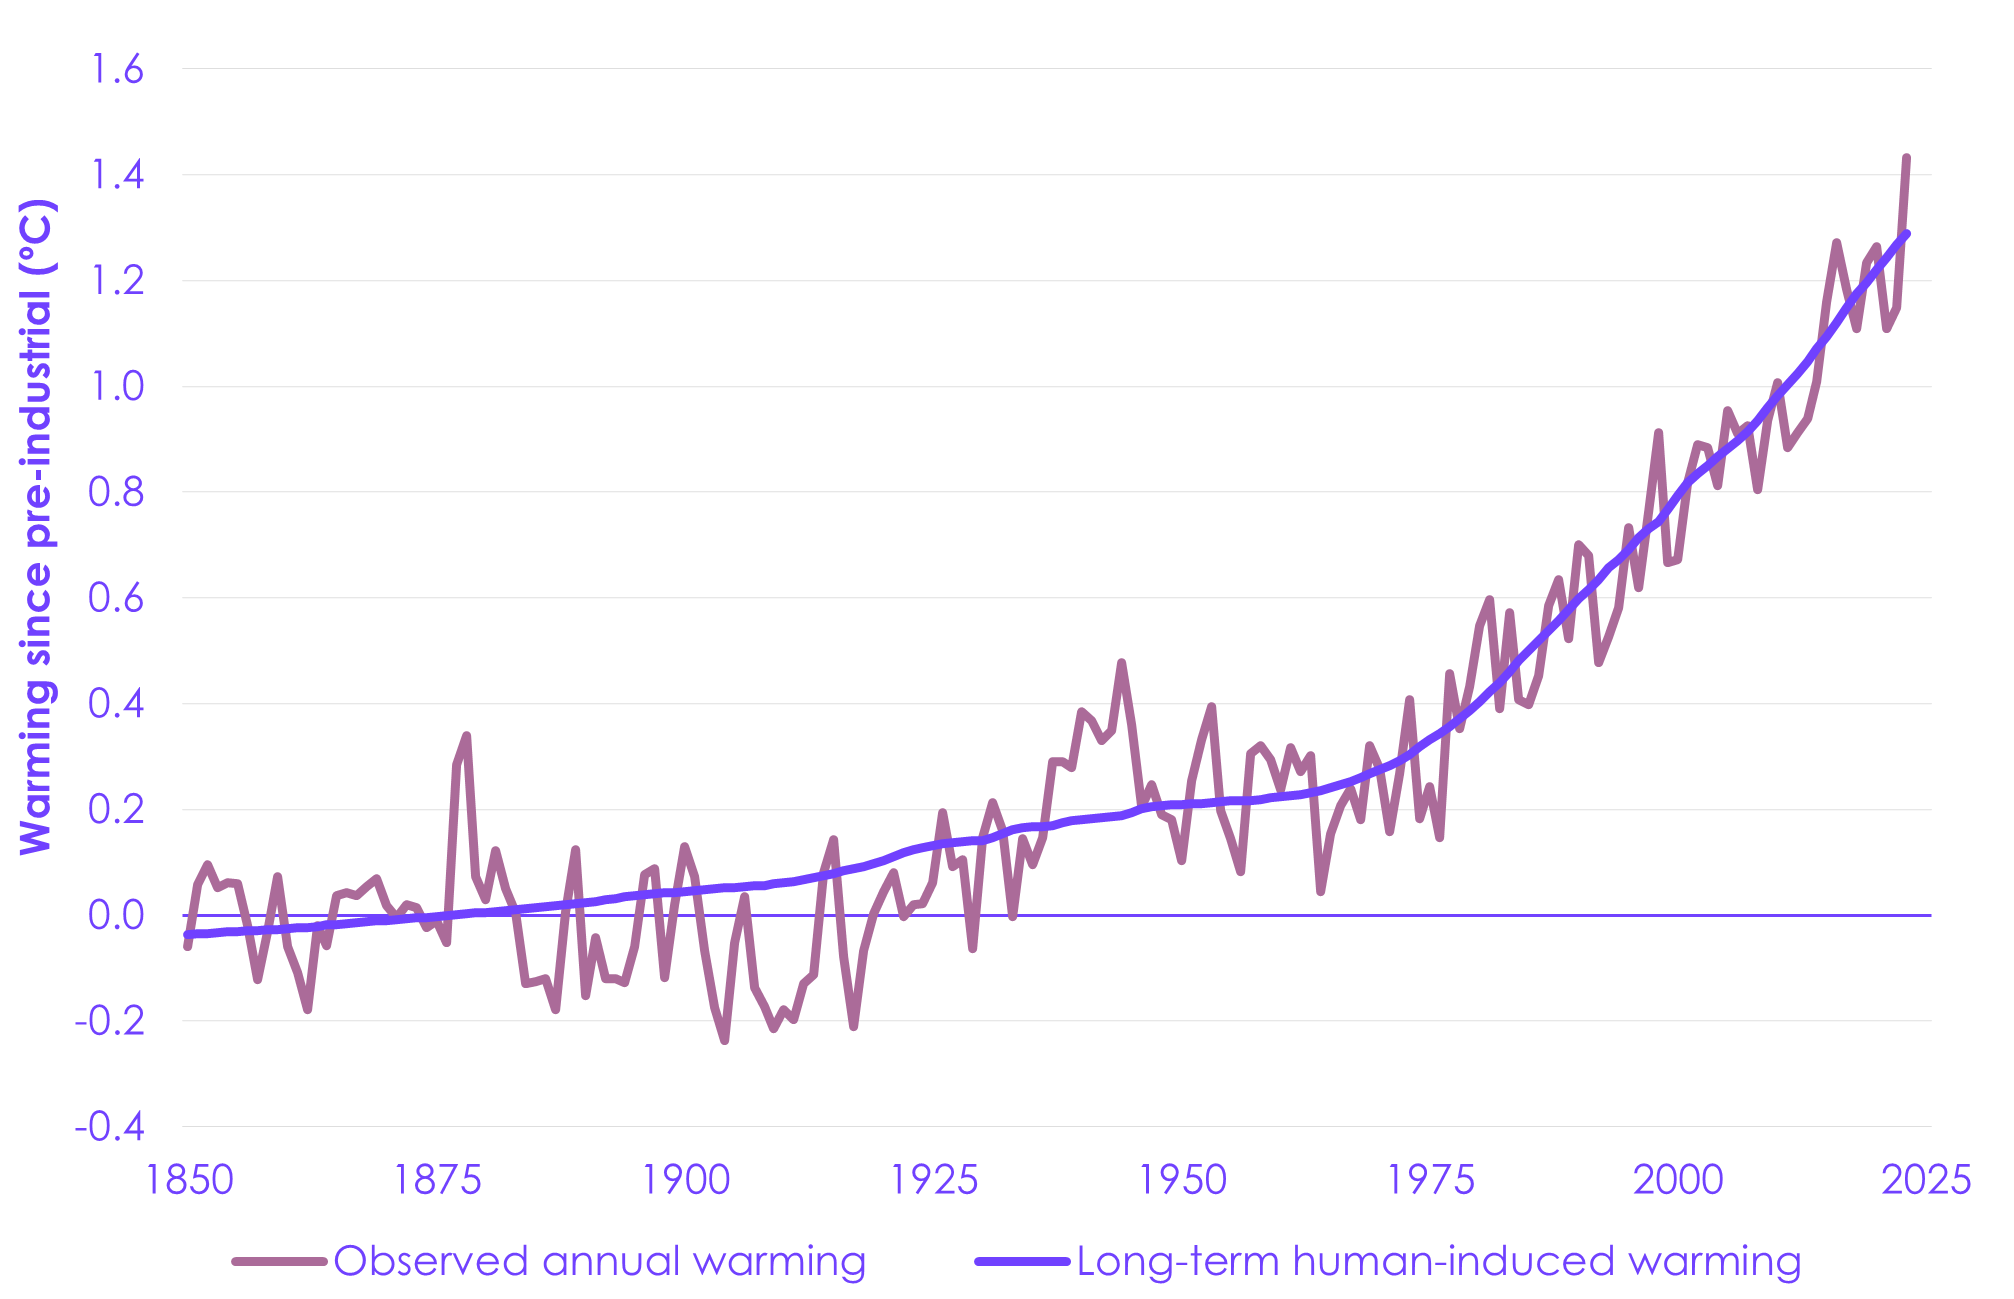
Global temperatures are rising (Figure 1.1). Since 2020, climate and weather records have continued to be broken around the world.
- Global temperatures have continued to increase. 2024 was the warmest year on record, at 1.6ºC above pre-industrial average levels.[4] Long-term human-induced global warming in 2023 is estimated to have risen to 1.3ºC (1.1 to 1.7ºC, 5th to 95th percentile range) above pre-industrial average levels.[5] The rate of increase is unprecedented, reaching 0.26°C per decade over 2014 to 2023.[6];[7]
- Records for climate and weather extremes continue to be broken. In 2023, ocean heat content reached its highest level in the 65-year observational record and global mean sea level reached a record high. Extreme weather events, such as wildfires and flooding, led to widespread loss of life and property destruction.[8]
- Warming will inevitably continue in the near term. Global temperatures will continue to rise until the point when the world reaches Net Zero CO2 emissions, with deep reductions in other GHGs also needed to limit warming.[9] This continued warming means that the world is rapidly approaching the lower end of the Paris Agreement long-term temperature goal (see Box 1.1).
|
Figure 1.1 Global average temperature rise |
|
Description: Since 1850, global average temperatures have been increasing, with a particular acceleration beginning around 1970. Observed annual temperatures fluctuate around long-term human-induced warming. |
| Box 1.1 Global warming of 1.5°C |
|
Long-term warming The 2015 Paris Agreement has a single long-term temperature goal: ‘holding the increase in the global average temperature to well below 2°C above pre-industrial levels and pursuing efforts to limit the temperature increase to 1.5°C above pre-industrial levels’. While not formally defined in the Agreement itself, the warming levels referenced in this goal are widely interpreted as referring to multi-decadal human-induced average warming, excluding short-term natural variability.[10] For simplicity, this is often referred to as ‘long-term warming’. Since 2015, advancing climate science has further highlighted risks of exceeding 1.5ºC of long-term warming. The UNFCCC Conference of the Parties (COP) has recognised these risks and put a greater focus on pursuing efforts to keep to 1.5°C above pre-industrial levels – such as in the agreed conclusions on the first Global Stocktake under the Paris Agreement which concluded in 2023. Long-term global warming, as measured according to this interpretation, has not yet exceeded 1.5ºC above pre-industrial levels, but it is rapidly approaching it. Estimates of current human-induced long-term warming are around 1.31ºC above pre-industrial levels and are rising at 0.26ºC per decade.[11] Short-term variability The Earth’s temperature also experiences short-term fluctuations on both annual and monthly timescales which can temporarily increase or lower global temperatures from the human-induced long-term average. A major contributor to this is the El Niño cycle – which occurs in the Pacific but has a large impact on global temperature. The large and persistent El Niño occurring over late 2023 and 2024 was one of the reasons that global average temperature anomalies have repeatedly, but temporarily, reached 1.5ºC or higher above pre-industrial levels. February 2023 to January 2024 was the first 12-month period where the mean global average temperature exceeded 1.5ºC above pre-industrial levels, and June 2024 marked the twelfth consecutive month to reach or surpass 1.5ºC warming.[12] 2024 was the warmest calendar year on record, surpassing 1.5ºC warming for the first time.[13] This does not mean that the long-term temperature goal of the Paris Agreement has been breached; limiting long-term warming to 1.5ºC remains a central goal in the UNFCCC process. Looking ahead While it is theoretically possible to return long-term warming to below 1.5ºC following a limited overshoot, every increment of global warming brings additional risks, both in terms of climate impacts and to the chances of bringing warming back down over time.[14]
|
1.1.2 Global emissions
There is a near-linear relationship between cumulative anthropogenic CO2 emissions and the global warming they cause. Continued emissions of CO2 and other long-lived GHGs therefore imply continued warming.[21]
Global GHG emissions grew steeply throughout the second half of the 20th century and have continued to grow over recent years, albeit at a slowing rate.
- Annual net global CO2 emissions from fossil fuels and land use, land use change, and forestry (‘land use’) in 2023 were around 41 GtCO2.[22] This makes 2023 emissions approximately joint highest in the modern record, with 2019.
- The rate of increase has slowed over the past decade. The rate of growth in global fossil CO2 emissions peaked at nearly 3% per year during the 2000s but has slowed in the last decade to less than 1% per year on average.[26]
- Various sources expect global emissions to peak this decade.
- The International Energy Agency and Bloomberg New Energy Finance both project an immediate or mid-2020s peak for energy sector CO2 emissions under current policy settings.[29];[30]
- The UNFCCC assesses that if countries implement their 2030 emissions targets in full, global GHG emissions will peak in the 2020s.[31]
1.1.3 Latest scientific understanding
The Intergovernmental Panel on Climate Change (IPCC) completed its Sixth Assessment Report (AR6) cycle in 2023. This brings together the last five years of scientific studies and provides the scientific basis for this report. It concluded that human activities have ‘unequivocally caused global warming’, and that limiting human-induced global warming to 1.5ºC requires deep, rapid, and sustained reductions in GHG emissions.
- Global temperatures are increasing as a result of human activities. The increase in average global surface temperatures has been driven by increases in GHG concentrations, which have unequivocally been caused by GHG emissions from fossil fuels and other human activities.
- Human-caused climate change is already affecting weather extremes across the globe. Evidence has strengthened linking human influence to observed changes in extremes such as heatwaves, heavy rainfall, droughts, and tropical storms. Human influence has also likely increased the chance of these events occurring simultaneously. Vulnerable communities are disproportionately affected by these extreme events.
- Risks increase as warming increases. Changes in extreme climate events become larger with every additional increment of warming. Concurrent extreme weather and sea level events are projected to become more frequent, storms to become more intense, and arid conditions to become more widespread. Abrupt and irreversible changes, including those triggered when tipping points are reached, become more likely and more impactful with further warming. For any given level of warming, many climate-related risks are assessed to be higher than in the IPCC’s previous assessments.
- Limiting human-caused warming requires deep and immediate emissions cuts. Modelled IPCC pathways that limit warming to 1.5°C (with low or no overshoot) reach global Net Zero CO2 in the early 2050s. These pathways see global GHG emissions peak by 2025 and assume deep and immediate cuts in emissions are made across most sectors this decade.
- Net Zero refers to a state in which GHG emissions entering the atmosphere are balanced by removals out of the atmosphere. Reaching Net Zero CO2 emissions globally is necessary for limiting global warming to any level. In most modelled scenarios, Net Zero global GHG emissions is associated with net negative global CO2 emissions (needed to balance residual non-CO2 emissions) and falling temperatures.[32]
- Limiting warming requires both limiting cumulative CO2 emissions and strong reductions in other GHGs. The IPCC has high confidence that the level of emissions reduction by 2030 will be key to determining whether warming can be limited to 1.5°C or 2°C.
- Global warming will continue to increase in the near term, as cumulative CO2 emissions continue to rise in all the IPCC’s modelled scenarios. Even under the IPCC’s very low emissions scenario, global warming is more likely than not to reach 1.5°C before 2040.
- Rapid action on mitigation and adaptation can reduce projected losses and damage. Actions this decade are crucial to reducing emissions quickly and adapting to the changing climate, since there are often long implementation times. Delaying action could also have other detrimental consequences, including risking lock-in to high-emissions infrastructure, stranded assets, and rising costs for people and businesses.
- The IPCC reports a 10–23% climate change-caused decline in annual global GDP by 2100 under a high warming scenario, though statistical approaches point towards the upper end of this range.[33];[34] Recent actuarial assessments emphasise the risk that losses could be considerably higher than currently considered in decision-making.[35];[36]
- Integrated responses that address both mitigation and adaptation objectives can take advantage of synergies and reduce trade-offs.
1.2 The UK and international context
Scotland reports on its progress towards the formal global agreements on climate change as part of the UK. However, Scotland’s ambition in climate change is also set in a broader context of other state, private sector, and non-state action against climate change.[37]
1.2.1 Global agreements on climate change
The UNFCCC process
The UNFCCC is the UN process for negotiating a global approach to address climate change. 197 countries plus the European Union are currently party to this process. Negotiations take place through the annual Conference of the Parties (COP). COP21 in 2015 negotiated the Paris Agreement, which is the latest global agreement on climate change mitigation.
- The Paris Agreement: this set several goals and objectives extending across mitigation, adaptation, and finance, including:
- A long-term temperature goal of limiting global warming to ‘well below 2ºC above pre-industrial levels’ and to ‘pursue efforts to’ limit warming to 1.5ºC above pre-industrial levels.
- On mitigation, setting three high-level milestones for global GHG emissions: global peaking as soon as possible, rapid reductions thereafter, and achieving a balance between emissions sources and sinks in the second half of this century (Net Zero GHGs).
- The UK has substantially reduced its emissions and has set targets consistent with reaching Net Zero emissions by 2050. Other developed economies such as the European Union are also committing to comparable targets (see Section 10.1.1 of the UK-wide Seventh Carbon Budget advice report for more detail).
- Nationally Determined Contributions: under the Paris Agreement, countries are required to submit Nationally Determined Contributions (NDCs). NDCs should set out ambitious targets and plans to reduce emissions in line with the aims of the Agreement.
- The UK set its first NDC to require a reduction in GHG emissions (excluding emissions from international aviation and shipping) of at least 68% by 2030, compared to 1990 levels.
- In January 2025, the UK submitted its second NDC, requiring at least an 81% reduction in GHG emissions by 2035, compared to 1990 levels. Both NDCs have been set in line with the Committee’s advice.
- Scotland reports on its international commitments formally to the UN as part of the UK-wide NDC.
- The Global Stocktake: the Paris Agreement established a five-yearly Global Stocktake to assess progress towards achieving its objectives. The first Global Stocktake concluded at COP28 in 2023 and highlighted significant gaps between current action and that needed to achieve the Agreement’s goals, notably (in the context of this advice) on mitigation.
- Reacting to the latest scientific evidence and political momentum built at COP26 and since, the Global Stocktake placed particular emphasis on the importance of 1.5ºC, underscoring that climate impacts would be much less severe than at 2ºC, and noting the gap between existing commitments and a 1.5ºC-consistent trajectory.
- The Global Stocktake set out several global objectives, including:
- A tripling of global renewable energy capacity and a doubling of the global average annual rate of energy efficiency improvements by 2030.
- Accelerating the phase-down of unabated coal power and transitioning away from fossil fuels, with particular focus on accelerated action this decade.
- Accelerating reductions in non-CO2 GHG emissions, including in particular methane by 2030.
- Accelerating deployment of low- and zero-emission technologies including zero-emission vehicles, renewables, nuclear, removals, and carbon capture technologies.
- Phasing out inefficient fossil fuel subsidies.
Global ambition and delivery
National Net Zero targets and ambitions now cover approximately 76% of present global GHG emissions.[38];[39];[40] Many of these targets are assessed as lacking detail and credibility, with short-term ambitions out of step with long-term goals.[41]
These targets are increasingly accompanied by policy packages designed to incentivise take-up of low-carbon technologies and boost domestic energy security and low-carbon competitiveness, albeit still falling short of alignment with NDC targets. Major low-carbon transition programmes (often with a notable electrification focus) are underway in the world’s largest economies.
Progress is being driven by improving economics of low-carbon technologies interacting with policy support. The global average cost for new electricity generation has fallen by 88% for solar PV and 60% for wind since 2010, with the global average cost of battery storage falling by nearly 90% over the same period.[42] The world now invests almost twice as much in clean energy as it does in fossil fuels, with clean energy investment expected to reach $2 trillion in 2024.[43]
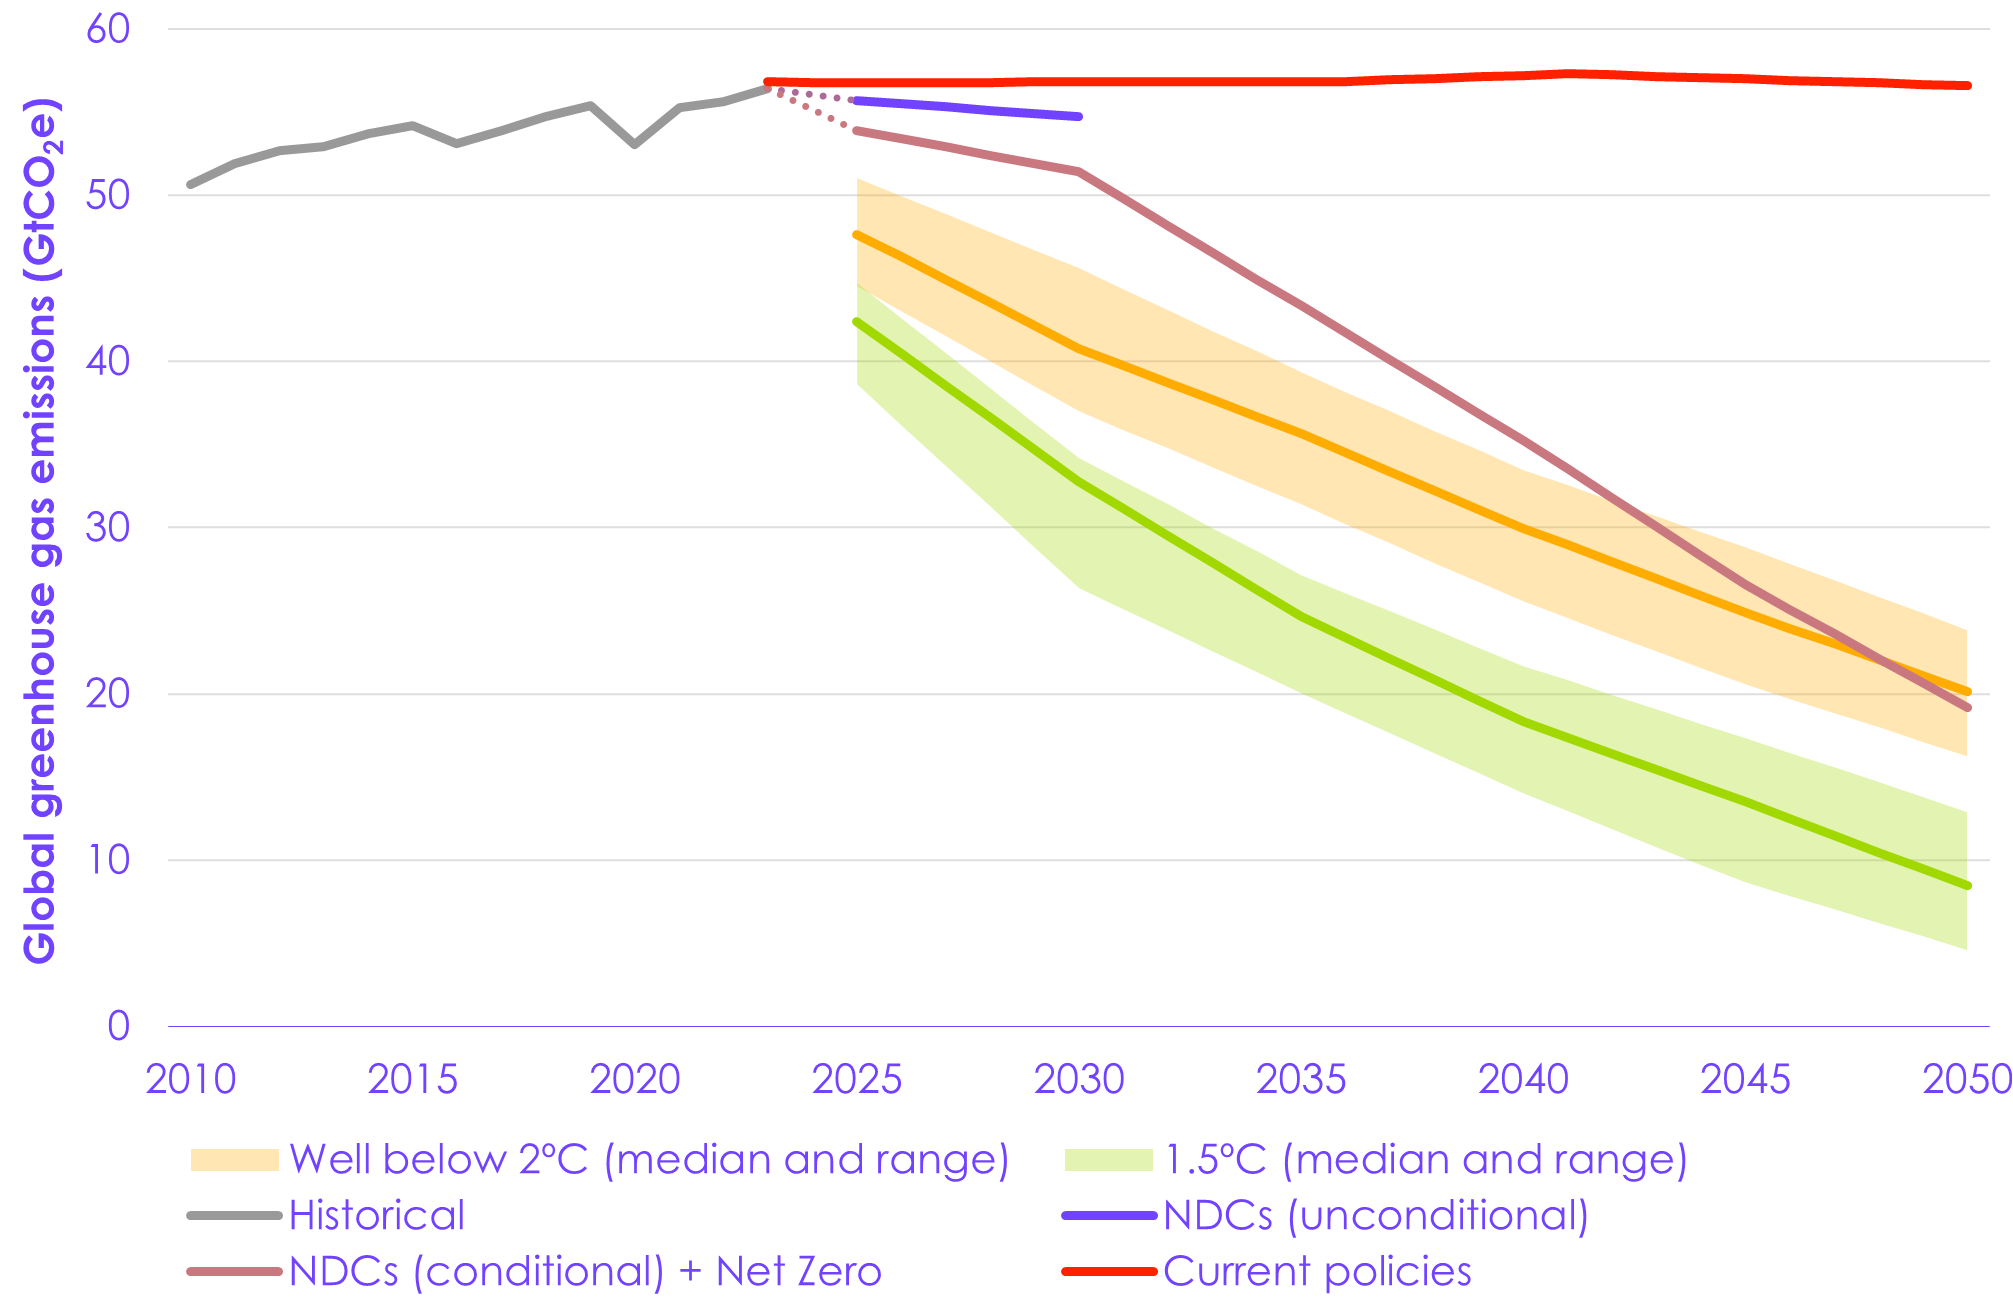
Globally, however, efforts remain significantly off track to achieve the Paris Agreement temperature goal (Figure 1.2).[44];[45]
- Global GHG emissions implied by NDCs are consistent with warming of around 2.5ºC by 2100 and would need to be 19–22 GtCO2e lower in 2030 than those implied by current NDCs to align with a 1.5ºC scenario. Current policies in turn fall short of what would be needed to deliver NDCs, implying warming of around 3ºC by 2100 and indicating an implementation gap on top of the ambition gap.[46];[47]
- Nonetheless, significant progress has been made in recent years. When major emitters’ Net Zero pledges are considered alongside NDCs, latest commitments imply warming below 2ºC if implemented in full (which countries are not currently on track to do), compared to the 3–4ºC projected before the Paris Agreement was adopted.[48]
|
Figure 1.2 Global GHG emissions under current ambition, compared to Paris-aligned trajectories |
|
|
1.2.2 The Climate Change Act and UK carbon budgets
The Climate Change Act (2008) is the UK’s legal framework for tackling and responding to climate change. The UK Climate Change Act sets in law a long-term goal of reaching Net Zero UK GHG emissions by 2050 as well as intermediate steps defined by the level of carbon budgets, which set legally binding caps on UK GHG emissions over five-year periods. These make clear the required level of emissions reduction in the short and medium term to ensure the UK is on track to decarbonise by 2050.
- Emissions in Scotland are covered by the UK Climate Change Act, and therefore contribute to the UK’s carbon budgets and long-term emissions reduction goal.
- The UK has approximately halved its emissions since 1990 and has met all of its three carbon budgets so far.
The next three steps on the way to Net Zero for the UK are the Fourth, Fifth and Sixth Carbon Budgets, covering the periods 2023 to 2027, 2028 to 2032, and 2033 to 2037. These have been legislated, while the UK-wide Seventh Carbon Budget, covering the period 2038 to 2042, is due to be legislated by 30 June 2026.
1.3 The Climate Change (Scotland) Act
Evidence of climate change is visible around the world, including in Scotland. Scotland’s annual average temperature over 2013 to 2022 was around 0.65°C warmer than it was around 30 years ago (an average of the 1981 to 2000 period).[49] In 2022, Scotland recorded its highest ever temperature of nearly 35°C in the Scottish Borders, impacting health, ecosystems, and infrastructure.[50] In 2023, prolonged rainfall followed by Storm Babet led to widespread flooding and several deaths, as well as substantial disruption to transport and power systems. Some areas in Angus and Aberdeenshire saw over 150 mm of rainfall in 36 hours.[51] Research has found that this rainfall was made about 20% heavier by human-caused climate change.[52]
The Climate Change (Scotland) Act 2009 sets the framework for the Scottish Government to address climate change. Emissions in Scotland are covered by both Scotland’s targets, set under the Act, and UK-wide targets, set under the UK Climate Change Act (2008) and as part of the UNFCCC process (see Section 1.2.2).
- The Act was amended in 2019 to include an ambitious target to reach Net Zero greenhouse gas emissions by 2045 and interim decadal emissions targets for 2020, 2030, and 2040.[53]
- In our 2023 Progress in reducing emissions in Scotland report, we advised that the acceleration required in emissions reduction to meet the 2030 target was beyond what is credible. The Act was amended in 2024 to repeal the interim targets and introduce five-yearly carbon budgets aligned with the 2045 Net Zero target.[54]
- Emissions from international aviation and shipping are included in these targets.
This report provides our advice on four carbon budgets for Scotland, covering the period from 2026 to 2045. As set out in the Act, the Scottish Government needs to lay draft regulations to set the carbon budgets within three months of receiving this advice. The Scottish Government must also lay before the Scottish Parliament a draft Climate Change Plan (CCP) containing its proposals and policies to meet legislated emissions reduction targets for the relevant period of the CCP within two months of the regulations setting the carbon budgets coming into force.
We have previously set out recommendations to the Scottish Government on key considerations for the upcoming CCP (see Box 1.2).
| Box 1.2 Recommendations for the upcoming Climate Change Plan |
|
In the Committee’s 2023 Progress in reducing emissions in Scotland report, we included priority recommendations setting out key considerations for the Climate Change Plan (CCP):
In a letter to Màiri McAllan MSP, Cabinet Secretary for Net Zero and Just Transition dated 14 May 2024 on the design and implementation of carbon budgets in Scotland, the Committee advised that the Scottish Government should develop a monitoring and evaluation plan that can be used to identify where there are risks of delivery falling behind the pace of change that is required.
|
The target-setting criteria
The Act requires the Committee to provide advice on Scotland’s carbon budgets taking into account the target-setting criteria. Table 1.1 sets out how we have considered the target-setting criteria in this advice.
| Table 1.1 Alignment with the target-setting criteria |
|
| Criterion |
How the Committee has considered the criterion |
| The fair and safe Scottish emissions budget | Scotland’s 2045 Net Zero target represents Scotland’s fair contribution to the UK-wide target and hence to the Paris Agreement (see Section 2.2.1). We recommend carbon budgets that are deliverable and consistent with the Net Zero targets for Scotland and the UK (see Section 2.2.2). We then determine the fair and safe Scottish emissions budget that is compatible with the Net Zero target and the recommended carbon budgets (see Section 2.2.3). |
| European and international law and policy relating to climate change | See Section 1.2.1 for how this advice considers global agreements on climate change. |
| Scientific knowledge about climate change | See Section 1.1 for how this advice considers the latest scientific knowledge about climate change. |
| Technology relevant to climate change | See Section 3.2 for how this advice considers key low-carbon technologies in the pathway to Net Zero emissions. |
| Economic circumstances | See Section 4.2 for how this advice considers economic circumstances in Scotland, including the likely impact of the carbon budgets on the Scottish economy, the competitiveness of particular sectors of the Scottish economy, small- and medium-sized enterprises, and jobs and employment opportunities. |
| Fiscal circumstances | See Section 4.3 for how this advice considers fiscal circumstances in Scotland, including the likely impact of the carbon budgets on taxation, public spending, and public borrowing. |
| Social circumstances | See Section 4.3 for how this advice considers social circumstances in Scotland, including the likely impact of the carbon budgets on those living in poorer or deprived communities. |
|
Impact on public health |
See Section 4.3 for how this advice considers the impact of the carbon budgets on public health in Scotland. |
|
Impact on remote rural communities and island communities |
See Section 4.3 for how this advice considers the impact of the carbon budgets on those living in remote rural communities and island communities in Scotland. |
|
Energy policy |
See Section 3.2.10 for how this advice considers the impact of the carbon budgets on energy supplies, the renewable energy sector, and the carbon and energy intensity of the Scottish economy. |
|
Environmental considerations |
See Section 3.2.2 for how this advice considers the likely impact of the carbon budgets on the environment, including on biodiversity in Scotland. |
|
Impact on sustainable development |
The carbon budgets will contribute to sustainable development in Scotland, particularly Sustainable Development Goal (SDG) 13 (Climate Action). The carbon budgets will also contribute to SDGs:
|
|
Current international carbon reporting practice |
This advice is consistent with current international carbon reporting practice under the protocols to the UNFCCC. See Section 1.2.1 for how this advice considers global agreements on climate change. |
1.4 Current emissions in Scotland
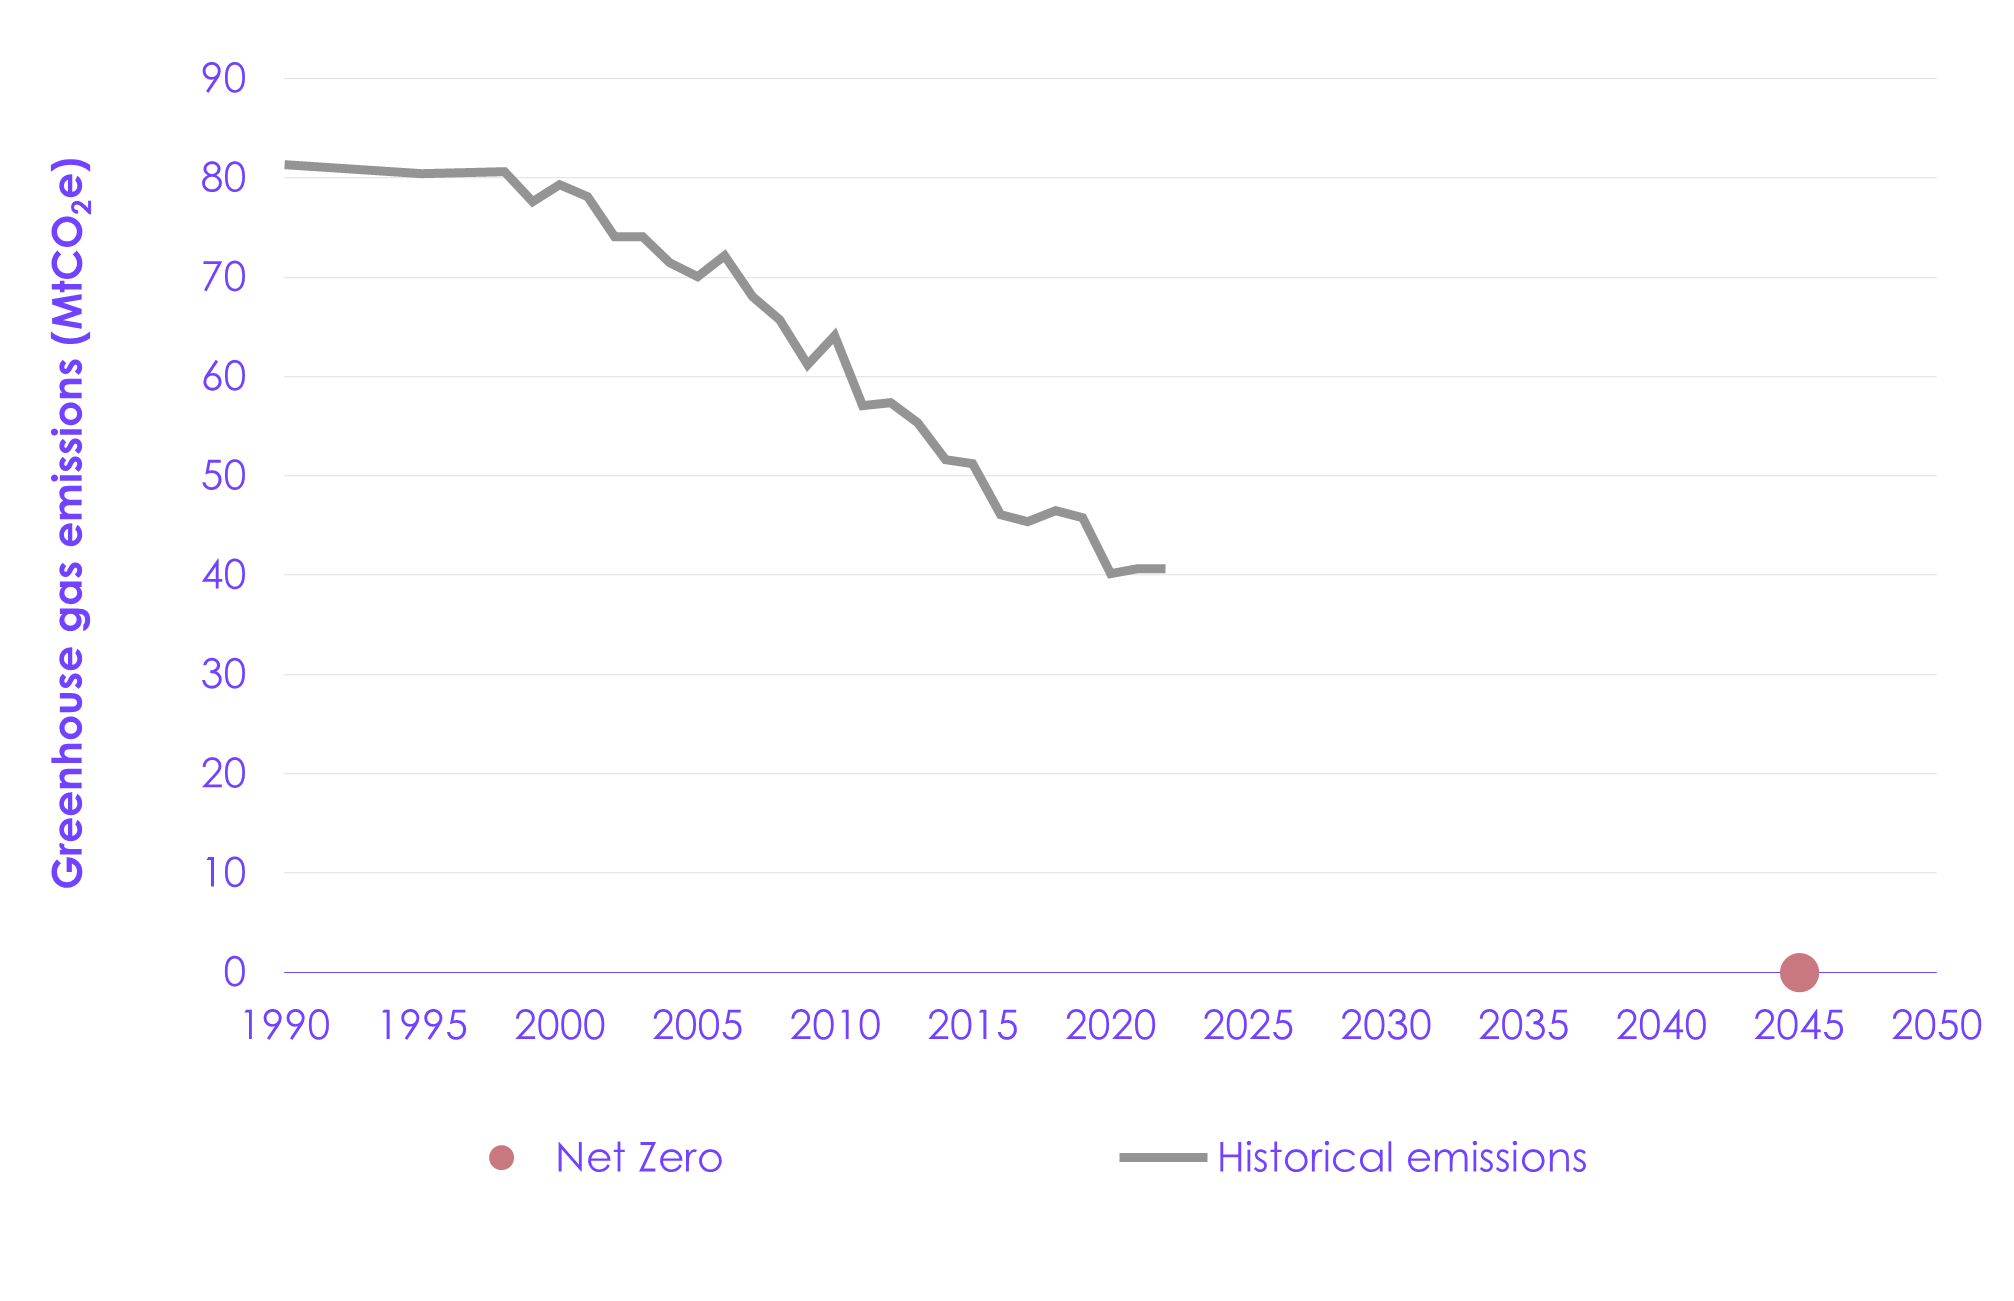
Emissions in Scotland, including Scotland’s share of international aviation and shipping, were 40.6 MtCO2e in 2022, the most recent year for which data are available (Figure 1.3).
- Emissions have fallen by 50% since 1990. Emissions were relatively constant between 1990 and 2000 but have since fallen by around 1.8 MtCO2e per year between 2000 and 2022 on average.
- So far, emissions reductions have been driven by the electricity supply and industry sectors due to the phase-out of coal, the ramp-up of renewable electricity generation, and a structural shift towards less carbon-intensive, higher value industrial output. There have also been significant reductions in the land use sector.
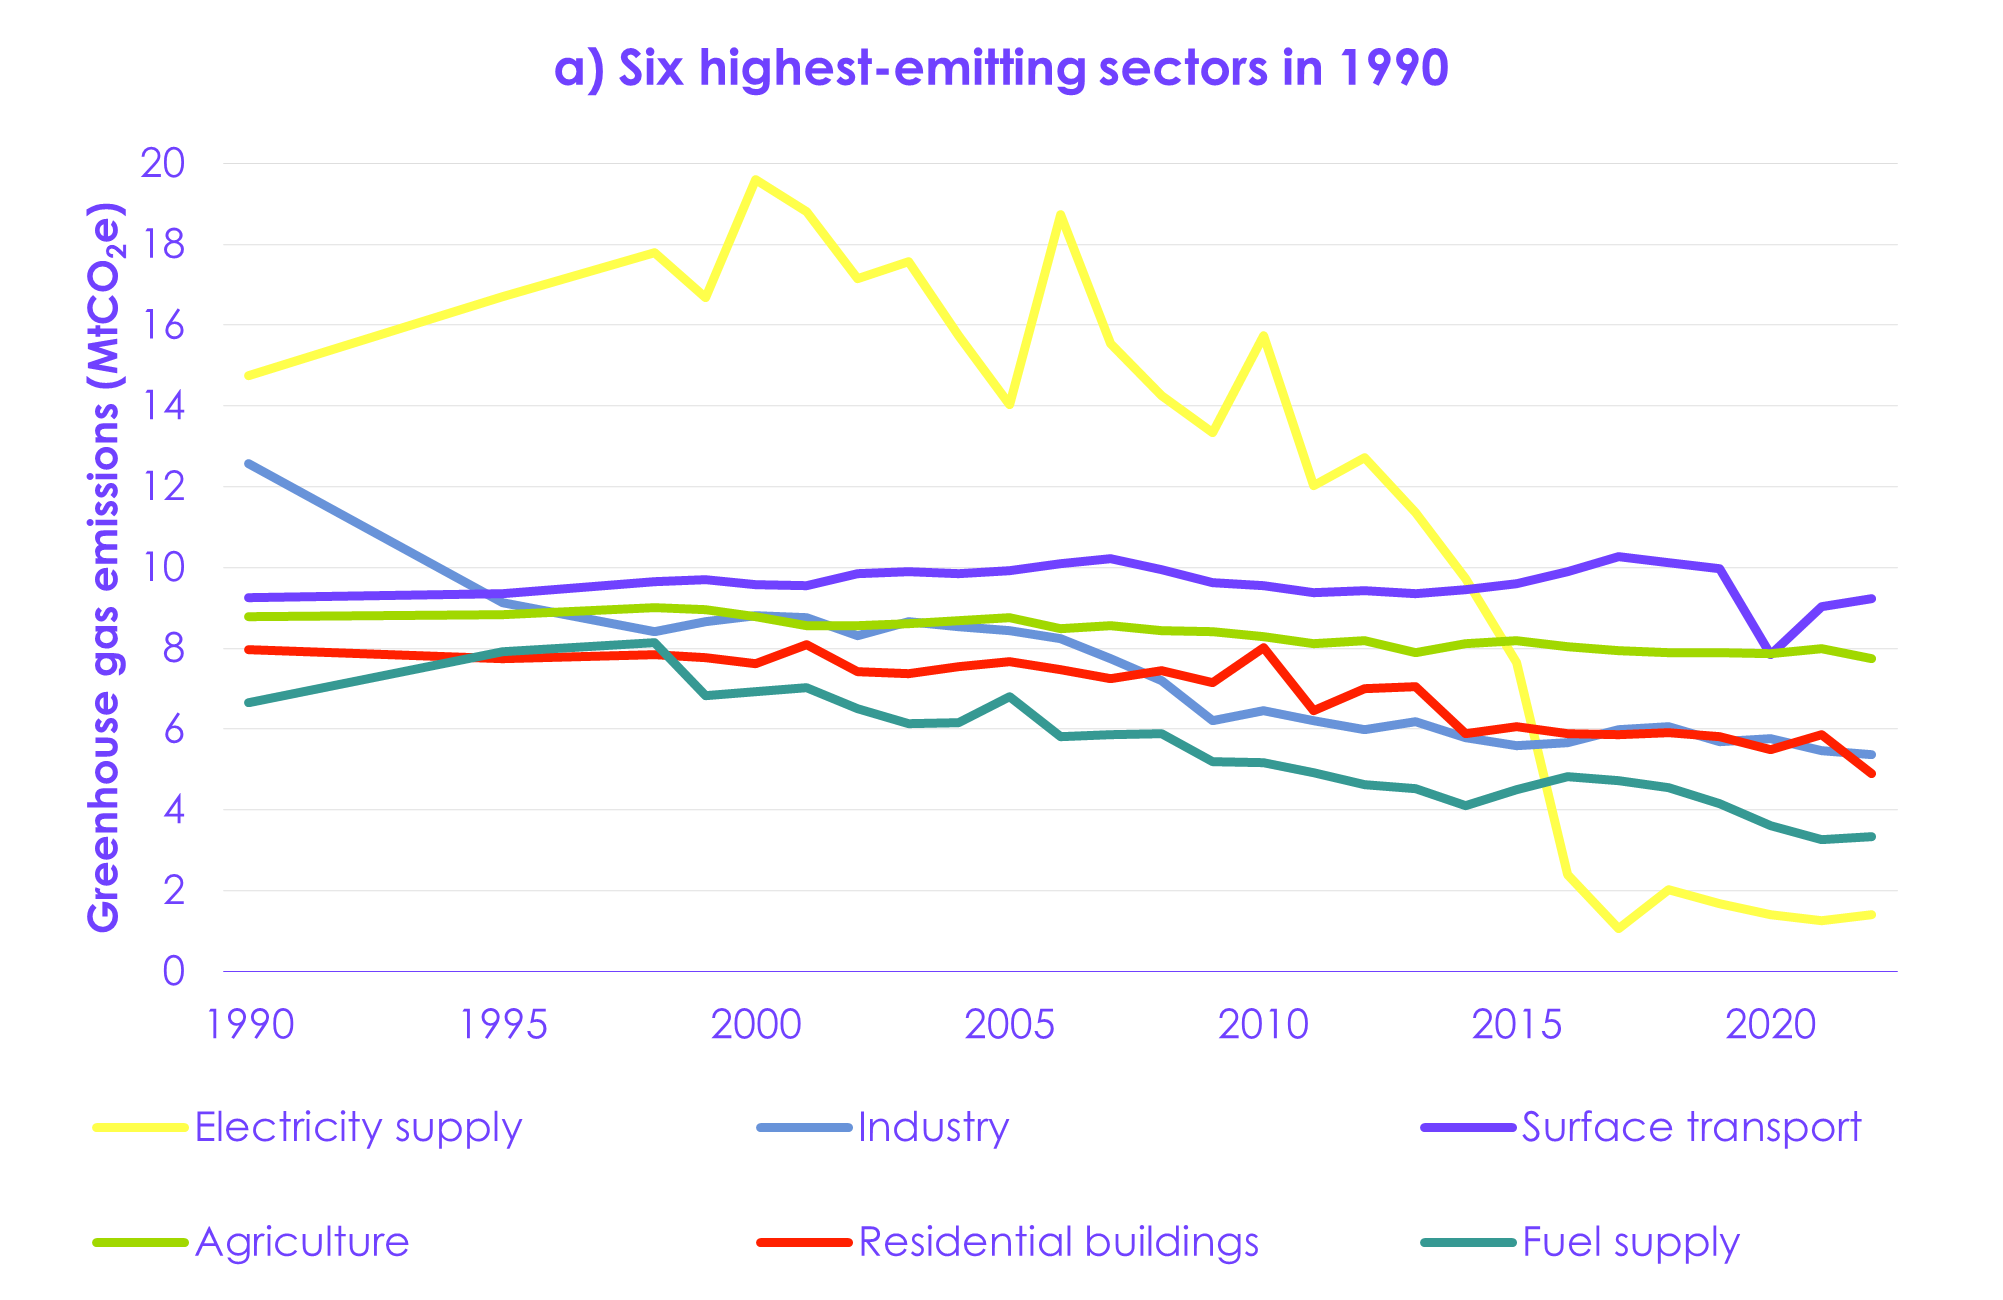
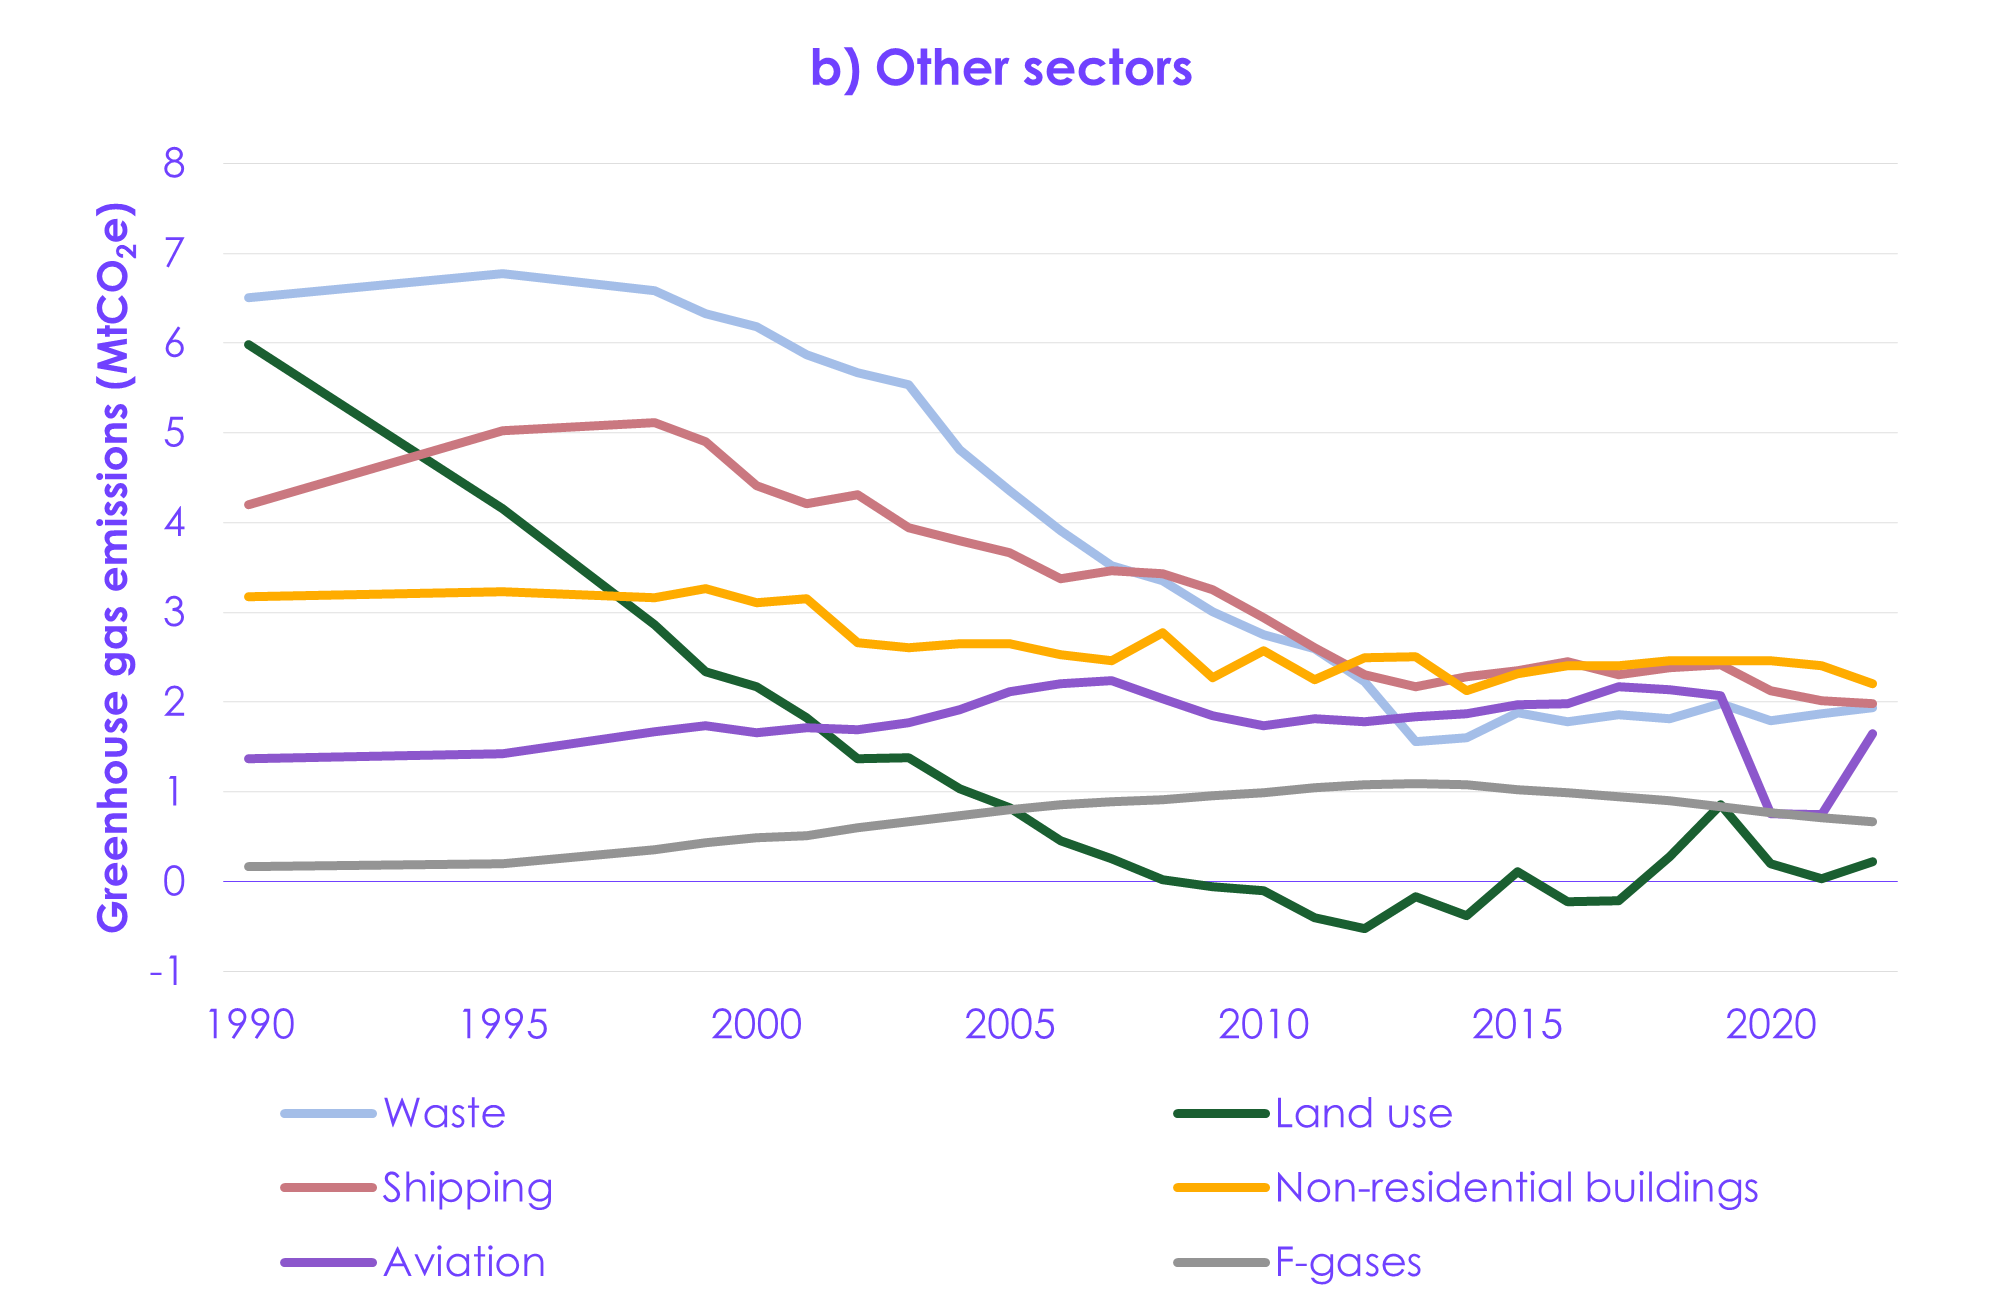
- The highest-emitting sectors in 2022 were surface transport, agriculture, industry, and residential buildings, with significant contributions from other sectors (Figure 1.4).[55]
|
Figure 1.3 Scotland’s historical emissions and current targets |
|
|
|
Figure 1.4 Scotland’s historical emissions by sector |
|
|
Chapter 2: Scotland’s path to Net Zero
Introduction and key messages
This chapter sets out our recommended level for Scotland’s carbon budgets. Our recommendation is based on our Balanced Pathway for Scotland from 2025 to Net Zero by 2045.
Our key messages are:
- Scotland’s target to achieve Net Zero by 2045 represents a fair contribution towards UK and global efforts under the Paris Agreement to limit global average temperatures. It is appropriate that Scotland’s target is earlier than the UK-wide target, because Scotland has proportionally more land suitable for tree planting and higher potential for engineered removals.
- The Committee recommends that Scotland’s carbon budgets, including Scotland’s share of international aviation and shipping emissions, are set at annual average levels of emissions that are:
- 57% lower than 1990 levels for the First Carbon Budget (2026 to 2030).
- 69% lower than 1990 levels for the Second Carbon Budget (2031 to 2035).
- 80% lower than 1990 levels for the Third Carbon Budget (2036 to 2040).
- 94% lower than 1990 levels for the Fourth Carbon Budget (2041 to 2045).[56]
- The Scottish Government should plan to deliver the emissions reductions required to meet the carbon budgets through domestic decarbonisation action within Scotland and should not plan to use international credits (referred to as ‘carbon units’ in the Act) to achieve the carbon budgets.
- The definition of removals in the Act currently only refers to land-based removals. However, engineered removals are needed to achieve Scotland’s 2045 Net Zero target. The Scottish Government should amend the Act (which can be done by order) to extend the definition of removals to include engineered removals when legislating the carbon budget targets.
- Scotland will need to resume the pace of emissions reduction that was seen between 2009 and 2016 in order to meet the recommended carbon budgets, with contributions broadening to more sectors across the economy. Achieving this will depend largely on ramping up deployment of solutions that are available today. Electrification of key technologies is the key driver of the emissions reduction required to achieve the carbon budgets.
- The Scottish Government has devolved powers to deliver the necessary emissions reductions in key sectors, particularly buildings, surface transport, agriculture, and land use.
- The overall cost of meeting the Balanced Pathway for Scotland is estimated to be around £750 million per year on average between 2025 and 2050, relative to a baseline of no further decarbonisation action. This is around 0.4% of Scotland’s GDP.
2.1 The Balanced Pathway for Scotland
2.1.1 Developing our Balanced Pathway
Our advice on Scotland’s carbon budgets is based on our Balanced Pathway, which represents the Committee’s assessment of an ambitious but deliverable pathway for Scotland to reach Net Zero by 2045. The pathway is not prescriptive but illustrates a feasible and cost-effective route to achieve Scotland’s Net Zero target.
- Our pathway includes all greenhouse gases (GHGs) and covers the period 2025 to 2050. It includes Scotland’s share of international aviation and shipping emissions.
- The pathway is aligned with Scotland’s contribution to the UK’s Balanced Pathway, which we presented in our 2025 UK-wide Seventh Carbon Budget advice. The UK’s Balanced Pathway represents our assessment of a pathway to Net Zero UK GHG emissions that is based on actions that are feasible and cost effective across the UK and takes into account the different resources, opportunities, and costs seen in different parts of the UK.
- Scotland reaches Net Zero by 2045 in our pathway but the transition to low-carbon technologies continues beyond 2045. For example, technologies such as electric vehicles (EVs) and heat pumps continue to replace high-carbon alternatives out to 2050, in line with UK-wide deployment rates.
- Scotland’s greater potential for land-based and engineered removals allows negative emissions to grow proportionately faster than in the rest of the UK, offsetting remaining emissions by 2045.
- The Scottish Government could choose to reduce the remaining emissions in some sectors more quickly than in our pathway (see Section 3.3).
- The Balanced Pathway is presented compared to a baseline pathway of no further decarbonisation action.[57] This allows us to calculate the required abatement, investment needs, costs, and cost savings associated with the future actions to reduce Scotland’s GHG emissions. See Chapter 2 of our UK-wide Seventh Carbon Budget advice for further details on our baseline and the general approach we take to developing emissions pathways.
- Emissions in the baseline increase between 2022 and 2040 due to growth in population, which peaks in Scotland in 2033, and GDP.[58] After 2040, emissions fall slightly due to increasing sequestration from tree planting, which is assumed in the baseline to continue at current rates, and a reduction in emissions in fuel supply, largely due to the decline of North Sea oil and gas reserves.
2.1.2 Emissions in the Balanced Pathway
Emissions in Scotland have fallen by 50% between 1990 and 2022.
- In the Balanced Pathway, emissions need to fall by around 2.1 MtCO2e per year on average between 2025 and 2045 (Figure 2.1). This is similar to the pace previously seen between 2009 and 2016, but emissions reductions now need to broaden to more sectors across the economy, particularly buildings, surface transport, agriculture, and land use (see Section 3.2). The Scottish Government has substantial devolved powers to deliver the necessary emissions reductions in these key sectors.
- Much of this reduction will come from technologies and choices that are available today and can be deployed quickly (see Section 2.3.2). This emphasises the importance of putting the conditions in place to enable low-carbon markets and choices to scale up quickly.
|
Figure 2.1 The Balanced Pathway to Net Zero and the carbon budgets in Scotland |
|
|
2.2 Scotland’s emissions targets
2.2.1 Performance against previous and existing future emissions targets
Scotland’s Net Zero target
The Balanced Pathway meets Scotland’s Net Zero target, reaching Net Zero GHG emissions in 2045.
- The UK’s 2050 Net Zero target was set to deliver the UK’s commitments under the Paris Agreement, in line with the Committee’s 2019 Net Zero advice. It represents a fair contribution towards limiting the rise in global average temperature to ‘well below 2°C above pre-industrial levels’ and to ‘pursue efforts to’ limit warming to 1.5ºC above pre-industrial levels.
- Scotland’s Net Zero target represents a feasible and fair contribution for Scotland to the UK-wide target and hence to the Paris Agreement. Scotland’s target is earlier because there is proportionally more land suitable for tree planting and higher potential for engineered removals in Scotland than the rest of the UK.
- This means that 38% of the new woodland created in our UK-wide pathway between 2025 and 2050 is in Scotland.
- As a result, Scotland’s land use sink scales up more quickly than in the rest of the UK, offsetting residual emissions from the agriculture sector five years sooner than in our UK-wide analysis (see Section 2.4).
- Scotland has natural advantages which favour development of engineered removals via direct air carbon capture and storage (DACCS), notably abundant renewable generation, particularly from wind, and proximity to large geological storage locations.
- A credible share of UK-wide engineered removals is then sufficient to balance residual emissions from sectors other than agriculture, demonstrating that the 2045 Net Zero target for Scotland is appropriate and achievable (see Section 2.4). There may be scope for a slightly lower dependence on engineered removals if Scotland were to eliminate emissions in other sectors, such as surface transport and buildings, more quickly than in our UK-wide analysis (see Section 3.3).
Previous interim targets
Amendments to the Act in 2019 introduced interim emissions targets to reduce emissions by 75% on 1990 levels by 2030 and by 90% on 1990 levels by 2040. These interim targets were repealed through amendments to the Act in 2024, which replaced them with a carbon budgets framework aligned with the 2045 Net Zero target.
When setting carbon budget regulations, the Act requires Scottish Ministers to state in which carbon budget period they expect these 75% and 90% emissions reduction milestones to be achieved.
In the Balanced Pathway, these percentage reductions are reached in 2036 (during the Third Carbon Budget period) and 2042 (during the Fourth Carbon Budget period), respectively.
2.2.2 Recommended levels of Scotland’s carbon budgets
Table 2.1 sets out the recommended levels of Scotland’s carbon budgets, including Scotland’s share of international aviation and shipping emissions. Scotland’s carbon budgets are expressed as annual average levels of emissions below the 1990 baseline.[59]
| Table 2.1 Recommended levels of Scotland’s carbon budgets |
|
| Carbon budget period | Annual average level of GHG emissions for the relevant period below 1990 levels |
| First Carbon Budget (2026–2030) | 57% |
| Second Carbon Budget (2031–2035) | 69% |
| Third Carbon Budget (2036–2040) | 80% |
| Fourth Carbon Budget (2041–2045) | 94% |
| Notes: The recommended budget levels are in line with the average reduction in emissions in the Balanced Pathway over each five-year carbon budget period compared to 1990 levels, rounded down to the nearest percentage point. | |
These recommended carbon budgets would require around half of the emissions reductions compared to 2022 levels to happen between now and 2035, with the remaining half in the decade from then to 2045 (Figure 2.2).
The Scottish Government should plan to deliver the emissions reductions required to meet the carbon budgets through domestic decarbonisation action within Scotland and should not plan to use international credits (referred to as ‘carbon units’ in the Act) to achieve the carbon budgets.
Under the Act, the Committee is required to provide advice on whether an aviation multiplier to reflect the direct and indirect non-CO2 climate change impacts of emissions at altitude from international aviation is appropriate. We continue to recommend that Scottish targets do not take non-CO2 effects into account (i.e. the multiplier should be set at one) (see Box 3.2).
- The exact quantitative role that non-CO2 effects play in global warming is still too uncertain to explicitly include in Scottish targets. It would also be inconsistent with the approach taken across the rest of the UK.
- In line with our UK-wide Seventh Carbon Budget advice to the UK Government, the Scottish Government should work with the UK Government to ensure that the cost of aviation mitigating its emissions is reflected in the cost to fly, start monitoring non-CO2 effects of aviation, and set a minimum goal of no further warming after 2050 from non-CO2 effects.
- In our modelling, the UK Government’s high carbon value is included in the cost of flying used to forecast future demand. We use the high, rather than central, value to account for non-CO2 effects.
|
Figure 2.2 The recommended carbon budgets for Scotland |
 Description: The Balanced Pathway sets the recommended level of Scotland’s carbon budgets. Source: National Atmospheric Emissions Inventory (2024) Greenhouse Gas Inventories for England, Scotland, Wales & Northern Ireland: 1990-2022; CCC analysis. Notes: (1) Our pathway and baseline are modelled using historical data up to 2022. Emissions reductions prior to 2025 are based largely on existing trends; additional decarbonisation measures only begin to be applied in our modelling after 2025. (2) ‘CB’ refers to Scottish carbon budgets: ‘CB1’ refers to the First Carbon Budget; subsequent numbers refer to subsequent carbon budgets. (3) Our pathway for shipping begins above the latest historical data mainly because, from 2025, we have based our estimate of shipping emissions on the UK Department for Transport’s emissions model, which uses more recent activity data for domestic shipping and as a result gives a higher estimate of current shipping emissions than the GHG inventory. (4) There was a significant drop in emissions from residential buildings between 2021 and 2022 due to warmer-than-average winters and record high energy prices. Our pathway assumes that some of this reduction was a direct response to the weather and prices and will therefore only be short-term. Therefore, emissions in our pathway increase between 2022 and 2025. (5) Emissions from aviation increase between 2022 to 2025 due to a rebound in demand following the COVID-19 pandemic. |
2.2.3 Recommended level of the fair and safe emissions budget
The Act defines the fair and safe Scottish emissions budget as the aggregate amount of net Scottish emissions of GHGs for the period 2010 to 2050 as recommended as being consistent with Scotland, in line with the principles set out in Article 3 of the United Nations Framework Convention on Climate Change (UNFCCC), contributing appropriately to the holding of the increase in global average temperature to well below 2°C above pre-industrial levels, and pursuing efforts to limit the temperature increase to 1.5°C above pre-industrial levels.
Scotland’s 2045 Net Zero target represents Scotland’s fair contribution to the UK-wide target and hence to the Paris Agreement (see Section 2.2.1). We recommend carbon budgets that are deliverable and consistent with the Net Zero target (see Section 2.2.2). We then determine the fair and safe Scottish emissions budget that is compatible with the Net Zero target and the recommended carbon budgets.
- The Committee recommends that the fair and safe budget for the period 2010 to 2050 should be set at 1,129 MtCO2e.
- This assumes that emissions between 2045 and 2050 are negative, which is feasible as Scotland has proportionally more land suitable for tree planting and higher potential for engineered removals than the rest of the UK. Net negative emissions in Scotland between 2045 and 2050 are part of Scotland’s fair contribution to our UK-wide Balanced Pathway, in order to achieve Net Zero by 2050 across the UK.
2.2.4 Contribution to meeting the UK’s emissions targets
The pace of emissions reductions in Scotland is lower than the pace required across the UK over the first three Scottish carbon budget periods, but faster over Scotland’s Fourth Carbon Budget period (Table 2.2).
- The exact pace of decarbonisation in each sector compared to the UK will vary, as we have considered Scotland’s specific circumstances in our pathway (see Section 3.1.3).
- The overall trend reflects the trend in the land use sector, where emissions reductions are proportionally slower over the first three Scottish carbon budget periods in Scotland than across the UK. However, over Scotland’s Fourth Carbon Budget period, land-based removals ramp up proportionally more quickly in Scotland than across the UK. This is because Scotland has proportionally more tree planting than the rest of the UK, which in the short term increases soil emissions as new woodlands are planted. This is then offset by sequestration as the trees grow.
- Engineered removals via DACCS ramp up more quickly in Scotland than in the rest of the UK, reflecting natural advantages such as abundant renewable generation, particularly from wind. We largely assume that engineered removals are funded in line with a ‘polluter pays’ principle, in which case these costs would fall UK-wide rather than necessarily to people in Scotland.
| Table 2.2 Emissions reductions in Scotland’s recommended carbon budgets compared to the UK Balanced Pathway |
||
| Scottish carbon budget period | Annual average level of emissions below 2022 levels for the period for Scotland | Annual average level of emissions below 2022 levels for the period for the UK |
| First Carbon Budget (2026–2030) |
14% | 21% |
| Second Carbon Budget (2031–2035) |
39% | 48% |
| Third Carbon Budget (2036–2040) |
61% | 69% |
| Fourth Carbon Budget (2041–2045) |
88% | 85% |
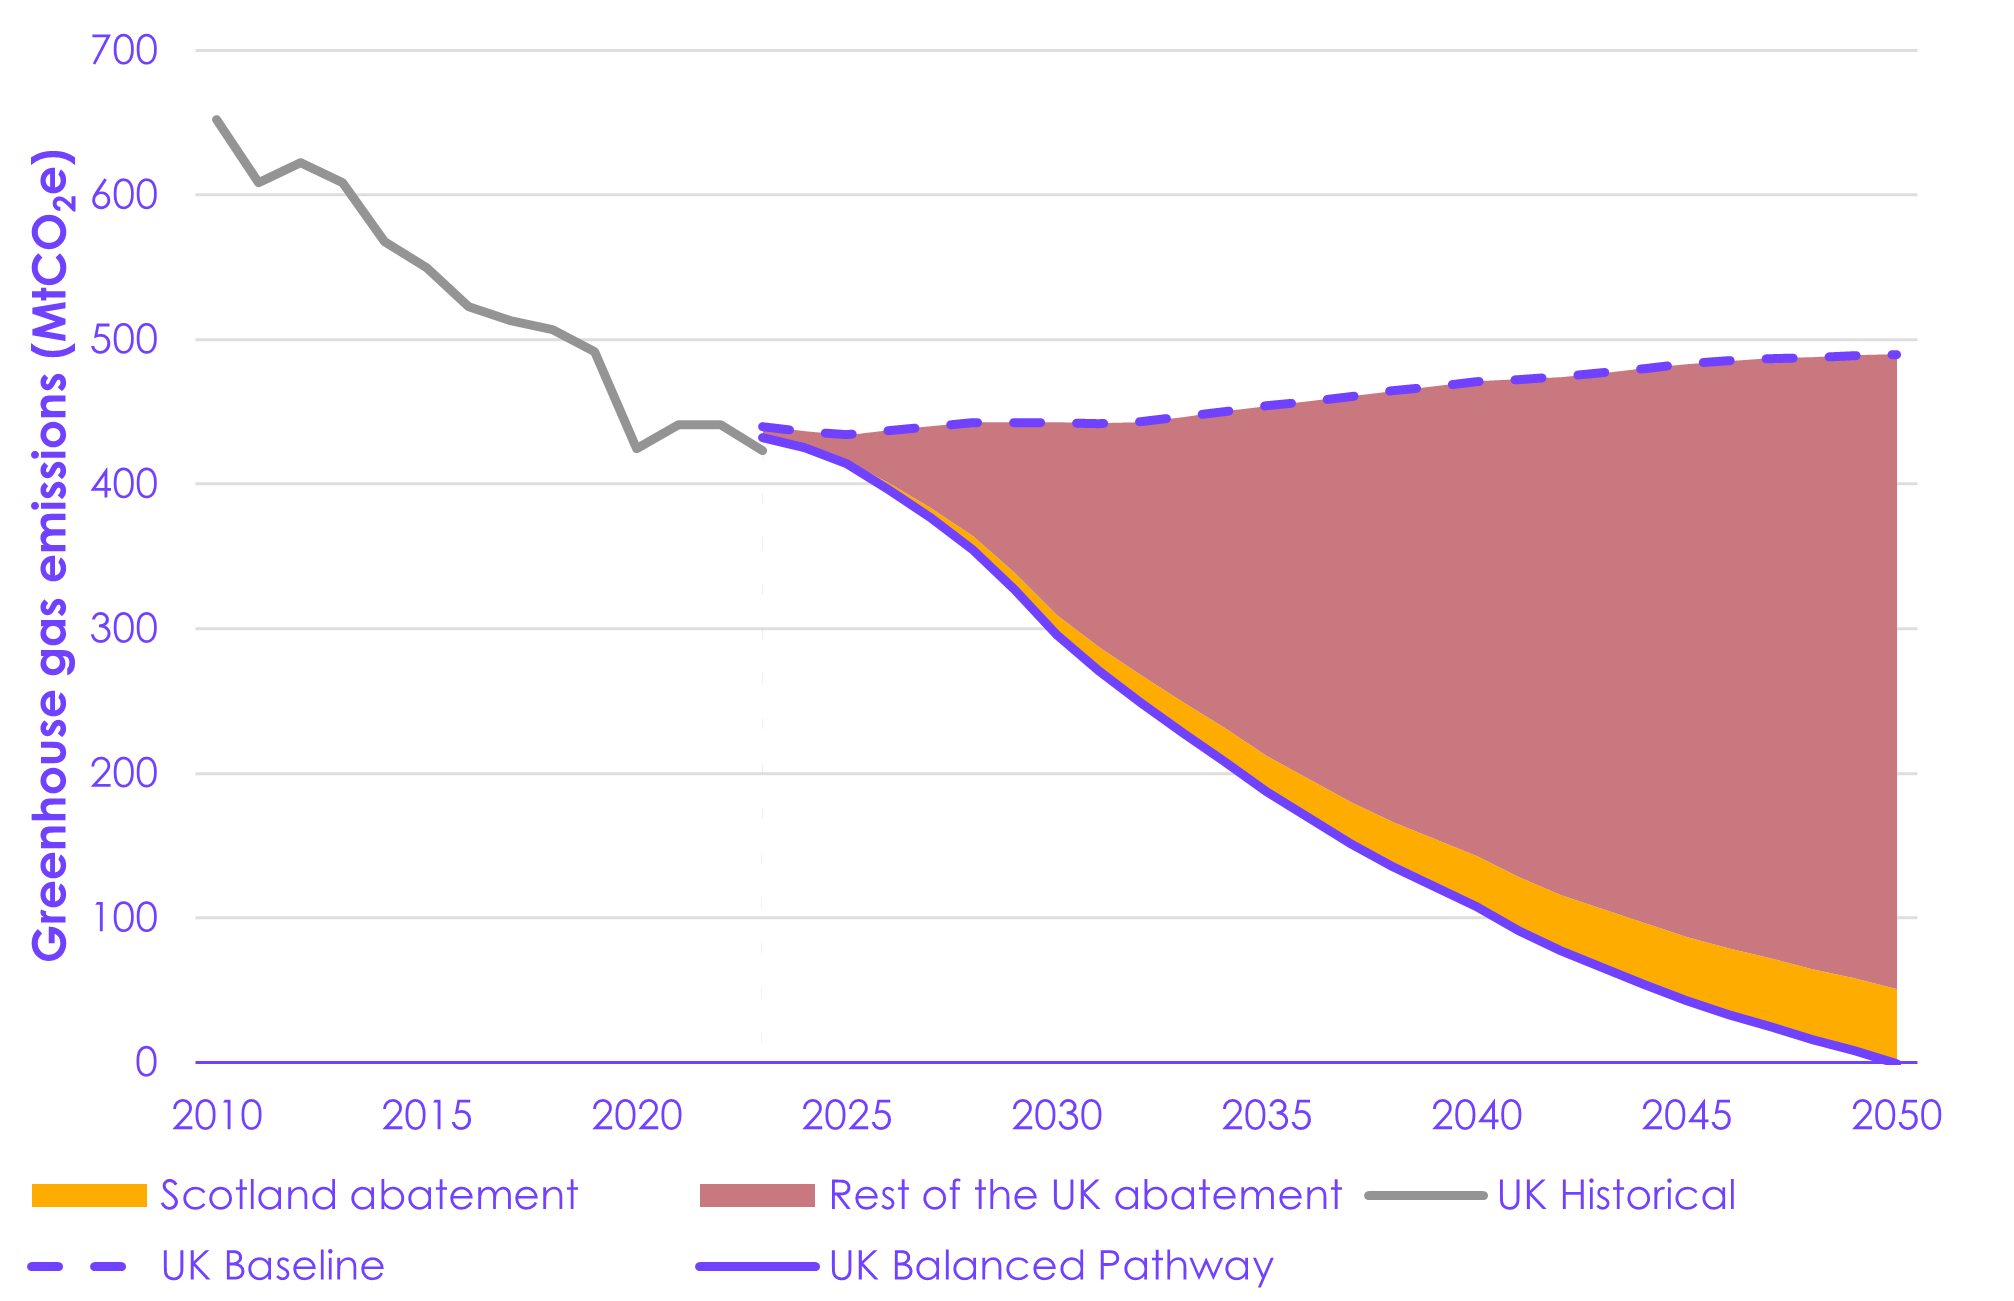
Emissions reductions in Scotland deliver around 10% of the overall abatement required between 2025 and 2050 to meet the recommended UK-wide Seventh Carbon Budget and Net Zero target, similar to Scotland’s share of total current UK emissions of around 9% (Figure 2.3).
|
Figure 2.3 Scotland’s contribution to the UK-wide Balanced Pathway |
|
|
2.2.5 Contribution towards the Paris Agreement temperature goal
The Act requires the Committee to advise on the estimated contribution of the carbon budgets towards global efforts to limit the global average temperature increase to 1.5°C above pre-industrial levels.
- The recommended carbon budgets are aligned to Scotland’s 2045 Net Zero target and the UK Balanced Pathway to achieve Net Zero by 2050 across the UK. In our UK-wide Seventh Carbon Budget advice, we set out how the UK Balanced Pathway relates to the Paris Agreement principles (see Section 10.1 of that report).
- We assess our recommended carbon budgets to represent a fair and ambitious contribution to global efforts to tackle climate change. They would be a credible contribution towards the ambition to limit long-term global warming to the 1.5ºC benchmark referenced in the Paris Agreement.
- They imply emissions reductions at least as fast as the global average under 1.5ºC scenarios on most baselines, on the basis of globally cost-effective 1.5ºC scenarios with ‘no or low overshoot’, with action beginning in 2020, as synthesised in the Intergovernmental Panel on Climate Change’s (IPCC) Sixth Assessment Report (AR6).[60]
- The residual GHG emissions that remain in our pathway in 2045 are a mix of long-lived CO2 and nitrous oxide, and short-lived methane. These are all balanced by land-based and engineered removals of CO2. Overall, this leads to a peak and then decline in Scotland’s contribution to global warming by 2045, as continuing shorter-lived methane emissions are offset by removals of long-lived CO2 (see Section 2.4).
2.3 Drivers of emissions reductions in the Balanced Pathway
2.3.1 Emissions by greenhouse gas
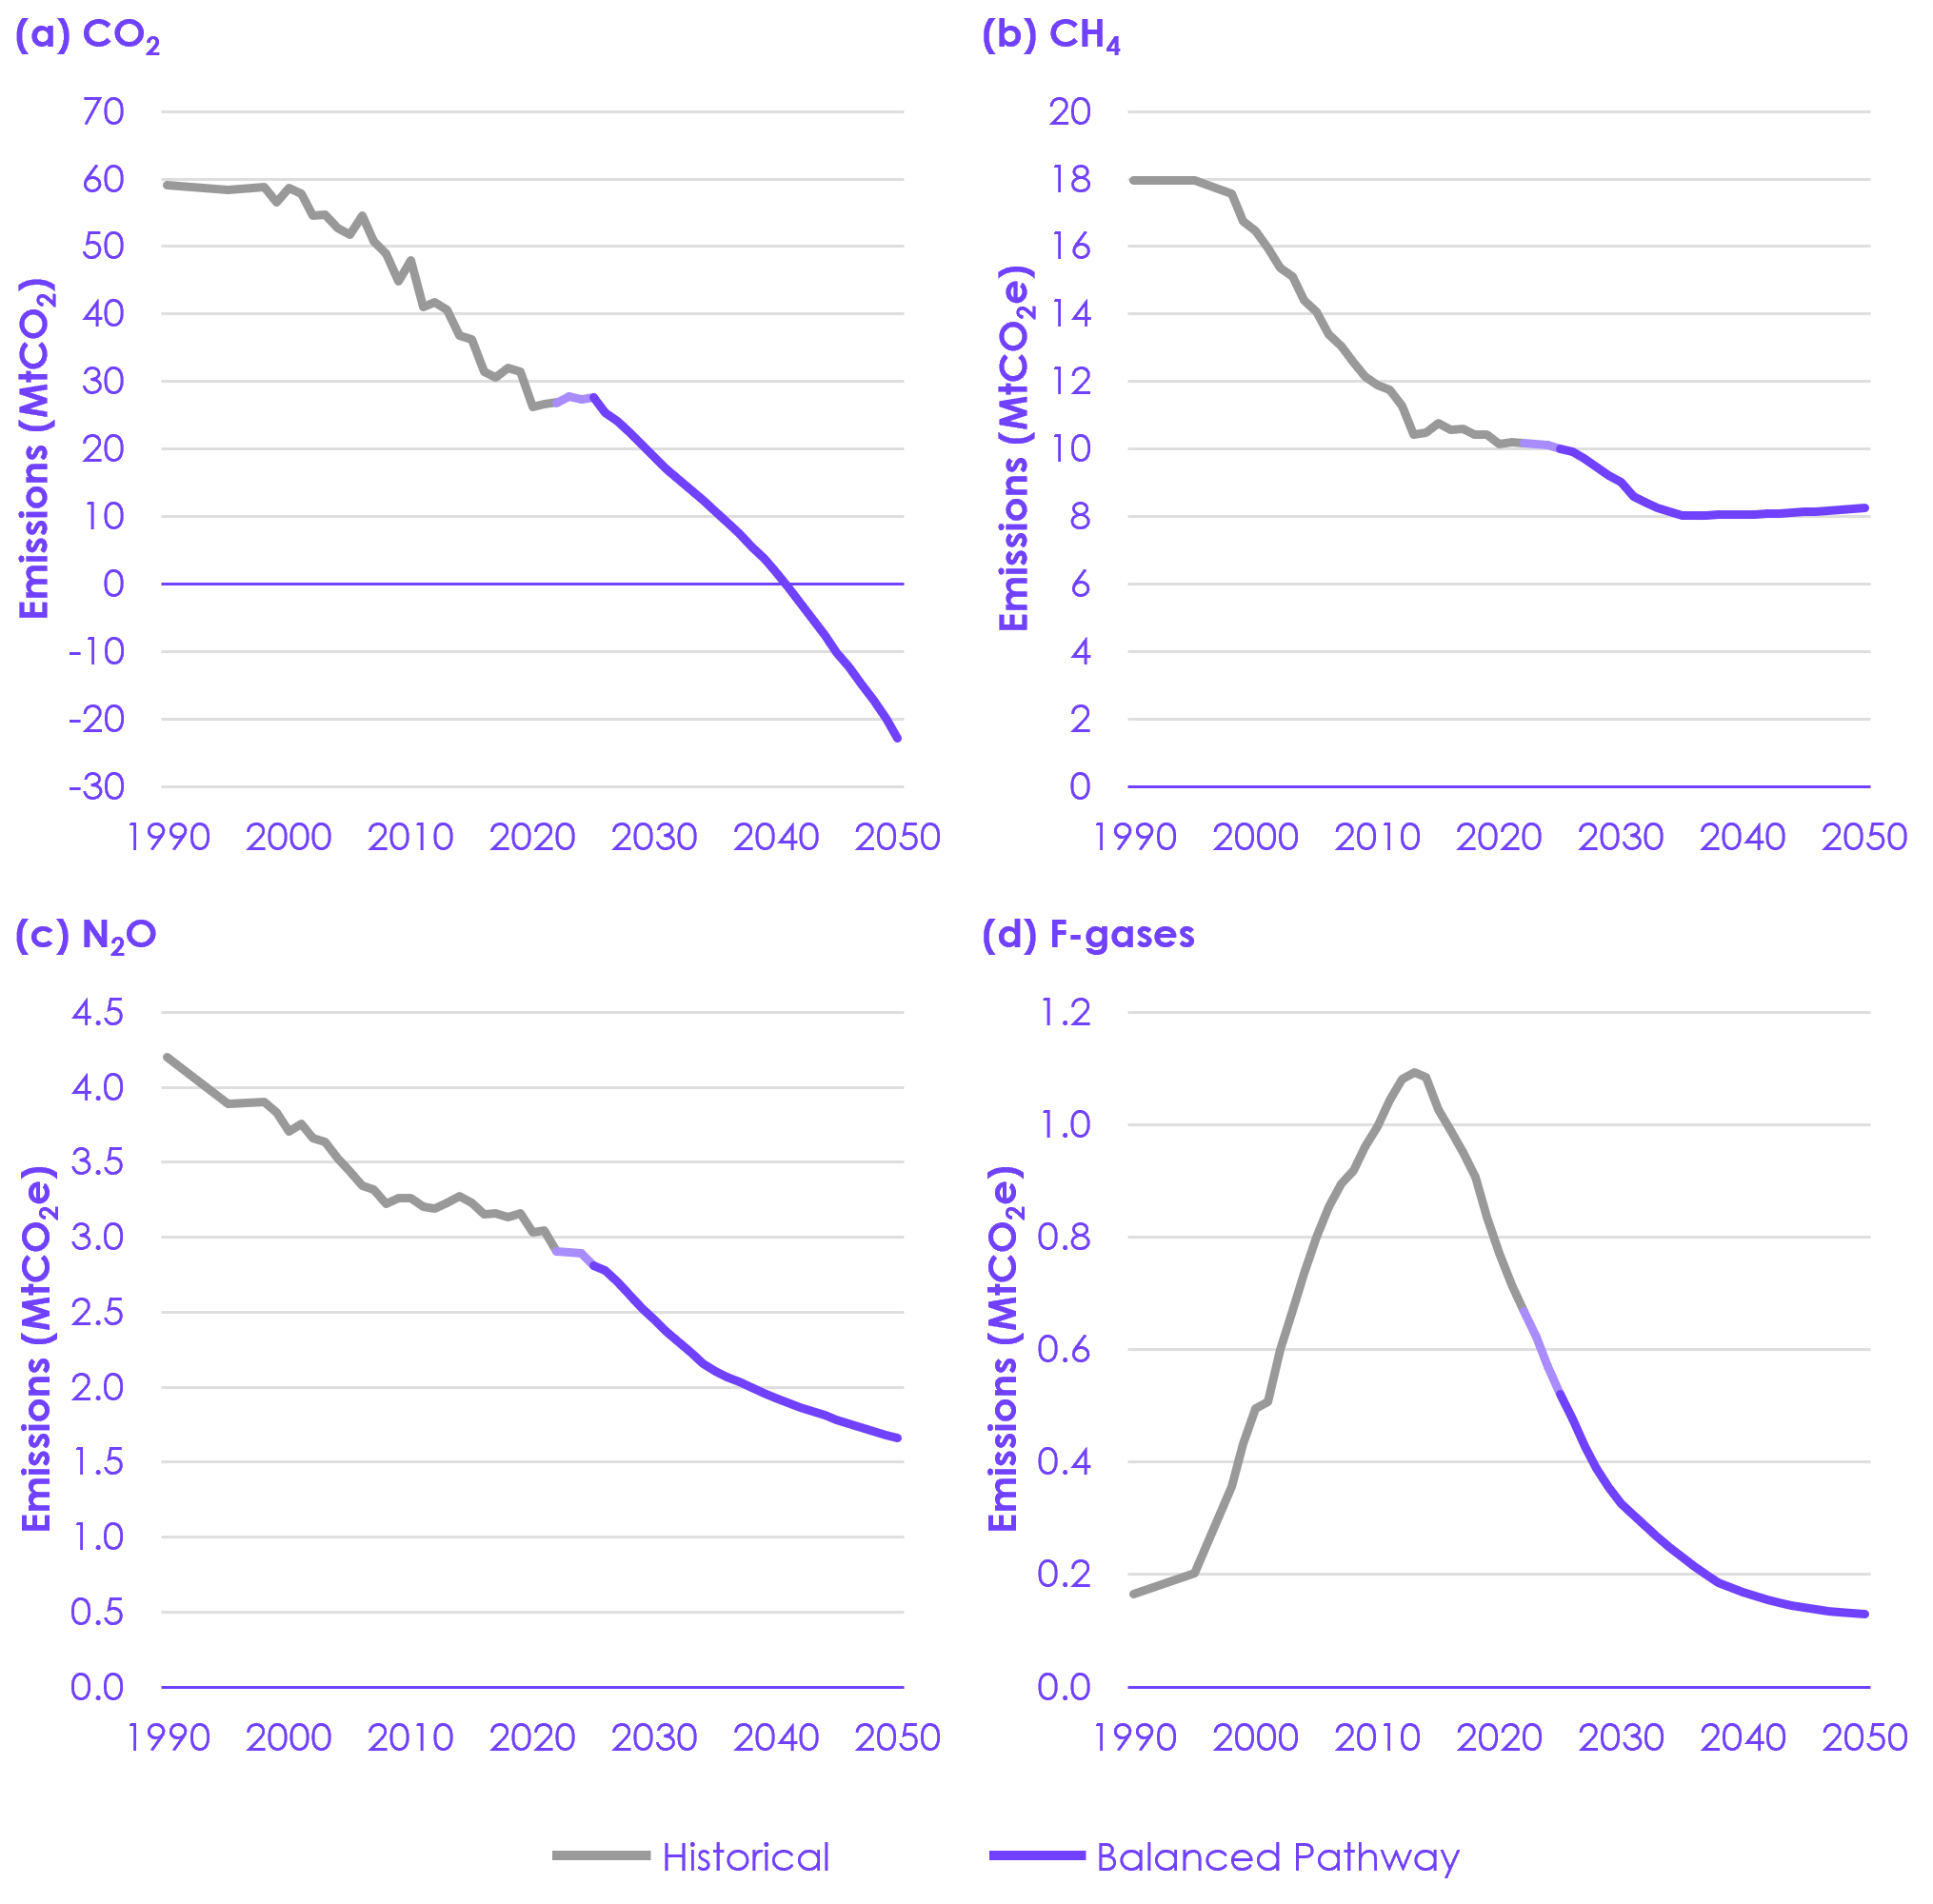
The Balanced Pathway reaches Net Zero across all GHGs in 2045 (Figure 2.4).
- Scotland reaches Net Zero CO2 four years earlier than the UK-wide Balanced Pathway, in 2041.
- This is largely due to proportionally higher rates of tree planting and faster deployment of DACCS in Scotland than in the other nations of the UK.
- CO2 reductions in our pathway come mostly from the roll-out of low-carbon technologies displacing fossil fuel combustion, along with reduced demand for high-carbon activities and deployment of engineered and land-based CO2 removals.
- Methane (CH4) emissions fall to 2035 but increase slightly between 2035 and 2050.
- Scotland saw large reductions in methane emissions during the 2000s, primarily due to reductions in waste and fuel supply emissions, although these have since plateaued.
- Methane emissions fall in the 2020s and early 2030s, mostly due to the impact of on-farm measures and diversification away from red meat and dairy production in agriculture, and reductions in methane generation at landfills.
- After 2035, methane emissions increase slightly. This is due to the significance of peatlands in Scotland. As peatlands are restored, rising water levels increase anaerobic decomposition, which in turn results in higher methane emissions. However, this is offset by CO2 savings as a growing proportion of peatlands are rewetted in the pathway.
- Nitrous oxide (N2O) emissions fall in the 2020s and early 2030s. Reductions come mainly in the agriculture sector, along with smaller reductions from reduced fossil fuel combustion across other sectors.
- Emissions of fluorinated gases (F-gases) continue recent trends of falling quickly. These are discussed in Section 3.2.11.
|
Figure 2.4 The Balanced Pathway by greenhouse gas in Scotland |
|
|
2.3.2 Sources of abatement
The first two carbon budgets cover the next decade. Therefore, meeting them will depend mostly on solutions that are available today, the vast majority of which come from electrification of key technologies across the economy and measures to reduce demand for high-carbon activities (Figure 2.5). Later in the pathway, nature and engineered removals play more of a role in balancing emissions in areas in which electrification is not feasible.
- Electricity: electrification delivers almost half of the total emissions reduction required throughout the Balanced Pathway. Electric technologies are now the clear low-carbon technology choice in many areas (including surface transport and home heating). They are available today and could be deployed rapidly in many key areas, provided the right incentives are put in place. Continuing to expand the supply of low-carbon electricity and the grid infrastructure to allow its use will be important to enable this to take place. Scaling up these immediate options is key to meeting all of Scotland’s carbon budgets.
- Demand: measures to reduce demand for high-carbon activities can be enacted from today and are particularly important to reduce emissions in the First Carbon Budget while technologies are still transitioning. They contribute around 30% of the total emissions reduction required by 2035. This includes measures to increase energy efficiency in homes, to use resources more efficiently in industry, and to reduce commercial, household, and food waste. There are also some sustained shifts away from high-carbon activities, including a shift to public transport and active travel and a reduction in livestock numbers driven by both reductions in meat consumption across the UK and measures to incentivise farmers to diversify income streams. Flying remains close to today’s levels until technology develops.
- Low-carbon farming, low-carbon fuels, and CCS: other low-carbon technologies play an important supporting role. This includes the deployment of hydrogen and CCS, which help to address sources of emissions that are less suited for electrification. In addition, a number of low-carbon farming practices and technologies are introduced in our pathway. Together these measures contribute around 10% of the total emissions reduction required in the Balanced Pathway.
- Nature: land-based actions contribute 8% of the emissions reduction required by 2035, increasing to 13% by 2045. The role of carbon sequestration in new woodlands grows substantially in the later years of the pathway, playing an essential role in balancing emissions to meet Net Zero. Together with renewables, they provide opportunities for Scottish farmers and land managers to diversify their income streams away from livestock farming. These measures can also bring a wider range of benefits, including to biodiversity in Scotland. Early action is vital to release land from agriculture and enable its use to grow natural carbon sinks: increased tree planting rates in the 2020s are necessary to deliver the required levels of sequestration by 2045 as trees mature, while higher levels of peatland restoration reduce peatland emissions.
- Engineered removals: the only engineered removal operating at scale in 2035 in our pathway is bioenergy with carbon capture and storage (BECCS), predominantly at Scotland’s energy from waste (EfW) plants. Engineered removals contribute 5% of the total emissions reduction required by 2035. However, the introduction of DACCS, along with other uses of BECCS and smaller contributions from enhanced weathering and biochar, mean that the share of emissions reduction from engineered removals grows in the later years of our pathway, contributing 10% of the total emissions reduction required by 2045.
The breakdown of emissions reductions required by 2045 to meet Scotland’s carbon budgets has some key differences to that required in our Balanced Pathway to meet the UK-wide Seventh Carbon Budget (Table 2.3).
- The share of abatement in Scotland from electricity is relatively lower than in the rest of the UK. This is because the electricity system in Scotland is already largely decarbonised. As in the UK pathway, electrification remains the key contributor to Scotland’s pathway to Net Zero.
- The shares of abatement in Scotland from nature and engineered removals are relatively higher than in the rest of the UK.
|
Figure 2.5 Sources of abatement in the Balanced Pathway in Scotland |
|
|
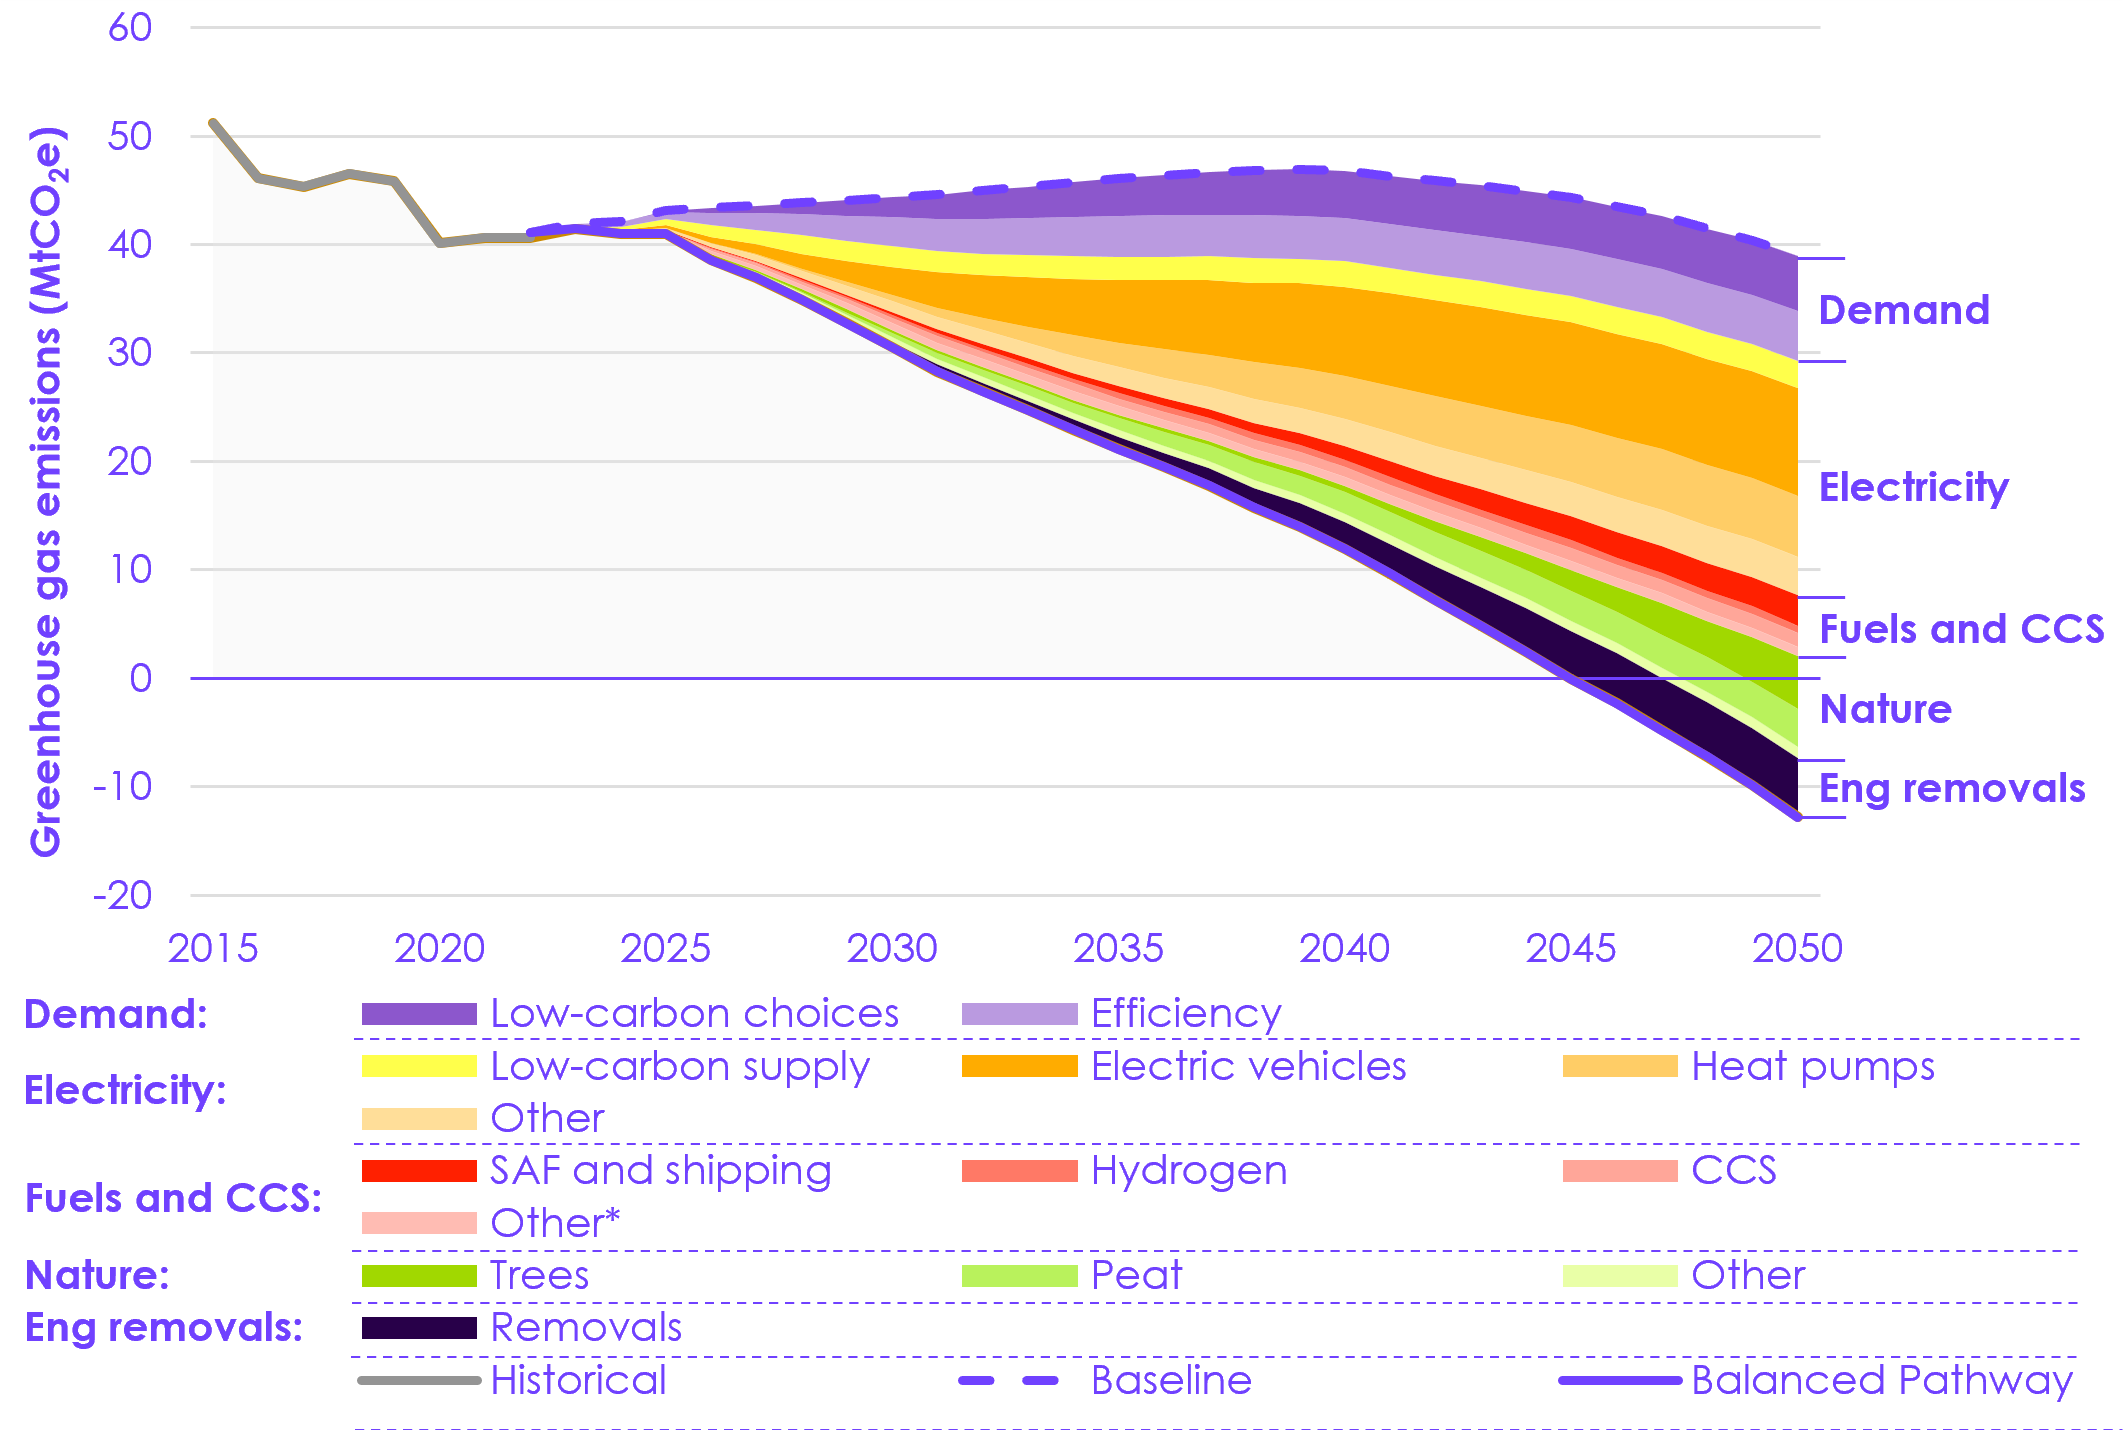
| Table 2.3 Comparison of abatement sources in Scotland and the UK as a whole |
||
| Share of emissions reductions by 2045 in Scotland (Balanced Pathway) | Share of emissions reductions by 2045 in the UK (Balanced Pathway) | |
| Electricity | 46% | 60% |
| Demand | 20% | 19% |
| Low-carbon farming, low-carbon fuels, and CCS | 11% | 11% |
| Nature | 13% | 3% |
| Engineered removals | 10% | 7% |
2.4 Emissions and removals in 2045
By 2045, the main source of residual emissions in Scotland will be agriculture, with smaller contributions from aviation, industry, and other sectors. In our pathway, residual emissions are offset by negative emissions from land use sinks and engineered removals (Figure 2.6).
- Scotland reaches Net Zero by 2045 in our pathway, as land-based and engineered removals of CO2 grow quickly to balance the emissions that remain across sectors by this point. In our pathway, emissions continue to fall and removals continue to grow beyond 2045.
- The largest shares of residual emissions in 2045 come from the agriculture, aviation, and industry sectors.
- There is also a sizeable contribution to residual emissions from other sectors. This includes remaining emissions from sectors such as surface transport and buildings, in which the transition to low-carbon technologies (for example EVs and heat pumps) continues out to 2050, in line with UK-wide deployment rates.
- The Scottish Government could choose to aim to decarbonise these sectors more quickly, which could reduce the share of residual emissions coming from these sectors and thereby lower dependency on engineered removals (see Section 3.3).
- Remaining emissions in agriculture and land use are balanced by the carbon sequestered by land-based sinks in the Balanced Pathway by 2045. In Scotland, this is a combination of sequestration in new woodlands, which requires ambitious action to scale up tree planting this decade, and restoration of peatlands (see Section 3.2.2).
- Remaining emissions from other sectors are offset by engineered removals located in Scotland in the Balanced Pathway by 2045. This includes BECCS, DACCS, and a small contribution from enhanced weathering and biochar (see Section 3.2.12).
- The definition of GHG removals in the Act currently only refers to land-based removals. However, engineered removals are needed to achieve Scotland’s 2045 Net Zero target and to make a fair contribution to the UK-wide 2050 Net Zero target. The Scottish Government should amend the Act (which can be done by order) to extend the definition of GHG removals to include engineered removals when legislating the carbon budget targets.
- A pathway without engineered removals would require 73% more land-based removals than in our Balanced Pathway to reach Scotland’s 2045 Net Zero target. This would require substantial increases on already ambitious tree planting rates.
- The exact proportion of UK engineered removals that will be located in Scotland is unknown and may be more or less than we have modelled. There is some room for a smaller proportion to be situated in Scotland with Scotland still achieving Net Zero emissions by 2045.
- The residual emissions that remain in Scotland in 2045 are mostly methane (primarily from land use and agriculture), which is a short-lived GHG. All remaining emissions will be balanced by removal of CO2, which is much longer lived (Figure 2.7). Overall, this leads to a peak and then decline in Scotland’s contribution to global warming by 2045, as continuing shorter-lived methane emissions are offset by removals of long-lived CO2.
|
Figure 2.6 Sources of emissions and negative emissions in the Balanced Pathway in Scotland in 2045 |
|
|
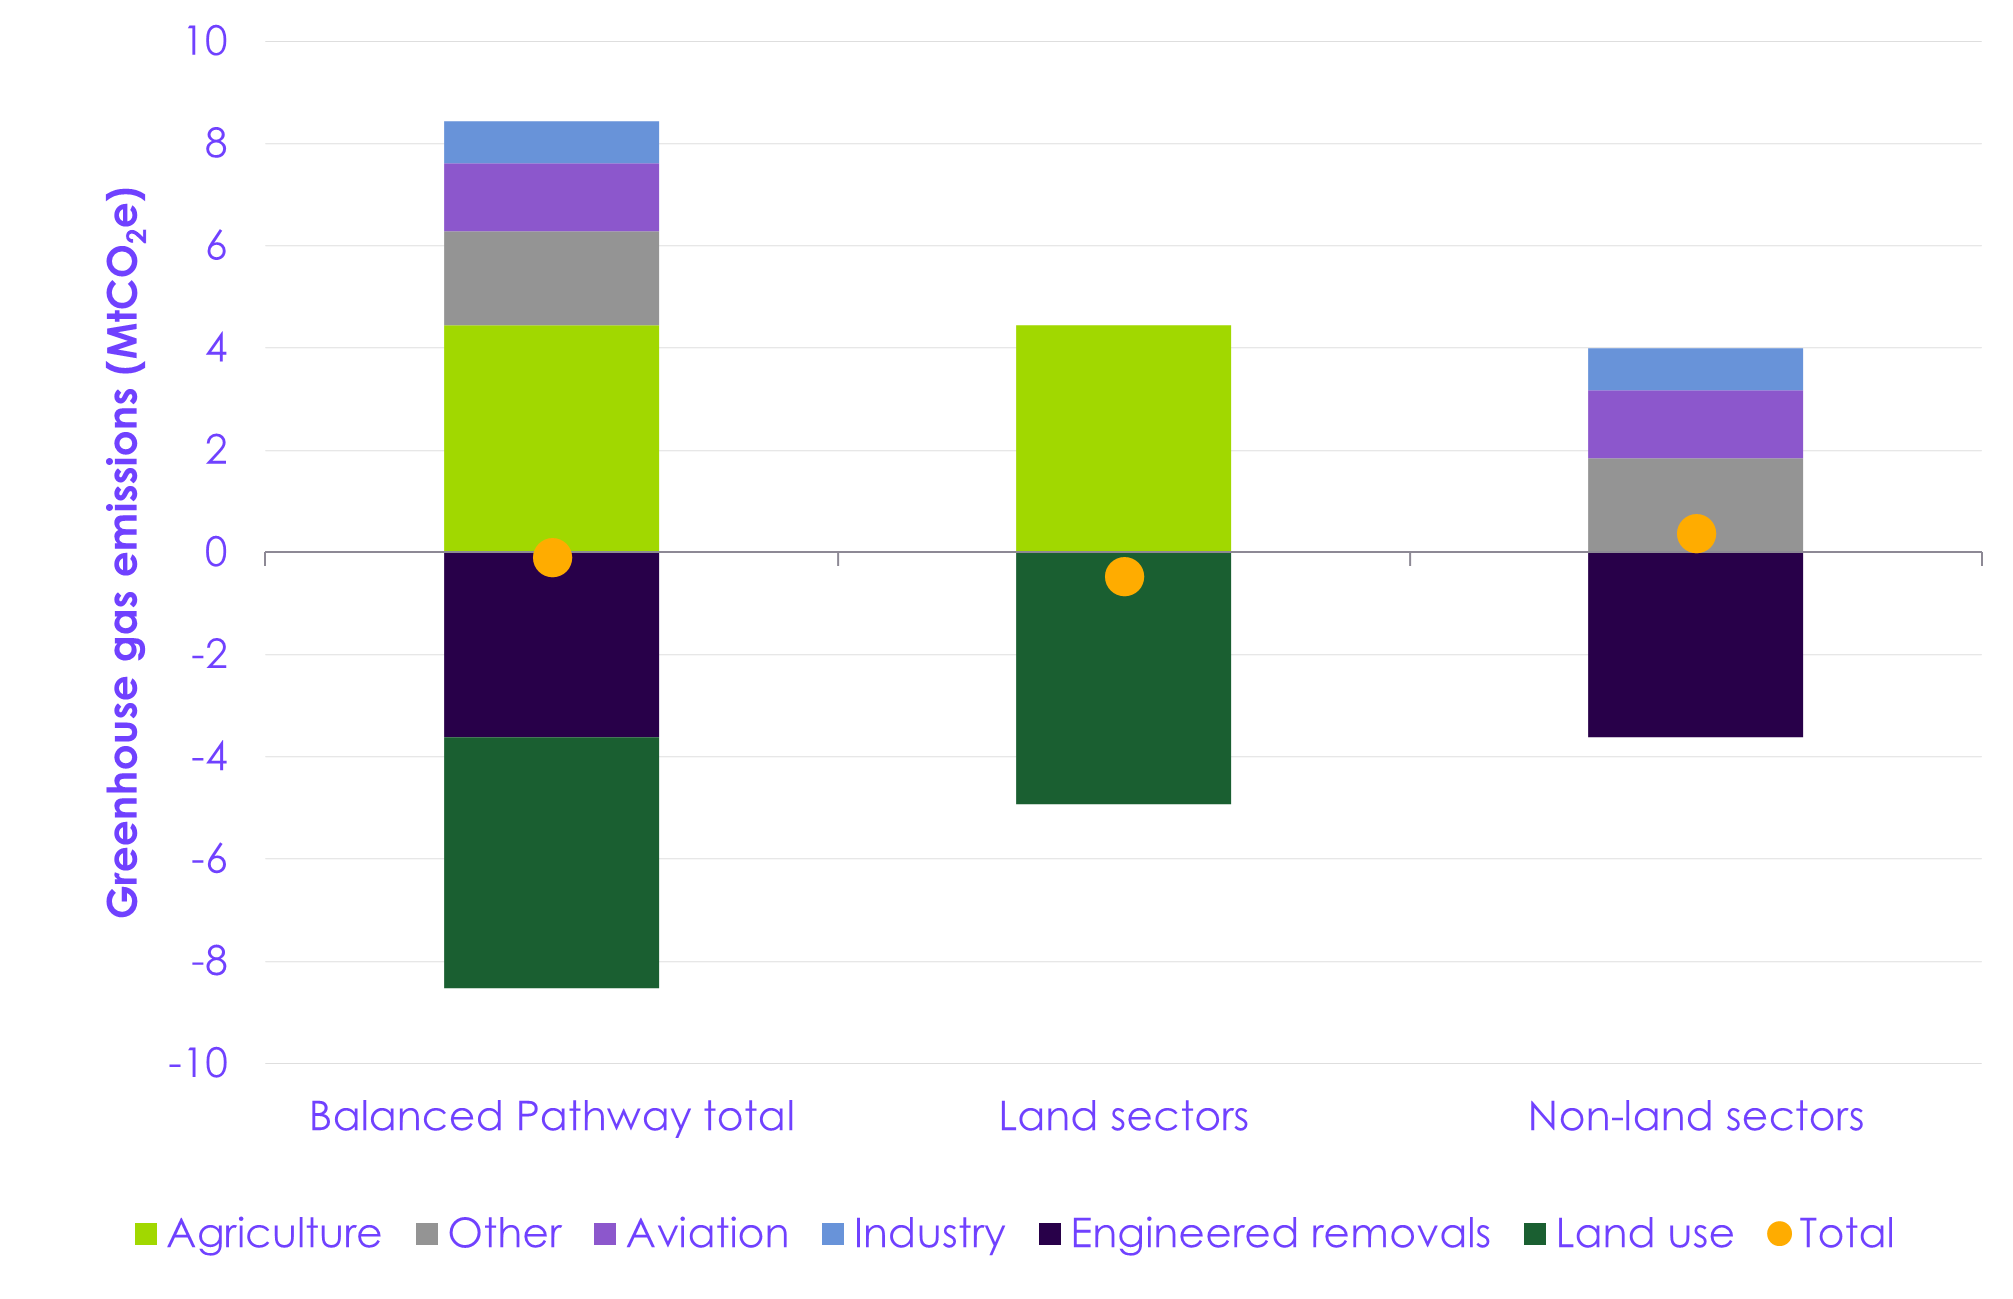
|
Figure 2.7 Emissions in the Balanced Pathway in Scotland in 2045 by greenhouse gas |
|
|
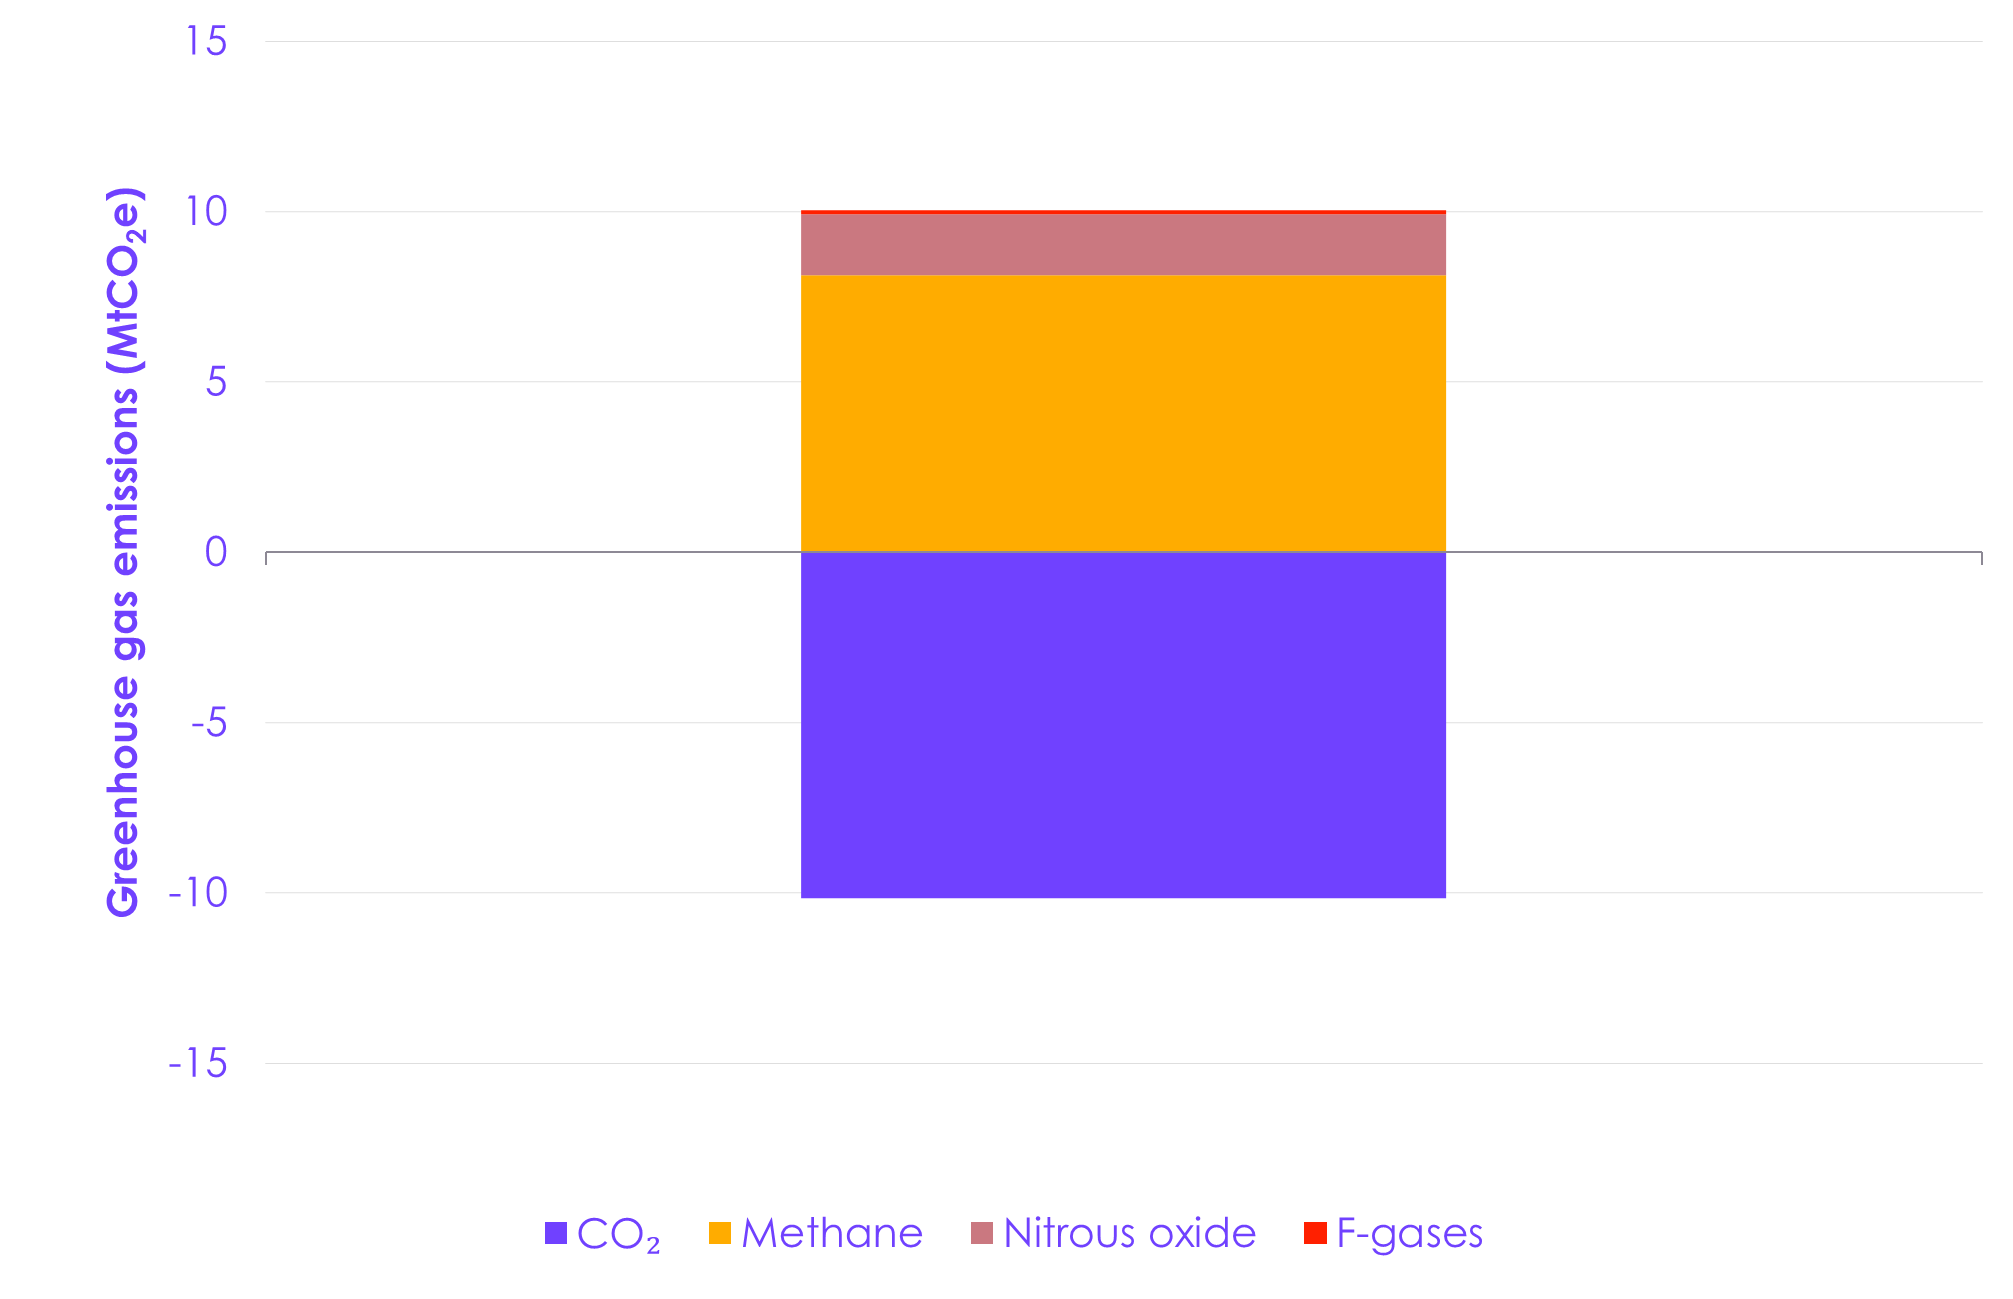
2.5 Costs and investment in the Balanced Pathway
This section sets out the whole-economy costs and cost savings for Scotland in the Balanced Pathway. More detail on the methodology behind this analysis can be found in Chapter 4 of our advice on the UK-wide Seventh Carbon Budget.
Figure 2.8 shows the whole-economy costs for Scotland between 2025 and 2050 under the Balanced Pathway. Costs are additional to a baseline of no further decarbonisation action and are presented undiscounted, in 2023 prices.[61]
- The pathway requires upfront investment, which generates operating cost savings. When combining capital and operating costs, we expect the pathway to generate a net cost for the whole economy in Scotland of around £750 million per year between 2025 and 2050, which is around 0.4% of Scotland’s GDP.[62];[63];[64];[65] The pathway becomes net saving from 2043.
- Additional capital (investment) cost is expected to peak in 2029 at £4.2 billion and is driven by deployment of low-carbon technologies and changes in their cost over time. We expect economies of scale and learning-by-doing to reduce low-carbon technology costs, slowing additional investment costs (and in some cases generating savings) towards 2050. In general, our modelling assumes that high-carbon assets are replaced at the end of their physical life, rather than scrapped early.
- Additional operating cost is negative throughout the 25-year period, generating a cost saving relative to the baseline. Operating cost savings increasingly offset the investment costs required, peaking at £2.7 billion in 2050. Although we don’t model costs beyond 2050, we can assume operating savings will continue to grow.
- When considering the cost profile between 2025 and 2045, the average net cost of the pathway is £1.4 billion per year. This amounts to around 0.6% of Scotland’s GDP.
At a sectoral level, costs follow a similar pattern to those for the UK as a whole. Key sector costs are discussed below:
- Electricity supply: the investment required to decarbonise the current electricity system is front-loaded in the 2020s and 2030s and becomes negative in the 2040s as the in-year capital cost in the pathway falls below that in the baseline.
- In the Balanced Pathway, the electricity system in Scotland is also expanded to meet demand from the rest of Great Britain. GB-wide electricity costs are scaled to estimate costs required to decarbonise the current system, meeting Scotland’s demand only.[66]
- Residential buildings: additional capital spending includes the upfront cost of low-carbon heating systems and energy efficiency improvements. These measures improve the efficiency of heating technologies, generating operating savings.
- Surface transport: delivering the pathway for this sector results in cost savings from 2027. This is due to the falling cost of EVs compared to fossil fuel vehicles and operating savings from improved efficiency and lower fuel and maintenance costs.
- Agriculture and land use: additional capital expenditure includes decarbonisation of machinery and investment into soil and livestock measures. For land use, capital and operating costs include woodland creation and management and peatland restoration.
- Industry: investment costs include the electrification of industrial processes, the installation of CCS, and limited hydrogen processes. Electrification and other efficiency measures generate significant operating savings in this sector.
- Fuel supply: additional investment and operating costs include decarbonisation of oil and gas platforms and terminals in the North Sea, low-carbon hydrogen supply, synthetic fuel production, and limited bioenergy.
- Engineered removals: investment costs include production facilities for BECCS, DACCS, and biochar and enhanced weathering removals, and operating costs include maintenance and running costs for these facilities.
- In practice, we assume the majority of engineered removals costs will be paid for by polluters.
- Waste: capital costs include CCS installation for EfW plants. Other costs include expenditure on landfill and recycling (including waste reduction measures) and wastewater improvements.
Delay to investment into decarbonisation will delay the realisation of benefits, including operating cost savings, improved resilience, and energy security.
The economic cost of climate change impacts to Scotland is highly uncertain and estimates vary depending on the extent of warming that takes place. However, if Scotland and other countries fail to address climate change, the macroeconomic impacts on Scotland could be high.
|
Figure 2.8 Additional capital expenditure and operating costs in the Balanced Pathway, compared to the baseline |
|
|

Chapter 3: Emissions reductions by sector in the Balanced Pathway
Introduction and key messages
This chapter describes the Balanced Pathway for Scotland in each sector, setting out the key measures that combine to reduce emissions and the priority actions required to deliver the pathway.
Our key messages are:
- The first two carbon budgets cover the next decade. Achieving them will require a focus on key near-term actions, especially in surface transport and buildings, and ensuring that the conditions are in place for these to be delivered.
- Emissions in Scotland are dominated by surface transport, agriculture, industry, and residential buildings, with important contributions from many other sectors. Decarbonising surface transport and buildings provides around half the emissions reductions required over the first two carbon budgets. Contributions from agriculture and land use become increasingly important, comprising around half of the emissions reduction required over the Fourth Carbon Budget period.
- Emissions reductions from surface transport are the largest contribution to meeting the first two carbon budgets. With the cost of EVs falling, the Scottish Government has an important role in enabling successful implementation of the zero-emission vehicle (ZEV) mandate, including by expanding provision of charging infrastructure and providing reliable public information on electric vehicles. The Scottish Government should also promote modal shift away from cars by improving public transport services and active travel infrastructure.
- Emissions reductions from buildings are the second largest contribution to meeting the first two carbon budgets in our pathway. Together with energy efficiency measures, more efficient electrified heating can help reduce fuel poverty in Scottish households. Clean, efficient, electric technologies can offer wider benefits such as reduced air pollution and lower and less volatile energy bills compared to continued reliance on fossil fuel technologies.
- By the time of the Third and Fourth Carbon Budgets, the agriculture and land use sectors will be making the biggest contribution to emissions reduction in our pathway for Scotland. Together, agriculture and land use can reach Net Zero by 2045. Natural carbon sequestration, mostly increased tree planting and restoration of degraded peatlands, offsets the remaining emissions from livestock in 2045. This requires rapid scaling up of tree planting now because of the time it takes for trees to mature and start absorbing substantial amounts of carbon. The Scottish Government will need to support farmers and rural communities to diversify their incomes away from livestock farming and towards woodland creation, peatland restoration, agroforestry, and renewable energy.
3.1 Sectoral contributions
3.1.1 Emissions reductions by sector
Meeting Scotland’s proposed carbon budgets will require contributions across all sectors (Figure 3.1). In the Balanced Pathway, agriculture emissions fall but it is the highest-emitting sector in 2045. Emissions for the other main sectors will also fall (Table 3.1). This will be driven by switching to efficient, low-carbon technologies and reducing demand for high-carbon activities in key areas.
- Surface transport: the pathway for surface transport is primarily driven by the uptake of EVs, which we project to accelerate rapidly over the coming years as prices fall. Measures to enable a shift from car use to public transport and active travel also play a role in reducing emissions from fossil fuel cars, which will still make up 40% of the fleet in 2035. By 2045, 94% of cars on Scottish roads will be electric (see Section 3.2.1).
- Agriculture and land use: emissions fall through a combination of low-carbon farming practices and technologies and a reduction in livestock numbers. Diversifying uses of land allows more peatland to be restored and new woodlands to be created, increasing carbon sequestration and offsetting residual agricultural emissions. By 2035, combined emissions from agriculture and land use fall by 9% in our pathway. Thereafter they fall rapidly, reaching Net Zero emissions by 2045 (see Section 3.2.2).
- Industry: reductions in industry emissions largely come from electrification of industrial processes, such as the adoption of electric steam crackers by the chemicals sector. Electricity provides 31% of energy in industry by 2035, and 58% by 2045 (see Section 3.2.3).
- Residential buildings: the transition to low-carbon home heating (mostly heat pumps, primarily as standalone systems, but also within communal systems) is well underway by 2035 in our pathway, with 40% of homes having low-carbon heating. Home insulation measures also play a significant role in reducing emissions over the first two carbon budget periods. By 2045, 92% of Scottish homes have low-carbon heating (see Section 3.2.4).
- Fuel supply: the largest share of emissions reductions in fuel supply comes from declining North Sea production as the basin matures and refining activity ceases (see Section 3.2.5).
- Non-residential buildings: the largest share of emissions reductions in the non-residential buildings sector comes from the installation of low-carbon heating (see Section 3.2.6).
| Table 3.1 Change in emissions compared to 2022 in today’s highest-emitting sectors |
|||||
| Sector | 2025 | 2030 | 2035 | 2040 | 2045 |
| Surface transport | -4% | -35% | -66% | -87% | -97% |
| Agriculture and land use | +5% | 0% | -9% | -33% | -106% |
| Industry | -8% | -30% | -51% | -72% | -85% |
| Residential buildings | +10% | -2% | -33% | -66% | -92% |
| Fuel supply | -11% | -66% | -83% | -87% | -97% |
| Non-residential buildings | 0% | -32% | -72% | -87% | -94% |
|
Figure 3.1 Sectoral emissions in the Balanced Pathway in Scotland |
|
|
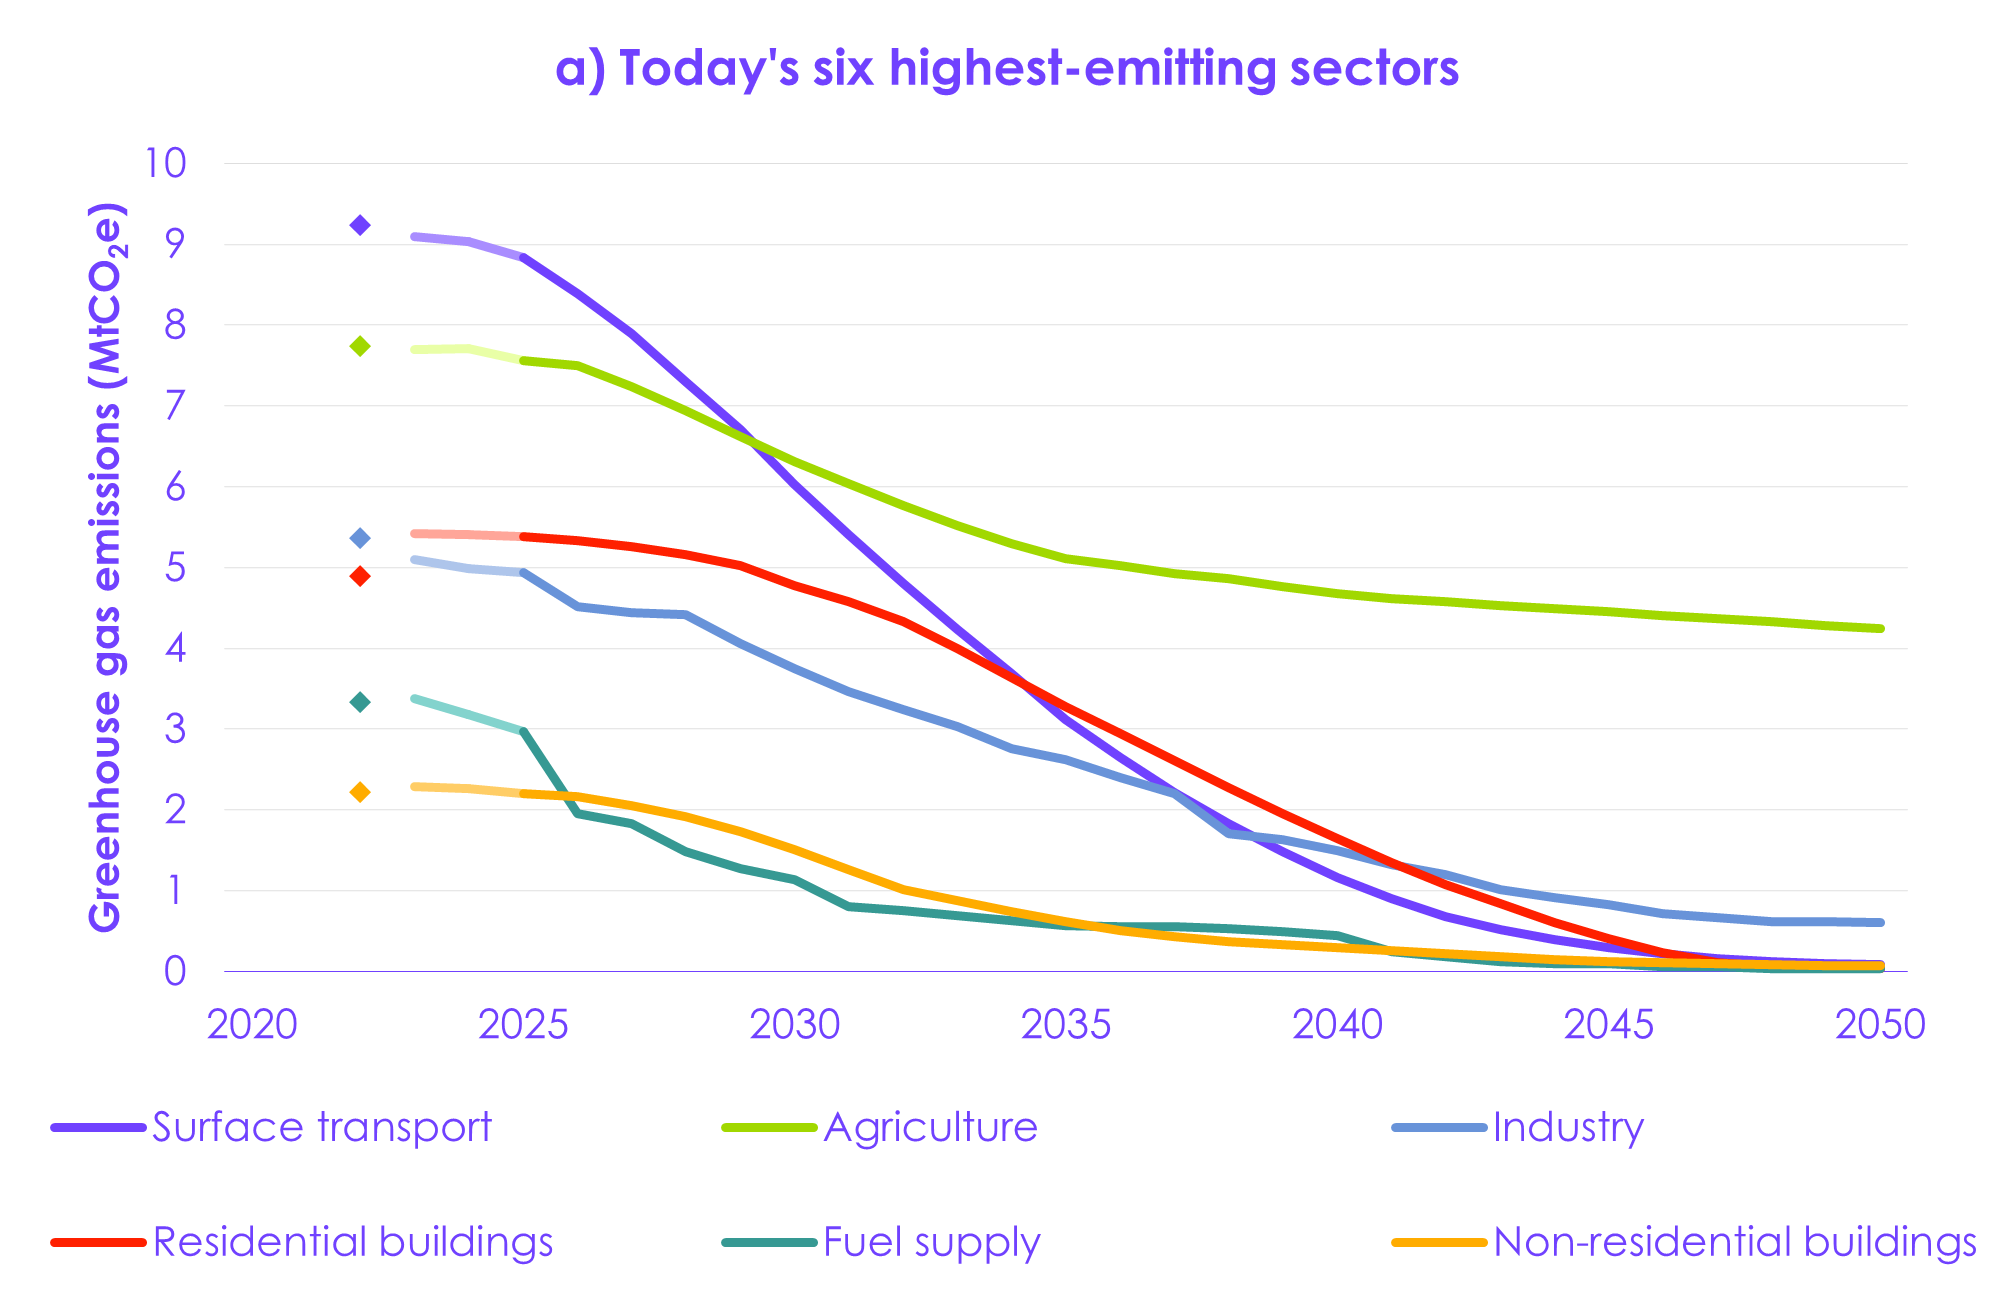
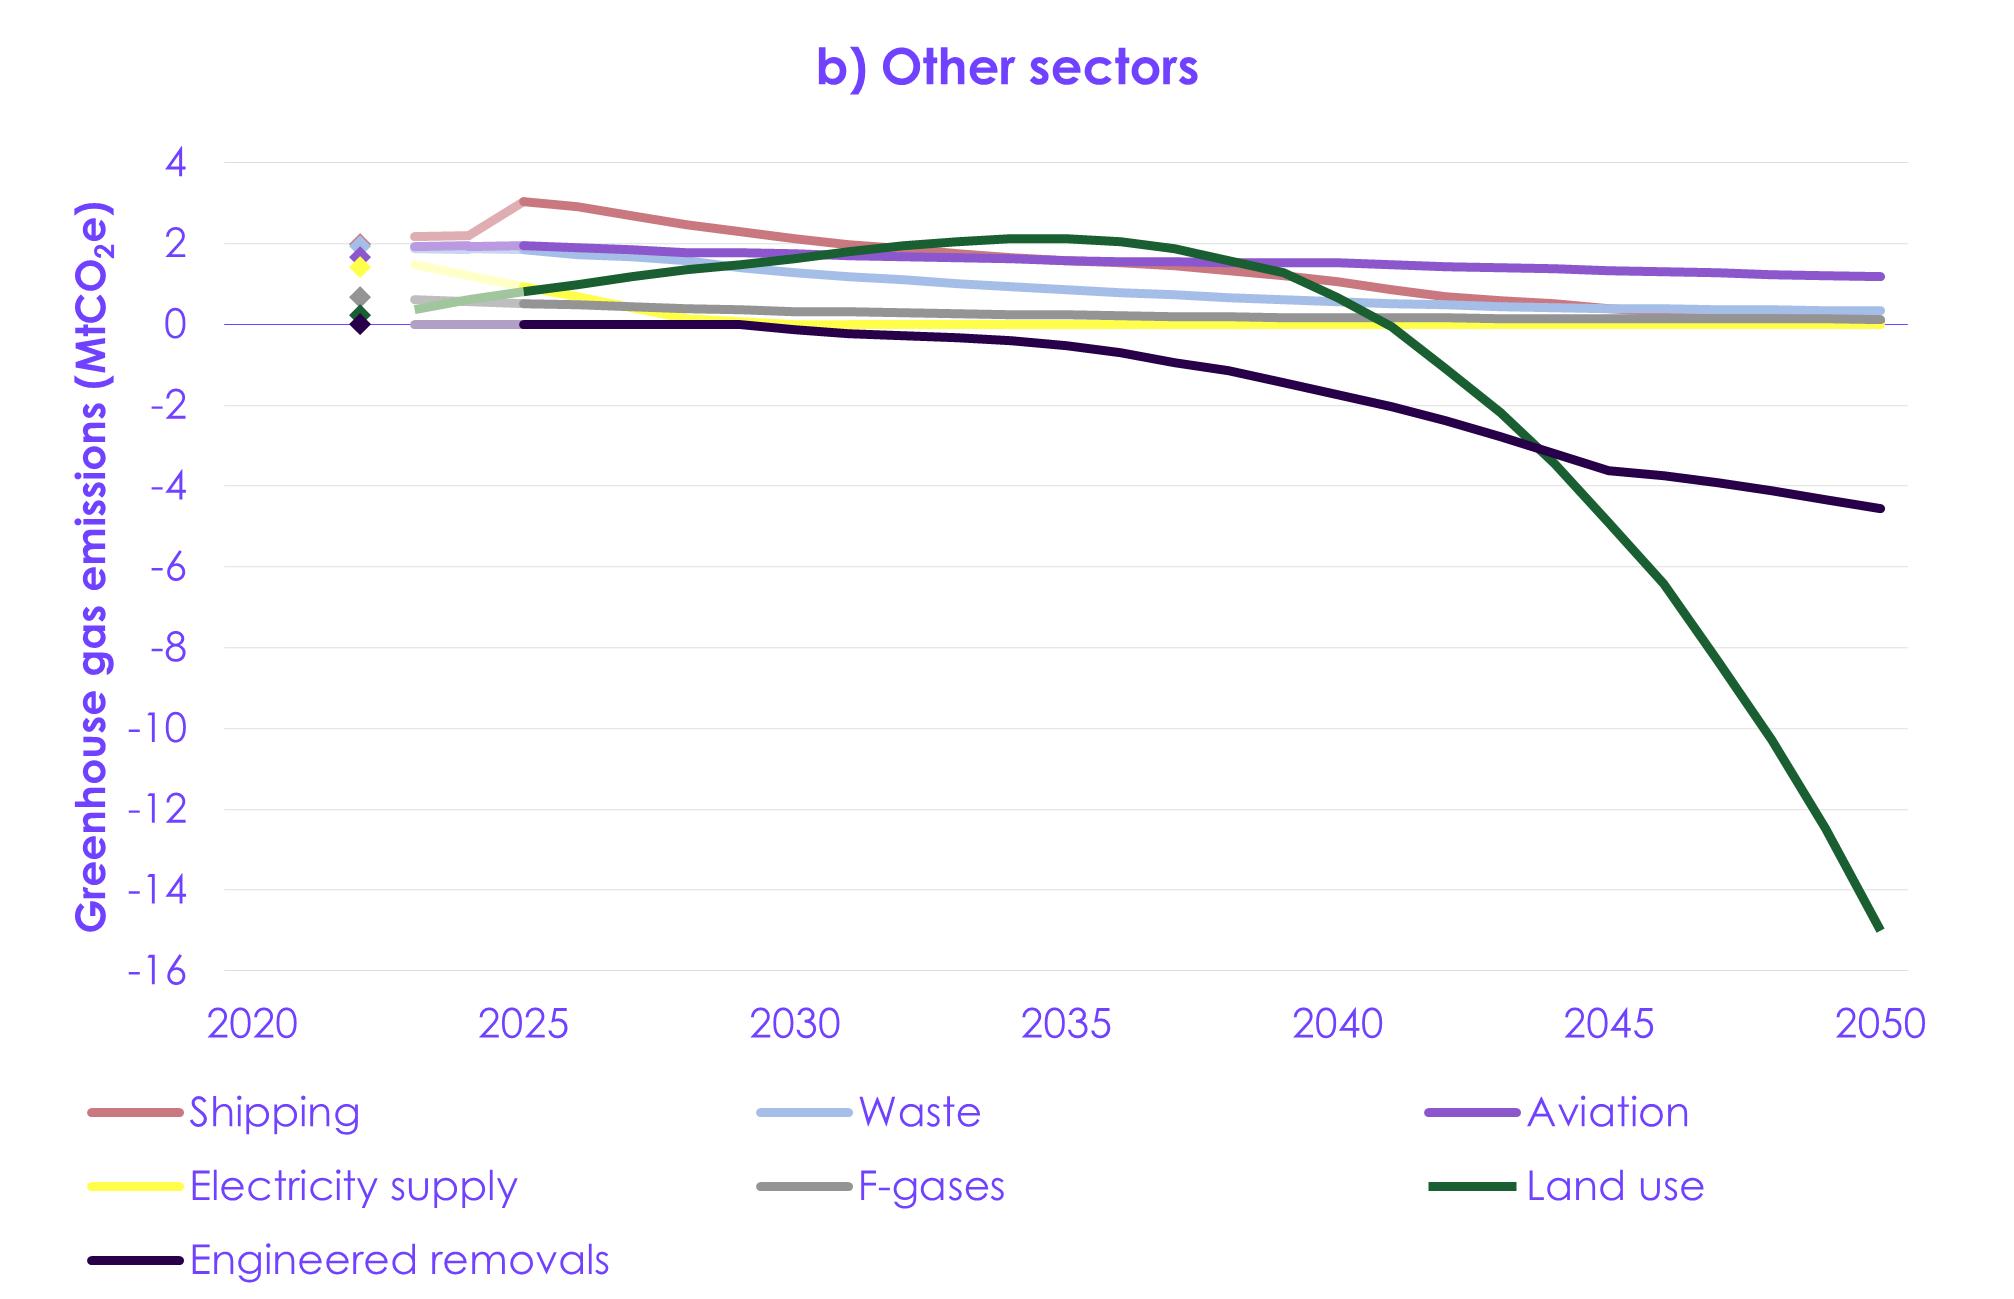
3.1.2 Emissions reductions during each carbon budget period
The majority of the emissions reductions seen in Scotland to date has been in the energy supply and industry sectors. Action needs to broaden across a wider range of sectors to deliver the emission reductions that are required in Scotland’s carbon budgets (Figure 3.2).
- Since the introduction of the Climate Change (Scotland) Act in 2009, over 70% of the emissions reductions (and projected emissions reductions for years for which data have not yet been published) between 2009 and 2025 has been in the energy supply sectors.
- Emissions reductions now need to broaden to more sectors across the economy – nearly 75% of the reductions between now and 2030 need to come in sectors other than energy supply.
- In particular, actions to deliver emissions reductions need to speed up quickly in surface transport, buildings, and agriculture and land use (see Section 3.2). Decarbonising surface transport and buildings provides around half the emissions reductions required over the first two carbon budgets. Contributions from agriculture and land use become increasingly important, comprising around half of the emissions reductions required over the Fourth Carbon Budget period. The Scottish Government has devolved powers to deliver the necessary emissions reductions in these key sectors.
- Emissions reductions from surface transport are the largest contribution to meeting the first two carbon budgets, providing 29% of emissions reductions over this period.
- Emissions reductions from buildings are the second largest contribution to meeting the first two carbon budgets in our pathway, providing 19% of emissions reductions over this period.
- By the time of the Third and Fourth Carbon Budgets, the agriculture and land use sectors will be making the biggest contribution to emissions reduction in our pathway for Scotland. Agriculture and land use provides 21% of the emissions reductions over the Third Carbon Budget period and 48% of the emissions reductions over the Fourth Carbon Budget period.
|
Figure 3.2 Distribution of emissions reductions during each carbon budget period in the Balanced Pathway in Scotland |
|
|
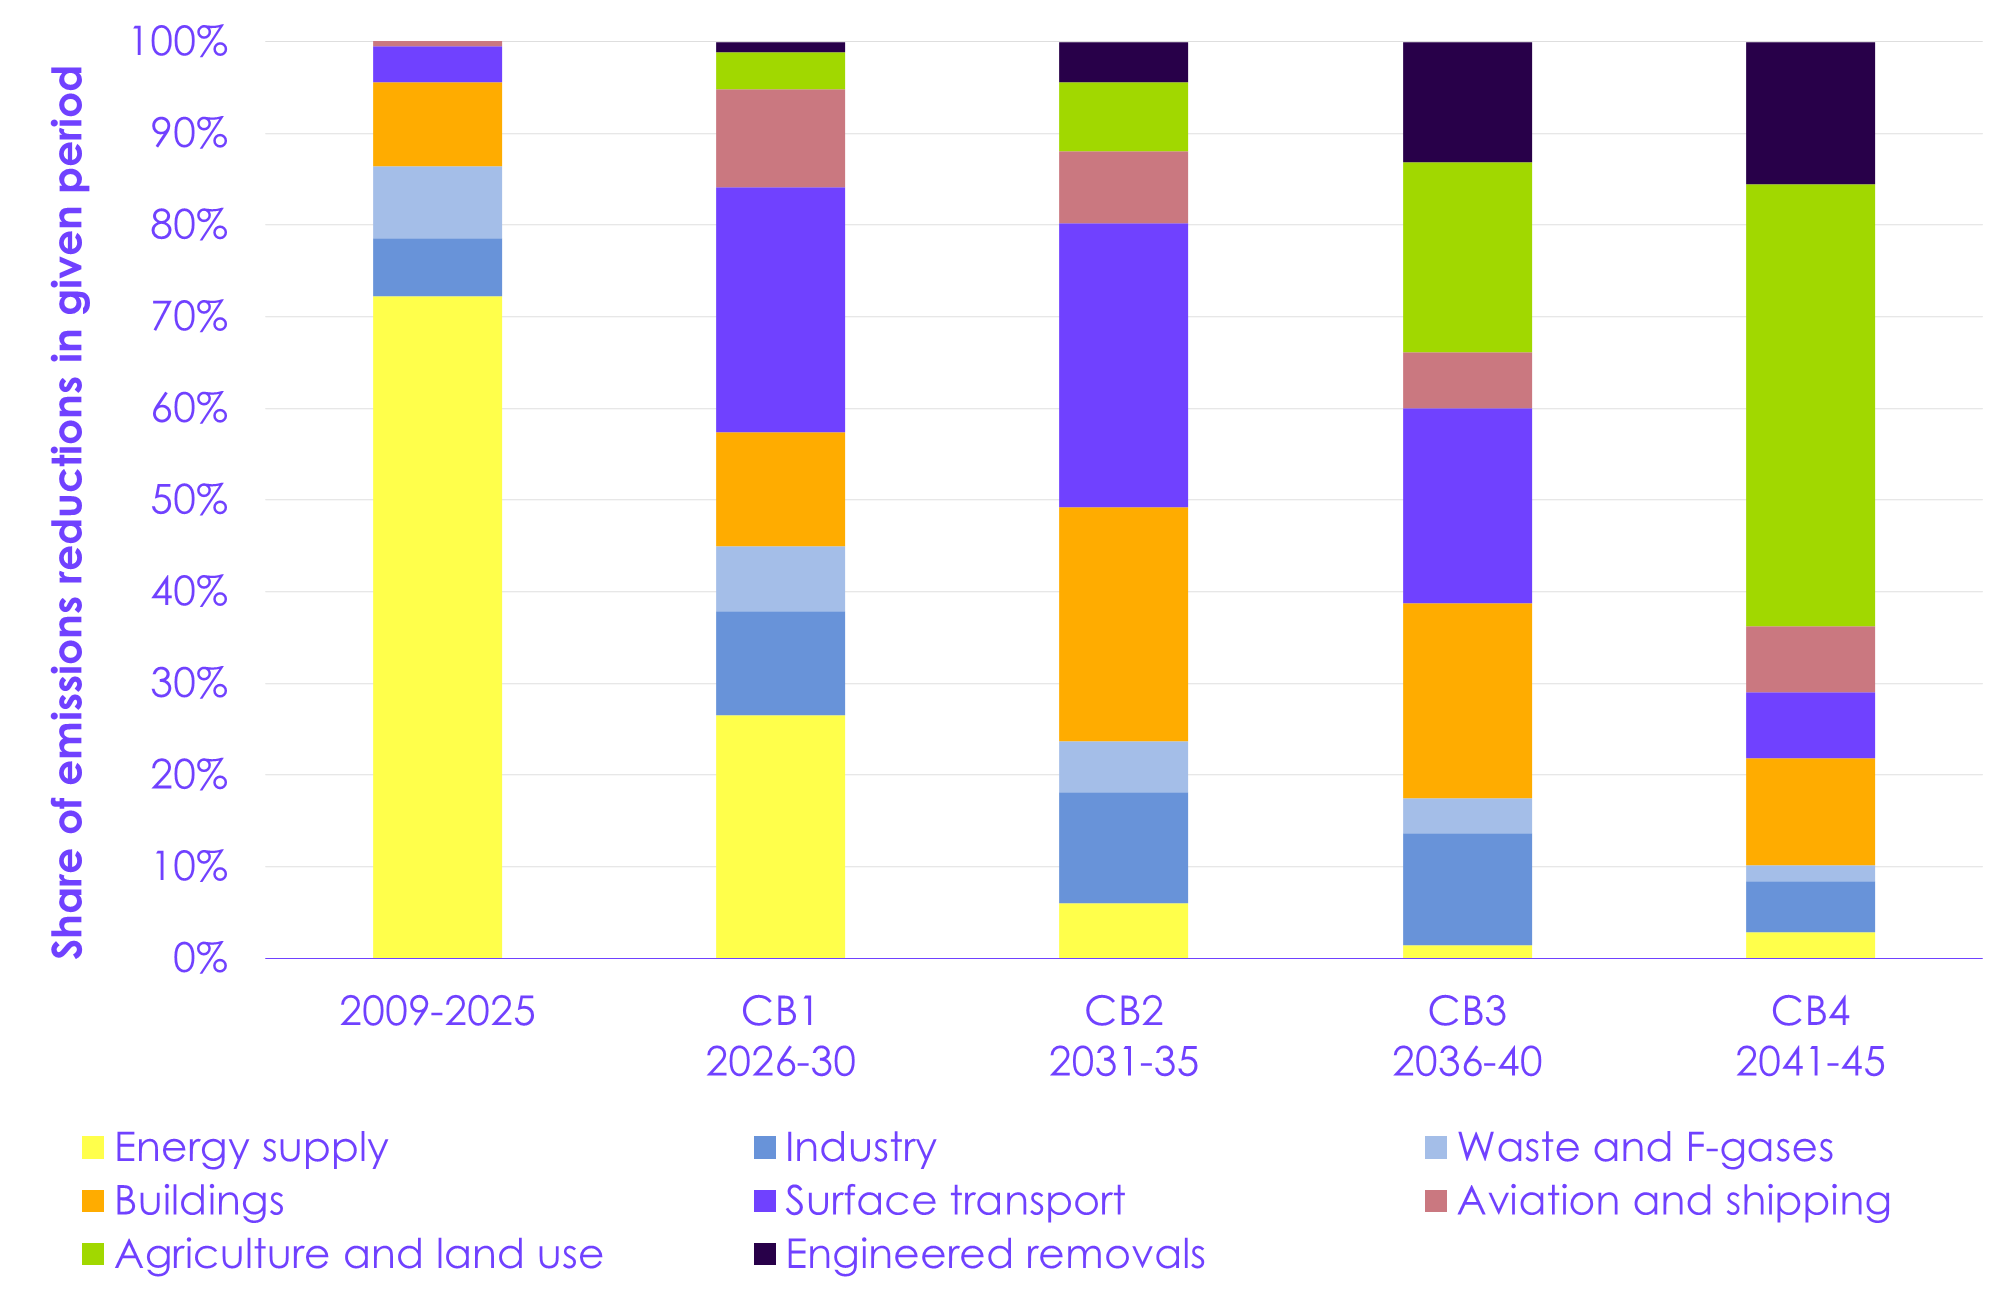
3.1.3 Emissions in Scotland compared to the UK Balanced Pathway
Emissions in Scotland made up 9% of 2022 UK emissions. On a per capita basis, emissions in Scotland are slightly higher than those in the UK as a whole. Per capita emissions in Scotland reach Net Zero by 2045, five years earlier than the UK as a whole, largely due to proportionally higher rates of tree planting and faster deployment of direct air carbon capture and storage (DACCS) in Scotland than in the other nations of the UK (Figure 3.3).
- Total per capita emissions in 2022 are similar in Scotland and the UK as a whole. However, per capita emissions in Scotland are relatively higher in agriculture and land use (due to Scotland’s relatively large agricultural sector) and relatively lower in energy supply (due to the concentration of renewables deployment to date in Scotland, particularly wind projects). Higher energy demand per household for home heating (reflecting colder average temperatures) and higher per capita car-kilometres mean that per capita emissions are also slightly higher in the buildings and transport sectors in Scotland than the average across the UK.
- Per capita emissions in most sectors fall at a similar rate in Scotland as in the UK as a whole. However, per capita emissions from agriculture and land use in Scotland do not fall significantly by 2035. This is because land use emissions from soils increase as new woodlands are planted. This is then offset by sequestration as the trees grow, such that agriculture and land use emissions per capita are close to zero in Scotland by 2045.
- Per capita energy supply emissions fall faster in the UK between 2022 and 2035 because Scotland has already made proportionally more progress decarbonising electricity supply. Per capita energy supply emissions in 2035 are similar in Scotland and the UK.
- Per capita industry emissions fall faster in the UK between 2022 and 2045 because the chemicals subsector, which decarbonises relatively slowly, makes up a relatively higher proportion of Scottish industry than across the UK.
- By 2045, Scotland has higher land-based and engineered removals per capita than the UK as a whole, largely due to proportionally higher rates of tree planting and faster deployment of DACCS in Scotland than in the other nations of the UK, enabling Scotland to achieve Net Zero earlier.
|
Figure 3.3 Emissions per capita in Scotland and the UK – 2022 historical and 2035 and 2045 in the Balanced Pathway |
|
|
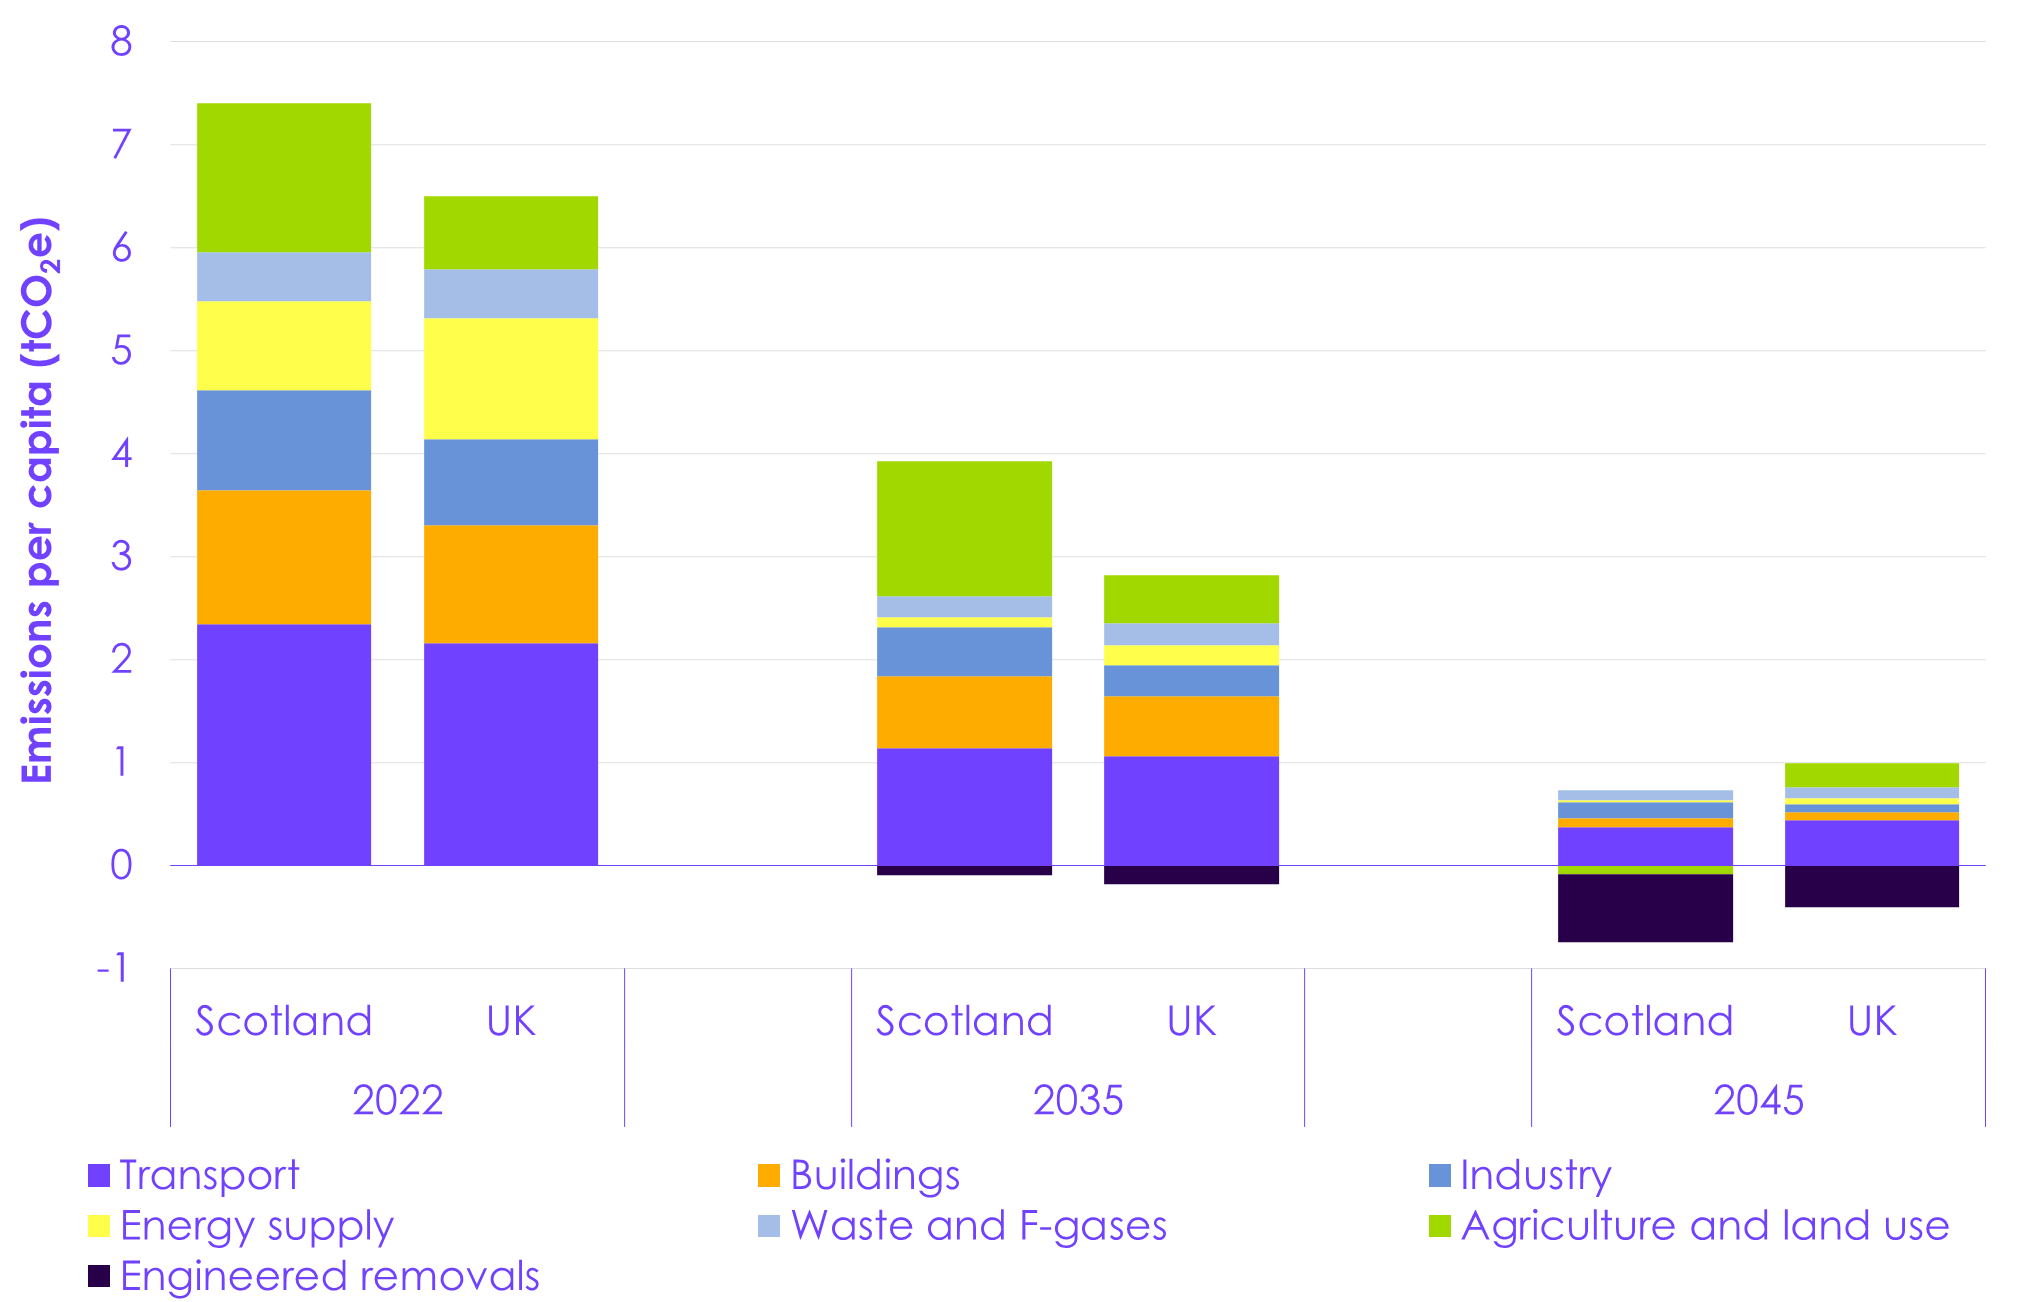
3.2 The Balanced Pathway by sector
The following sections outline the Balanced Pathway by sector, summarising historical emissions trends, the key measures in each sector pathway, and key actions required to deliver the pathway. Delivery indicators for sectoral roll-outs of low-carbon technologies and land-based actions are shown in Figure 3.4 and for the demand for high-carbon activities in Figure 3.5. Where it is available, they are compared to historical data.
We have not constrained our Balanced Pathway modelling to meet the Scottish Government’s targets and ambitions in areas such as modal shift, woodland creation and peatland restoration. The proposed inclusion of a target to decarbonise building heating by 2045 in the Heat in Buildings Bill was announced after our modelling was completed and is also not met in our pathway. It is for the Scottish Government to decide proposals and policies to meet Scotland’s targets and there may be options to go further in these areas (see Section 3.3).
|
Figure 3.4 Key indicators of roll-out of low-carbon technologies and land-based actions in the Balanced Pathway in Scotland |
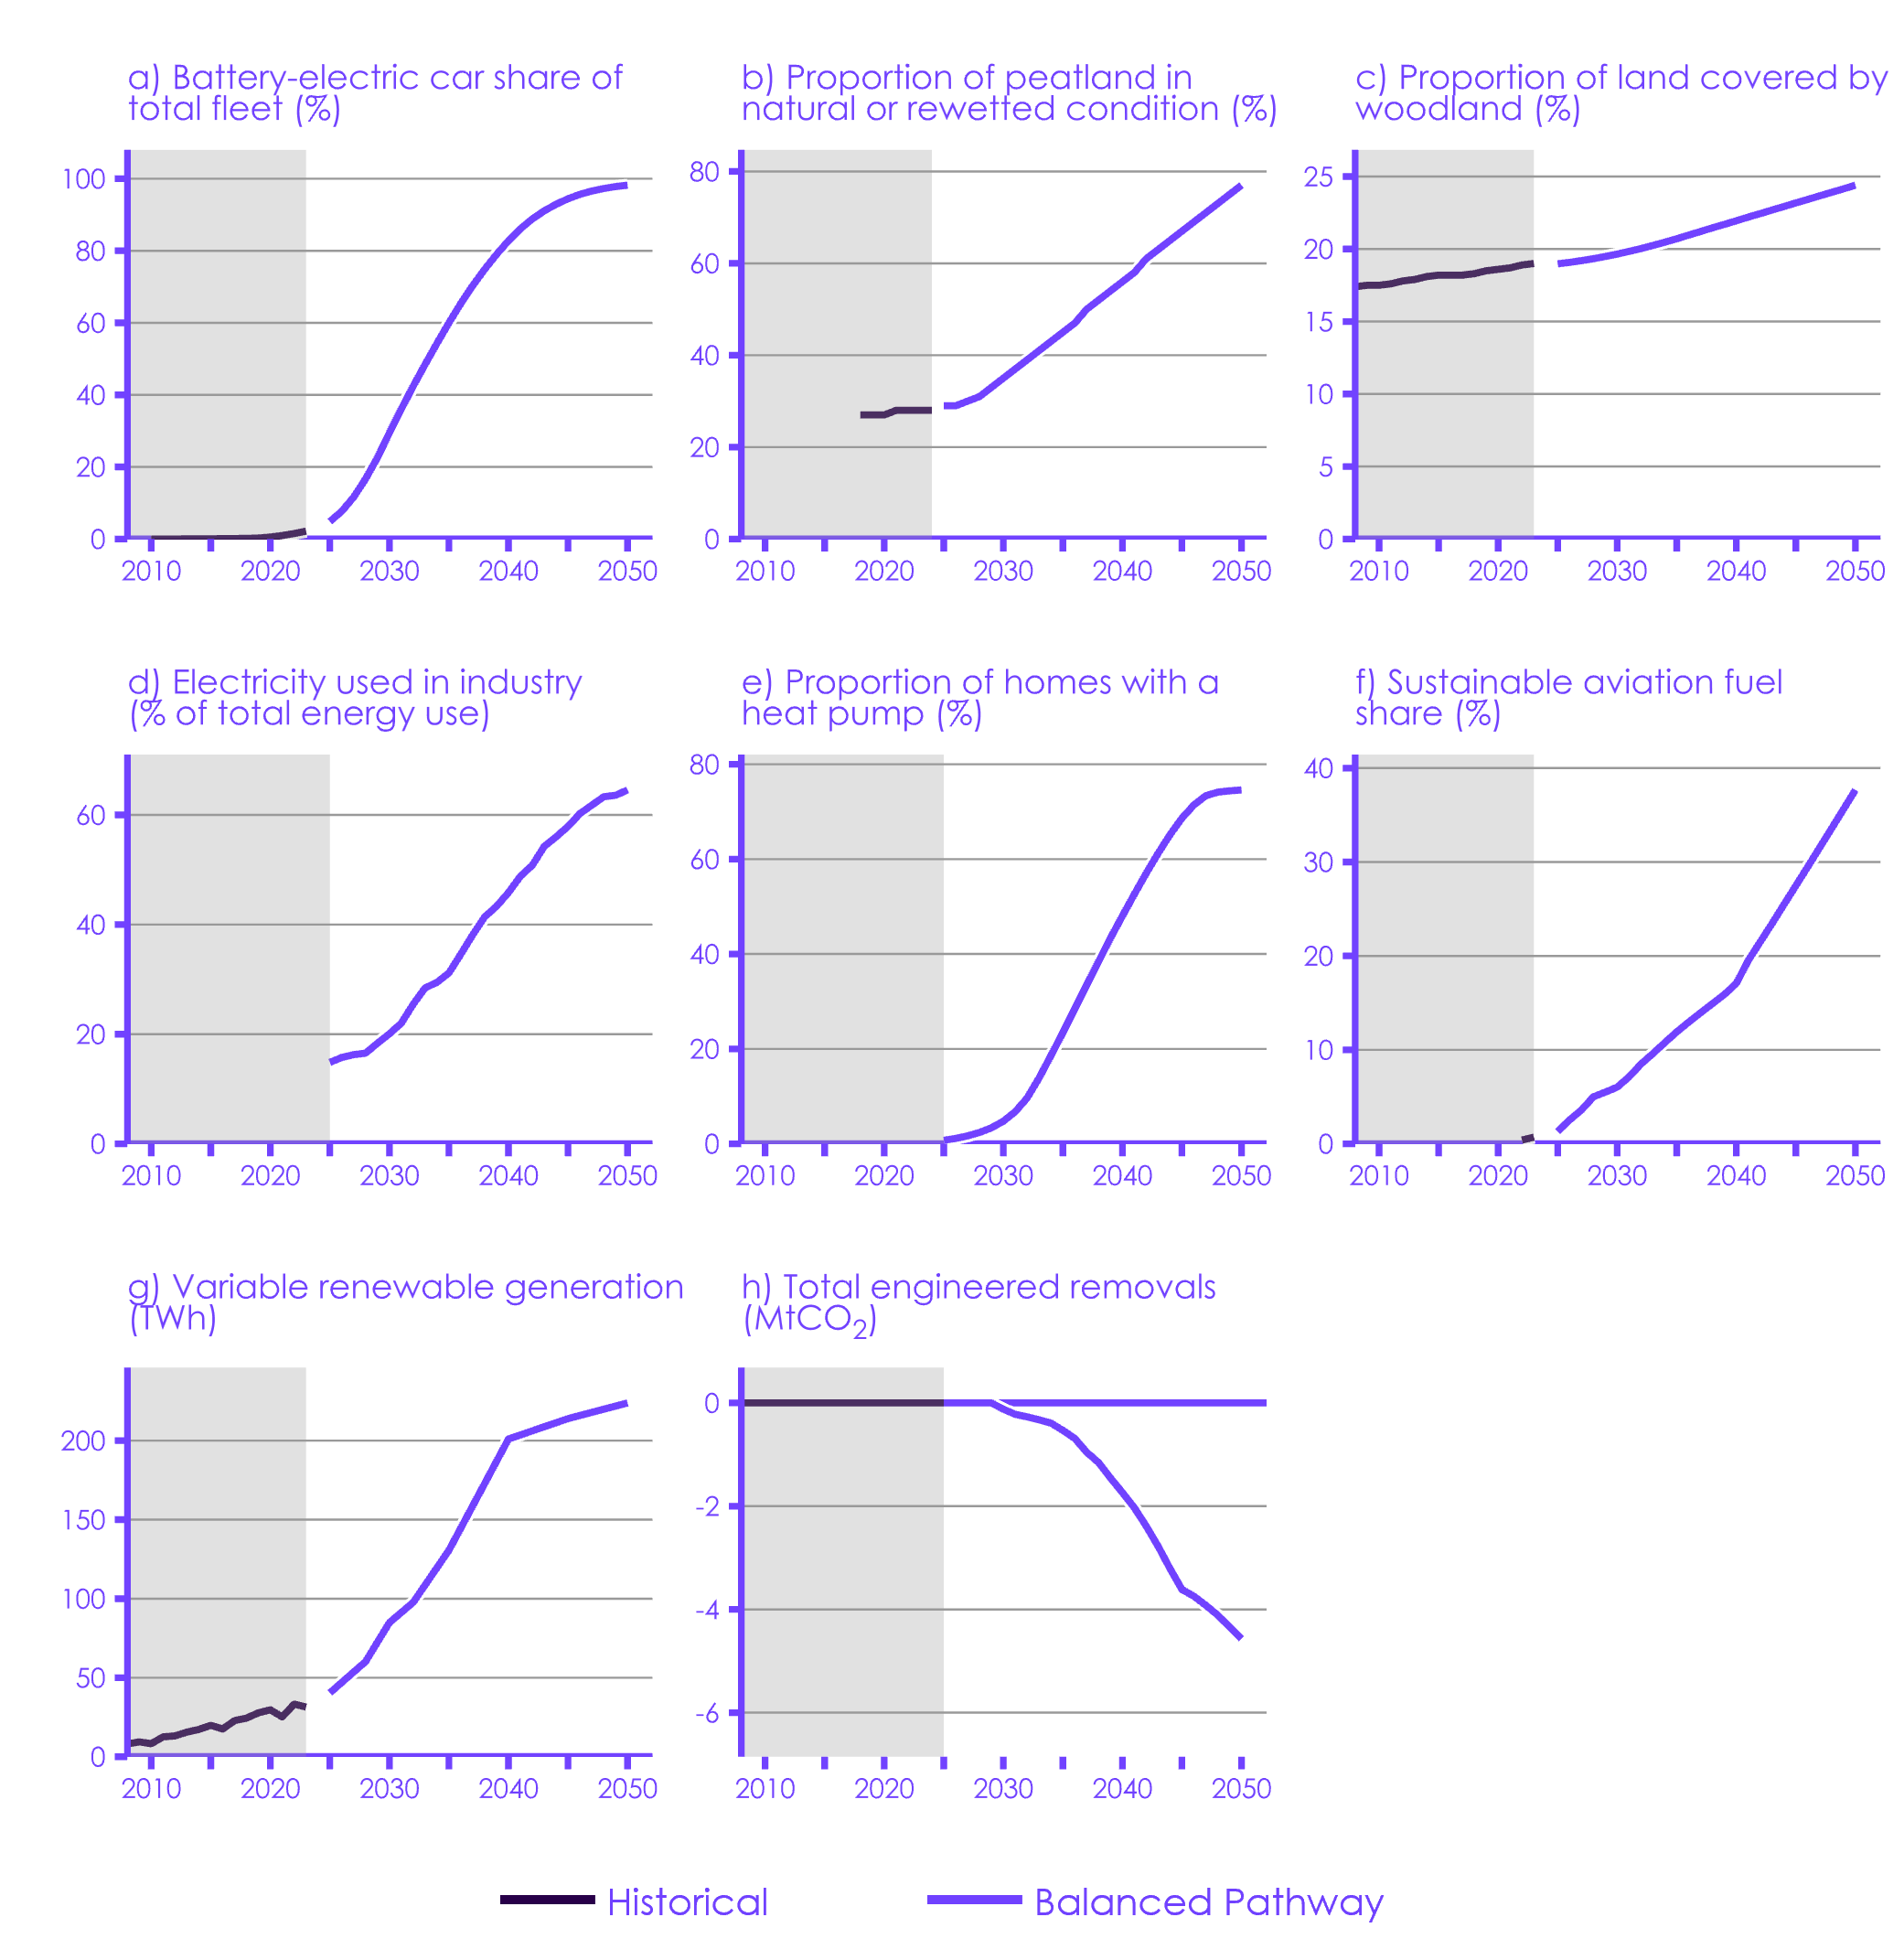 Description: The key quantity indicators of the roll-out of low-carbon technologies and land-based actions in our pathway show growth that follows an S-curve in the electrification of cars, home heating, and industry; a ramp-up in tree planting and peatland restoration rates; continued growth in renewables; and growing contributions from low-carbon fuels and engineered removals. Source: Historical data from UK Department for Transport, UK Centre for Ecology & Hydrology, UK Department for Environment, Food and Rural Affairs, Forest Research, UK Heat Pump Association, and UK Department for Energy Security and Net Zero; CCC analysis. Notes: (b) The Balanced Pathway peatland proportions are based on the annual rewetting area, as reported in the UK greenhouse gas inventory. (c) Historical woodland area is based on the September 2024 Woodland Statistics release. Our modelling is underpinned by the 2021 National Forest Inventory (NFI) estimates of woodland area. (e) The chart shows the share of existing homes that are heated by a heat pump in each year, including homes with individual heat pumps and those connected to communal heat pump systems. This share does not include homes connected to low-carbon heat networks (some of which will use heat pumps). (f) The historical data shown here is for the UK as a whole as this data does not exist for Scotland. (g) Projected generation is based on an average weather year. |
|
Figure 3.5 Key indicators of demand for high-carbon activities in the Balanced Pathway in Scotland |
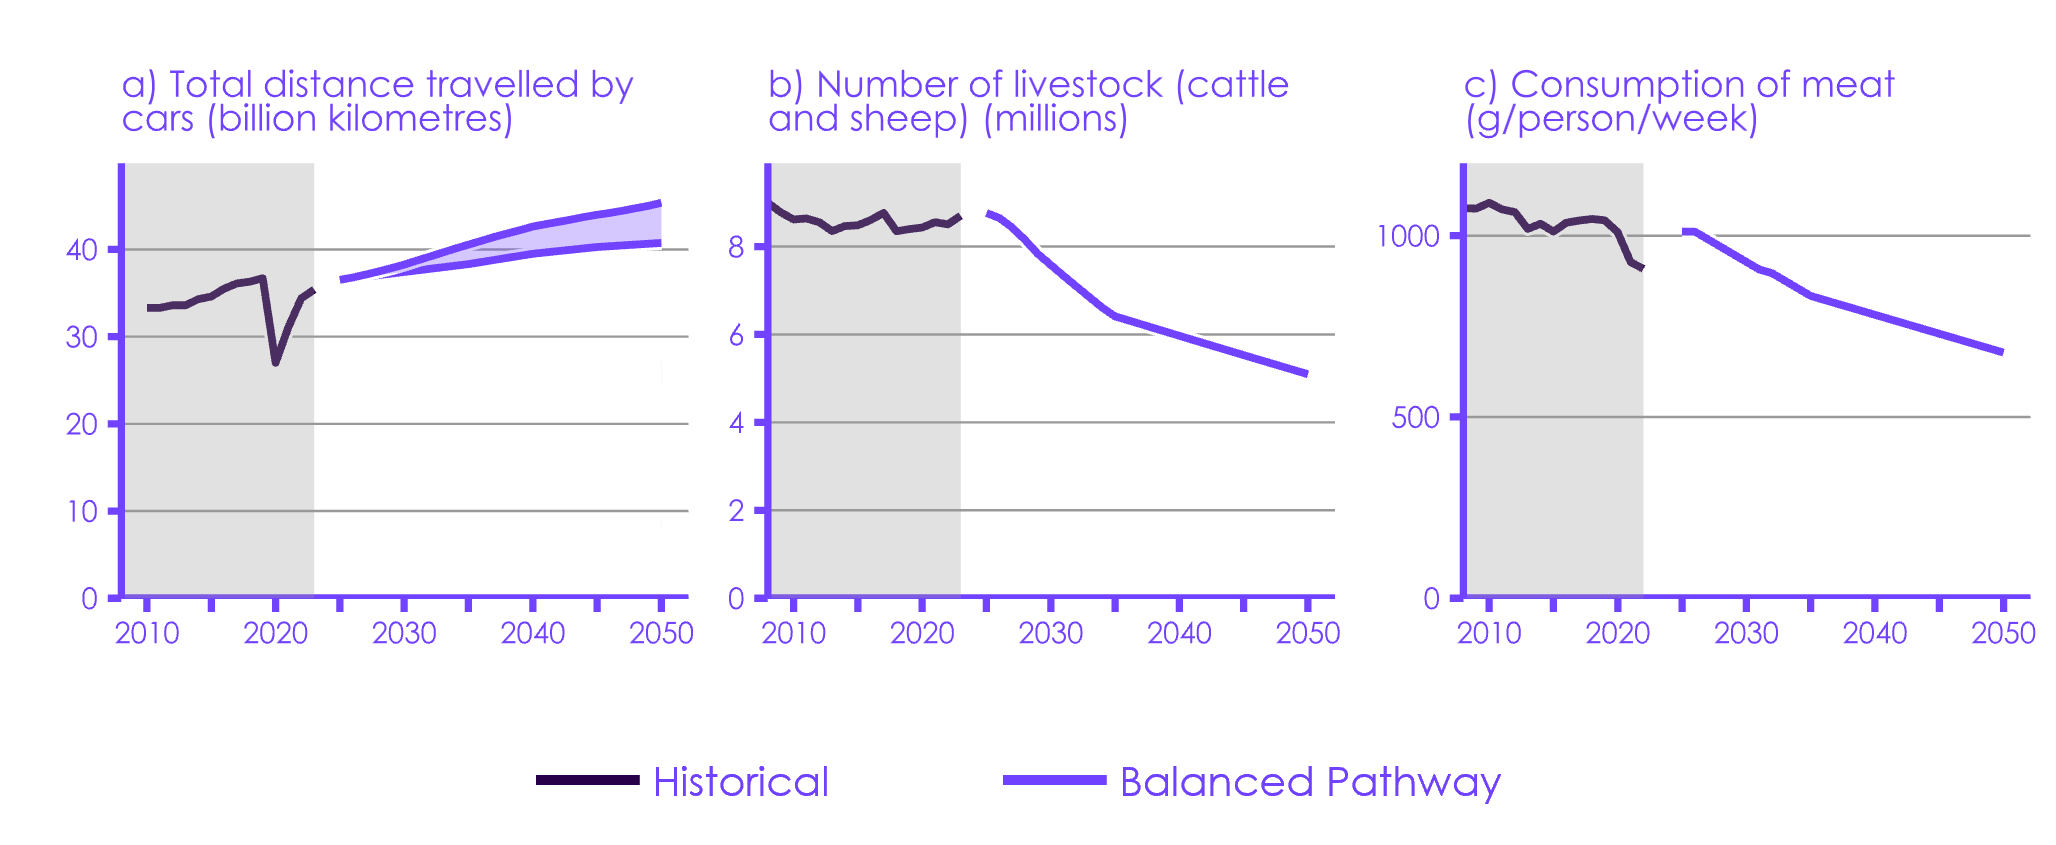 Description: The key indicators of demand for high-carbon activities in our pathway show the distance travelled by cars growing more slowly than historical trends and falling livestock numbers. Source: Historical data from UK Department for Transport, UK Department for Environment, Food and Rural Affairs, and the Scottish Government; CCC analysis. Notes: (a) The range represents the uncertain impact of rebound effects, which could increase driving as a result of the cheaper cost of driving offered by electric vehicles. (b) Livestock numbers at the start of the pathway are higher than the most recent historical year due to a projected increase in sheep numbers in the baseline from 2022. (c) The historical data for meat consumption is for the UK as a whole rather than Scotland. |
3.2.1 Surface transport
Emissions in surface transport
In 2022, surface transport was the highest-emitting sector in Scotland, accounting for 23% of Scotland’s emissions.
Emissions from surface transport have fallen by less than 1% from 9.3 MtCO2e in 1990 to 9.2 MtCO2e in 2022.
- In 2019, before the COVID-19 pandemic, emissions from surface transport were 8% higher than in 1990. This is due to rising vehicle kilometre demand driven by a 7% population increase since 1990 and an additional one million cars on the roads since 1993.[67];[68];[69] There has also been a shift towards larger vehicles which has partially offset efficiency improvements.
- The COVID-19 pandemic caused a 21% drop in emissions during 2020. While emissions have partially rebounded since then, they remain 7% below 2019 levels due to sustained shifts in travel patterns and working from home.
- EVs are becoming more established in Scotland, with around 55,600 electric cars on the roads in Scotland in 2023 making up 2.2% of the car fleet, which is slightly less than the UK average of 2.8%.[70] Electric vans made up 0.8% of the van fleet in 2023.[71];[72]
- Scotland’s network of public chargers grew to around 4,500 in 2023, a 22% increase from 2022.[73];[74]
The Balanced Pathway for surface transport
In our pathway, surface transport emissions fall by 66% from 9.2 MtCO2e in 2022 to 3.1 MtCO2e by 2035 (the midpoint between today and 2045). The emissions pathway for surface transport is summarised in Table 3.2.
| Table 3.2 Emissions in the Balanced Pathway for surface transport |
||||||
| 2025 | 2030 | 2035 | 2040 | 2045 | ||
| Emissions | Emissions in year (MtCO2e) | 8.8 | 6.0 | 3.1 | 1.2 | 0.3 |
| Change in emissions since 1990 | -5% | -35% | -66% | -87% | -97% | |
| Change in emissions since 2022 | -4% | -35% | -66% | -87% | -97% | |
| Share of total Scottish emissions | 22% | 20% | 14% | 8% | ||
| Key drivers – quantity variables | Percentage of electric cars in the fleet* | 5% | 29 % | 60% | 83% | 94% |
| Percentage of electric vans in the fleet* | 2% | 23% | 54% | 77% | 91% | |
| Percentage of electric heavy goods vehicles (HGVs) in the fleet* | 0% | 6% | 31% | 63% | 84% | |
| Modal shift away from cars (car-km)† | 1% | 4% | 6% | 6% | 6% | |
| Source: CCC analysis. Notes: (1) We have blanked out the share of total Scottish emissions in 2045 because total Scottish emissions have reached Net Zero at this point. (2) *Electric vehicle (EV) shares refer to fully electric vehicles only (i.e. excluding hybrids). Our EV uptake modelling is based on the actual distribution of vehicle ages. This means that there are some vehicles that remain in the fleet for a long time, resulting in a small share of petrol and diesel vehicles remaining in 2045. Based on observed data on vehicle mileages by age, these older vehicles are typically expected to drive relatively low annual mileages. (3) †Compared to the baseline. |
||||||
The key measures that combine to reduce emissions from surface transport are:
- Electric cars and vans (52% and 22% respectively of emissions reductions in 2035). By 2035, 60% of cars (Figure 3.4a) and 54% of vans on the road are electric, up from 2.2% and 0.8% respectively in 2023.
- In 2023, the market share of new electric cars in Scotland was 10%, which is below the UK-wide level of 16%.[75] As with our UK Balanced Pathway, our pathway for Scotland sees sales of new electric cars exceed the Zero Emission Vehicle (ZEV) mandate from 2026 at 36% of the market share, reaching 90% by 2030. At a UK level, 94% of new cars will be electric in 2030.
- The pace of EV uptake is driven largely by the decreasing cost of electric cars, which are expected to reach upfront purchase price parity with petrol and diesel cars between 2026 and 2028, depending on vehicle size.
- Sales of new electric vans in Scotland were 4.4% of the market in 2023, which is below the UK-wide level of 6.2%.[76] Our pathway uptake trajectory for new electric vans is slightly behind the ZEV mandate in Scotland until 2028, where they account for 56% of the market. Sales rapidly accelerate thereafter as prices fall, reaching 100% electric by 2030 – in line with the UK Balanced Pathway.
- Cars and vans in Scotland are on average eighteen and eight months younger, respectively than the UK average.[77] This means cars and vans get replaced more quickly, so while the proportion of new vehicles that are electric is behind the UK average, the proportion of vehicles in the fleet that are electric overtakes the UK average from the late 2020s for cars and early 2030s for vans.
- Public EV charge points per capita in Scotland are 7% above the UK average.[78] We estimate 23,000 public chargers will be required by 2030 to meet the increased surface transport electricity demands in our Balanced Pathway. This aligns closely with the Scottish Government’s target to deploy 24,000 chargers by 2030.[79]
- Zero-emission heavy goods vehicles (HGVs) (7% of emissions reductions in 2035). Our pathway assumes battery-electric vehicles are the option chosen to decarbonise all HGVs. However, there is still some uncertainty regarding the exact make-up of technologies in the fleet that will meet requirements for specific long-distance journeys or for particularly heavy cargoes.
- While market development is at an earlier stage for electric HGVs than cars and vans, manufacturers are beginning to launch new models. Roll-out in our pathway scales up from the late-2020s, supported by policies designed to achieve total cost of ownership parity by 2035, resulting in 31% of HGVs on the road being electric by that year.
- The UK Government’s commitment to end sales of new fossil fuel HGVs across the UK by 2040 (2035 for smaller HGVs) sends a strong signal to industry to invest in zero-emission HGVs.[80]
- Scotland faces additional challenges with longer average journey distances and more remote locations with limited infrastructure, requiring solutions that address both range requirements and charging availability in rural areas.
- Modal shift and efficient driving (11% of emissions reductions in 2035). Improvements to make buses and active travel more attractive, affordable, and accessible encourage 6% of baseline car demand (measured in car-kilometres) to switch to public transport and active travel by 2035. While car-kilometres continue to grow from today’s levels, modal shift reduces the growth rate compared to the baseline. The actual reduction depends on potential rebound effects, as EV owners may drive more due to lower operating costs (Figure 3.5a).
- This assumption is informed by evidence on successful public transport and active travel interventions in countries such as Germany and the Netherlands, and in particular towns and cities in England and Scotland, as well as the urban/rural traffic share in Scotland.[81];[82]
- Modal shift for Scotland is slightly lower than the 7% switch to public transport and active travel for the UK as a whole, reflecting Scotland’s more rural traffic distribution.
- The Scottish Government had a commitment to reduce car-kilometres by 20% by 2030 (against a 2019 baseline).[83] In contrast, our Balanced Pathway expects car-kilometres in Scotland to increase by 4% in 2030 compared to 2019. This takes into account the potential rebound effect of people driving EVs more as they are cheaper to drive compared to petrol and diesel models. Car-kilometres in 2023 were only 3.5% lower than 2019 levels (Figure 3.5a), largely due to a structural reduction in demand since the COVID-19 pandemic.[84] We do model a contingency to go further with modal shift (see Section 3.3) than our Balanced Pathway, but this is still not enough to deliver on the Government’s previous target. We understand that the target is now under review.
- We also assume small improvements in average driving efficiency through improved speed limit compliance and eco-driving training for HGV drivers.
- Conventional vehicle efficiency, other zero-emission vehicles and rail decarbonisation (3%, 3%, and 1% of emissions reductions in 2035, respectively).
- While EV sales are growing, it is important to reduce the emissions intensities of conventional vehicles still being sold. This is achieved through fuel efficiency improvements to petrol and diesel vehicles, including measures such as light-weighting and hybridisation. We also assume size distributions of new cars will be maintained at current levels, ending recent trends towards larger vehicles. Our pathway also assumes continued blending of biofuels, with some increase in blending rates of biodiesel, predominantly used in HGVs and vans.
- We assume other vehicles such as buses and coaches also switch to electric alternatives, accounting for 40% of the fleet and over half of all bus and coach kilometres by 2035. Long-distance routes and coaches face similar challenges to HGVs, so electrify more slowly. The Scottish Government established the Scottish Zero Emission Bus Challenge Fund in 2021 to accelerate the transition to zero-emission buses by providing funding to operators and local authorities for both vehicles and infrastructure. This follows the Scottish Ultra-Low Emission Bus Scheme, which supported the introduction of 248 electric buses nationwide through operators such as First Bus Glasgow and McGill’s Bus Service, which operate extensive electric fleets.[85] Scotland has the highest rate of electric coach and bus uptake across the UK. In 2023, 32% of new buses and coaches were electric, compared to 22% across the UK.[86]
- Rail travel is decarbonised by increasing electrification of the network for the most intensively used routes and using hydrogen-powered and battery-electric trains on the remaining routes. While Scotland previously had the ambition to phase out diesel locomotives by 2035, there have been delays to projects to support this, such as the Borders railway decarbonisation programme.[87] The phase-out of diesel locomotives has been pushed back to 2045, five years later than the UK’s target date of 2040.[88];[89]
Key actions to deliver the Balanced Pathway in surface transport
Significant policies in the surface transport sector are devolved, including key enablers of the EV transition such as charging infrastructure as well as devolved responsibilities over roads and public transport. Implementation of the UK-wide ZEV mandate is the most significant policy priority for decarbonising surface transport. The key actions for the Scottish Government are as follows:
- Expand provision of charging infrastructure and provide reliable public information on electric vehicles to support the successful implementation of the ZEV mandate.
- This includes ensuring suitable planning policies, funding models and regulatory frameworks are in place to support the development of charging infrastructure, including on key freight routes and in rural areas.
- The Scottish Government, local councils, and industry also have a role in providing reliable information on the benefits of EVs to help improve public perceptions.[90]
- Improve Scotland’s public transport services and active travel infrastructure through strategic investment in integrated networks, enhanced services, and dedicated walking and cycling routes, supported by long-term funding and powers for local councils.
- Consider further policies and incentives to accelerate zero-emission van uptake, working with major van fleet operators to understand and overcome barriers to uptake such as charging and access to finance.
- Update the Rail Services Decarbonisation Action Plan to reaffirm its commitment to further track electrification and clarify its strategy to phase-out diesel locomotives.
3.2.2 Agriculture and land use
Combined emissions in the agriculture and land use sectors were 8.0 MtCO2e in 2022. This is 46% lower than 1990, when emissions totalled 14.8 MtCO2e.
Emissions in agriculture
In 2022, agriculture was the second highest-emitting sector in Scotland, accounting for 19% of Scotland’s emissions.
Emissions from agriculture have fallen by 12% from 8.8 MtCO2e in 1990 to 7.7 MtCO2e in 2022.
- Livestock emissions from enteric fermentation (the digestive process of cattle and sheep) and waste manure and management have declined by 16% to 4.9 MtCO2e. This is due to the decline observed in cattle and sheep numbers between 1990 and the mid-2010s. Over the last decade, numbers have been relatively stable, with the decline in cattle numbers offset by a slight rise in sheep numbers.[91]
- Soils emissions have decreased by 16% to 1.9 MtCO2e since 1990. Soil emissions associated with nitrogen fertilisers have fallen by 57% but this decrease is offset by increases in emissions from other soil activities.
Emissions from land use
In 2022, land use was the 12th highest-emitting sector in Scotland, accounting for 1% of Scotland’s emissions. However, in some years over the last two decades it has been a net sink.
Emissions from land use have fallen from 6.0 MtCO2e in 1990 to 0.2 MtCO2e in 2022.
- Emissions decreased throughout the 1990s and 2000s, becoming a net sink in 2009. The sector remained a sink until 2014, since when emissions have remained close to zero until 2022.
- The changes are largely driven by the forestry sector, which is currently a sink of
-7.9 MtCO2e. However, the forestry sink in Scotland shows a trend of declining since a peak sink of around -10 MtCO2e was maintained over the late 1990s through to 2013. - Grasslands on mineral soils are also a significant sink in Scotland, at -3.6 MtCO2e in 2022. This has increased since 1990 by around -1.0 MtCO2e and is attributed to existing, established grasslands sequestering CO2.
- The largest source of land use emissions is from peatlands which had emissions of
6.3 MtCO2e in 2022. However, this has decreased by 2.2 MtCO2e since 1990, driven by the expansion of peat restoration activity. - Croplands on mineral soils are also a significant source of emissions at 4.7 MtCO2e in 2022. This has fallen by 1.5 MtCO2e since 1990, indicating fewer grasslands are being converted into arable systems.
The Balanced Pathway for agriculture and land use
By 2035, combined emissions for agriculture and land use are projected to fall by 9% to 7.2 MtCO2e in the Balanced Pathway. This then falls rapidly, with the combined sectors reaching Net Zero by 2045.
This transition will result in significant changes in how land is managed and used in Scotland. It is essential to consider the potential impact across a range of environmental outcomes, including the viability and resilience of land use change under future climate change scenarios. When sited appropriately, measures in the Balanced Pathway can deliver emissions reductions and carbon sequestration alongside benefits for nature and biodiversity by expanding healthy, resilient ecosystems; restoring degraded soils; and supporting sustainable farming practices (Box 3.1).
Agriculture
In our pathway, agriculture emissions fall by 34% from 7.7 MtCO2e in 2022 to 5.1 MtCO2e by 2035. The emissions pathway for agriculture is summarised in Table 3.3.
| Table 3.3 Key values in the Balanced Pathway for agriculture |
||||||
| 2025 | 2030 | 2035 | 2040 | 2045 | ||
| Emissions | Emissions in year (MtCO2e) | 7.6 | 6.3 | 5.1 | 4.7 | 4.4 |
| Change in emissions since 1990 | -14% | -28% | -42% | -47% | -49% | |
| Change in emissions since 2022 | -2% | -18% | -34% | -39% | -42% | |
| Share of total Scottish emissions | 18% | 21% | 24% | 34% | ||
| Key drivers – quantity variables | Change in average meat consumption (versus 2019) | -3% | -11% | -20% | -25% | -30% |
| Changes in cattle and sheep numbers (versus 2023) | 1% | -13% | -26% | -31% | -36% | |
| Change in average crop yield (versus 2022) | 0.5% | 4% | 7% | 10% | 13% | |
| Percentage of low-carbon mobile energy use in the fleet | 0% | 1% | 16% | 36% | 61% | |
| Source: Scotland’s Rural College (2025); CCC analysis. Notes: We have blanked out the share of total Scottish emissions in 2045 because total Scottish emissions have reached Net Zero at this point. |
||||||
The key measures that combine to reduce emissions from agriculture are:
- Low-carbon farming practices and technologies (48% of emissions reductions in 2035). The take-up of on-farm practices and technologies combine to reduce emissions from managing agricultural soils and livestock and from machinery use.
- Soils and livestock measures (25% of emissions reductions in 2035). The 29 measures that we have identified target livestock emissions (for example, feed additives to inhibit methane in cattle; breeding and livestock health measures to reduce emissions intensity; and better management of animal waste), and emissions from soils.
- The largest group of savings are delivered by measures for waste and manure management, livestock feeds and diet, and the reduction of fertiliser use on soils, with each delivering around 6% of the total sector abatement in 2035.
- Decarbonising machinery (23% of emissions reductions in 2035). Energy use emissions decline in line with the fall in livestock numbers and agricultural land area due to the land-release measures cited below. Machinery is electrified except for larger off-road mobile machinery, which switches to hydrogen. Should technology develop, however, then electrification could be used to decarbonise the whole fleet. Bioenergy is used as a transitional fuel but phased out by 2040.
- Soils and livestock measures (25% of emissions reductions in 2035). The 29 measures that we have identified target livestock emissions (for example, feed additives to inhibit methane in cattle; breeding and livestock health measures to reduce emissions intensity; and better management of animal waste), and emissions from soils.
- Reducing livestock numbers (48% of emissions reductions in 2035). Cattle and sheep numbers fall by 26% by 2035 compared to 2023 (Figure 3.5b). This is due to changes in agricultural policy that enable livestock farmers to diversify income streams, a shift in UK-wide consumption towards lower-carbon foods (Figure 3.5c), and improvements in productivity from livestock measures (for example improving livestock health and robotic milking parlours) that reduce methane and nitrous oxide.
- The reduction in meat consumption in our pathway requires going beyond the existing UK long-term trend, which shows a gradual fall in consumption.[92] In recent years, meat purchases have fallen more steeply, with a 10% fall in overall meat consumption between 2020 and 2022. This represents a faster rate of decline than in our pathway (Figure 3.5c).[93] It is too early to tell whether this steeper-than-projected trend will continue in the long term or is a temporary response to the cost-of-living crisis, which saw an 11% decrease in overall UK food purchases by weight between 2020 and 2022.[94]
- Most beef and sheep meat produced in Scotland is exported, with the domestic market accounting for around 29% and 22% of respective sales in 2023.[95] The rest of the UK is the largest market, representing 63% of total beef sales and 58% of total sheep meat sales.
- Four further measures (4% of emissions reductions in 2035). These are sustainable improvements in crop yields, reducing food waste, shifting some horticultural production to indoor systems, and nitrous oxide savings from the restoration and sustainable management of lowland cropland on peat.[96]
Land use
In our pathway, land use emissions initially rise from 0.2 MtCO2e in 2022 to 2.1 MtCO2e by 2035, before falling to -4.9 MtCO2e by 2045. The initial rise in emissions is driven by soil emissions from the establishment of new woodland and the decreasing sink offered by existing woodlands.[97] This is then offset by sequestration as trees in new woodland grow. The emissions pathway for land use is summarised in Table 3.4.
| Table 3.4 Key values in the Balanced Pathway for land use |
||||||
| 2025 | 2030 | 2035 | 2040 | 2045 | ||
| Emissions | Emissions in year (MtCO2e) | 0.8 | 1.6 | 2.1 | 0.7 | -4.9 |
| Change in emissions since 1990 (MtCO2e) | -5.2 | -4.4 | -3.9 | -5.3 | -10.9 | |
| Change in emissions since 2022 (MtCO2e) | +0.6 | +1.4 | +1.9 | +0.4 | -5.1 | |
| Share of total Scottish emissions | 2% | 5% | 10% | 5% | ||
| Key drivers – quantity variables | Total proportion of peat in natural or rewetted condition | 29% | 35% | 45% | 56% | 67% |
| Annual planting rates of new woodland (thousand hectares)* | 8 | 16 | 21 | 22 | 22 | |
| Proportion of Scottish land under woodland | 19% | 20% | 21% | 22% | 23% | |
| Annual energy crop planting rates (thousand hectares) | 0 | 3 | 7 | 8 | 8 | |
| Proportion of Scottish land under energy crops | 0.0% | 0.1% | 0.5% | 0.9% | 1.4% | |
| Area of agricultural land converted to agroforestry (thousand hectares)† | 3 | 16 | 29 | 42 | 55 | |
| Proportion of Scottish land under agroforestry | 0.03% | 0.2% | 0.4% | 0.5% | 0.7% | |
| Length of hedgerows (thousand kilometres)‡ | 43 | 46 | 48 | 50 | 52 | |
| Source: UK Centre for Ecology and Hydrology (2025); CCC analysis. Notes: (1) We have blanked out the share of total Scottish emissions in 2045 because total Scottish emissions have reached Net Zero at this point. (2) For this sector, we show absolute changes in emissions as opposed to percentage changes because the land use sector is a combination of sources and sinks which can vary between positive and negative. (3) *Area includes area of open ground required for biodiversity and to be compliant with the UK Forestry Standard. This does not include the areas associated with agroforestry and short-rotation forestry. (4) †Land under agroforestry tree cover. (5) ‡Includes length associated with managed and unmanaged hedgerows. |
||||||
The key measures that combine to reduce emissions from land use are:
- Peatland restoration and management (75% of emissions reductions in 2035, 55% in 2045). The rewetting and restoration of degraded peatlands offers the largest share of emissions reductions, reaching 1.1 MtCO2e in 2035 and increasing to 2.7 MtCO2e by 2045. This is largely due to restoration activities on peatlands in the uplands that are degraded from drainage of the organic soils and grazing pressure.
- In 2018, the Scottish Government set out an ambition to achieve 250,000 hectares of peat restoration by 2030.[98] Though annual peat restoration rates have increased, delivery has proved challenging with target annual rates yet to be met.[99] In the Balanced Pathway, the proportion of peat under restoration and rewetting management increases from the current 29% to 45% in 2035, and to 67% by 2045 (Figure 3.4b). If achieved, this equates to 153,000 hectares of peatland being rewetted over the same period as the ambition set by the Scottish Government.
- Restoration of peatlands can offer opportunities for business diversification, via carbon and nature conservation schemes as well as providing wider societal benefits such as for adaptation, biodiversity, and water quality. In some cases, grazing can continue at seasonally appropriate levels alongside restoration, meaning the land remains under agricultural management.[100]
- Woodland creation and management (22% of emissions reductions in 2035, 28% in 2045). There is a delay between the planting of woodlands and the time it takes for them to reach peak sequestration rates as trees reach maturity. The sink provided by the forestry subsector in Scotland initially falls to a low of -4.4 MtCO2e in 2038 as soil emissions from new planting offsets sequestration by young trees and existing woodland. As new woodlands are established and grow, this rapidly increases through the 2040s, reaching -8.8 MtCO2e in 2045.
- The Scottish Government has committed to increase forest and woodland cover to 21% by 2032 in Scotland’s Forestry Strategy.[101] In the Balanced Pathway, woodland creation rates rise from around 10,480 hectares/year in 2022 to reach peak rates of 22,000 hectares/year by 2036. The proportion of woodland cover rises from the current 19% to 21% in 2035, three years later than the target set by the Scottish Government, and 23% by 2045 (Figure 3.4c).[102]
- Energy crops (6% of emissions reductions in 2035, 12% in 2045). The use of perennial crops of miscanthus, short-rotation coppice, and short-rotation forestry, as an energy source, combined with carbon capture and storage (CCS), can support emissions removal (see Section 3.2.12). Planting of these crops also sequesters carbon retained on-site, which is accounted here. Current rates of planting are unknown for Scotland. Establishment rates rise from 2027, reaching annual rates of 7,800 hectares in 2037, which are then maintained.[103]
- Agroforestry and hedgerows (0% of emissions reductions in 2035, 4% in 2045). Increasing trees and hedges on farms supports continued food production alongside sequestration in vegetation and soils. These actions provide 0.2 MtCO2e of emissions reductions by 2045. We assume the transition to agroforestry rises annually by 2,600 hectares, and the extent of hedgerows increases by 19% by 2045.
| Box 3.1 Wider considerations of our Balanced Pathway |
|
Measures in the Balanced Pathway can deliver emissions reductions and carbon sequestration alongside benefits for nature by expanding healthy, resilient ecosystems; support farmers and land managers to adapt to future climate change; and support a more resilient agricultural system:
|
Key actions to deliver the Balanced Pathway in agriculture and land use
Policy in the agriculture and land use sectors is largely devolved. The key actions for the Scottish Government are:
- Provide incentives and address barriers for farmers and land and estate managers to diversify land use and management at a range of scales into woodland creation, peatland restoration, agroforestry, and renewable energy. These policies need to support and empower rural communities to deliver these changes.
- Ensure that funding and incentives are set at the correct level to deliver the scale-up in tree planting that is needed this decade.
- Provide long-term certainty on public funding for farming practices and technologies to reduce emissions from managing crops and livestock. As part of this, ensure low-regret and low-cost measures are taken up through baseline regulations or minimum requirements in the new agricultural support mechanisms (for example, actions to deliver resource protection, enhance nature, and build resilience), especially when they can deliver efficiency improvements.
- Support a shift in average meat and dairy consumption towards lower-carbon foods. The most promising levers include replacing a small amount of meat and dairy content in pre-prepared meals with plant whole foods or alternative proteins; increasing choice and availability of lower-carbon foods in public procurement, restaurants, and supermarkets; and supporting novel alternative proteins with improved taste and texture.
3.2.3 Industry
Emissions in industry
In 2022, industry was the third highest-emitting sector in Scotland, accounting for 13% of Scotland’s emissions.
Emissions from industry have fallen by 57% from 12.6 MtCO2e in 1990 to 5.4 MtCO2e in 2022.
- The largest contributors to industrial emissions in 2022 were chemicals (2.1 MtCO2e) and ‘other industry’ (1.8 MtCO2e).[106] Together these subsectors cause 71% of the sector’s emissions.
- Over half the emissions in the chemicals subsector in 2022 were from two ethylene plants in Fife and Grangemouth. Grangemouth has historically hosted a range of chemical facilities but two of these (Versalis’ rubber plant and Ineos’ ethanol plant) have closed since 2022 which is not reflected in the latest emissions data. Petroineos also closed its oil refinery at the site this year. The context of this closure is discussed in Box 4.2.
- The closure of the Ravenscraig steelworks in 1992 is the single biggest reduction in industrial emissions since 1990. Scotland has also seen the closure of many paper mills since 1990, most recently Stoneywood mill in Aberdeen in 2022. These closures occurred as businesses became uncompetitive due to a range of factors such as declining demand and rising costs – including higher gas prices in recent years.
- There has been a structural shift since the 1990s towards less energy-intensive, higher-value industrial output. The gross value added (GVA) of Scottish manufacturing increased by 52% between 1998 and 2022. Over one-third of this growth was from the drinks industry.
- The energy-intensive industries, such as cement, chemicals, and metals, comprise a small share of Scotland’s GVA but are important to local economies and employment. These industries are mostly grouped across the Scottish Cluster and will decarbonise with CCS or alternative fuels.
The Balanced Pathway for industry
In our pathway, industry emissions fall by 51% from 5.4 MtCO2e in 2022 to 2.6 MtCO2e by 2035. This reduction is achieved by decarbonising industry and not assuming further large reductions in the output of energy-intensive sectors, which increases by about 1% per year to 2045 in our pathway, based on UK Government assumptions.
The emissions pathway for industry is summarised in Table 3.5.
| Table 3.5 Emissions in the Balanced Pathway for industry |
||||||
| 2025 | 2030 | 2035 | 2040 | 2045 | ||
| Emissions | Emissions in year (MtCO2e) | 4.9 | 3.7 | 2.6 | 1.5 | 0.8 |
| Change in emissions since 1990 | -61% | -70% | -79% | -88% | -93% | |
| Change in emissions since 2022 | -8% | -30% | -51% | -72% | -85% | |
| Share of total Scottish emissions | 12% | 12% | 12% | 11% | ||
| Key drivers – quantity variables | Total industrial energy use (TWh) | 30.3 | 24.8 | 19.4 | 16.7 | 14.1 |
| Percentage of industrial energy use supplied by electricity | 15% | 20% | 31% | 46% | 58% | |
| Percentage of industrial energy use supplied by hydrogen | 0% | 0% | 2% | 7% | 13% | |
| Source: CCC analysis. Notes: We have blanked out the share of total Scottish emissions in 2045 because total Scottish emissions have reached Net Zero at this point. |
||||||
The key measures that combine to reduce emissions from industry are:
- Electrification (61% of emissions reductions in 2035). This is the most important measure in our industry pathway and relates to more extensive use of electricity for heat processes.
- There is growing recognition that electrification of heat should be the main route to decarbonising industry.[107] There are electric alternatives to most types of fossil fuel-fired heating equipment used in industry.
- The proportion of industrial energy supplied by electricity rises from 15% in 2025 to 31% by 2035 (Figure 3.4d).
- In Scotland, the largest source of abatement from electrification is through adoption of electric steam crackers by the chemicals sector.
- Resource efficiency and energy efficiency (16% of emissions reductions in 2035). Using materials and energy more efficiently reduces operating costs while cutting emissions. Demand for materials can be reduced by material switching, reducing consumption, and producing goods with fewer material inputs. The largest single source of abatement in this category is through reduced demand for cement.
- Carbon capture and storage (14% of emissions reductions in 2035). CCS is needed for abating industrial process emissions. It starts to be adopted in our pathway in 2030, when we assume the Scottish Cluster begins operating. By 2035, most abatement from CCS is in the chemicals sector, though by 2038 it is equally important for the cement industry.
- Fuel switching (hydrogen (5%); bioenergy (4%); of emissions reductions in 2035). Most gas-fired industrial processes could in principle be converted to run on either bioenergy or hydrogen, though this has a limited role in our pathway. Hydrogen use continues growing to 2045, when it delivers 10% of emissions reductions. Its biggest role is in the chemicals sector, but the extent of future use is highly dependent on investment decisions at Scotland’s two large chemical plants at Grangemouth (see Section 4.2.2) and Fife. In 2035, bioenergy is most used in the ‘other industry’, food and drink, and non-road mobile machinery subsectors. However, from 2038 onwards, its main use is in the cement sector, where it combines with CCS to deliver CO2 removals.
Key actions to deliver the Balanced Pathway in industry
Policies to decarbonise the industry sector are largely reserved. The key actions for the Scottish Government are as follows:
- Continue to work with the UK Government to support the development of plans to develop carbon capture and storage (CCS) and hydrogen in the Scottish Cluster and work with the UK Government to develop new low-carbon industrial opportunities, such as those identified by Project Willow for Grangemouth (see Section 4.2.2).[108]
- Work with communities, workers, and businesses to develop proactive transition plans that enable access to secure employment and business opportunities that come with the Net Zero transition.
- Work with the UK Government to enable industrial decarbonisation in Scotland, including by speeding up grid connections and planning processes.
- Define the skills and workforce requirements for low-carbon manufacturing in Scotland and develop policies to deliver them.
- Ensure businesses have access to appropriate information and support to reduce their emissions.
3.2.4 Residential buildings
Emissions in residential buildings
In 2022, residential buildings was the fourth highest-emitting sector in Scotland, accounting for 12% of Scotland’s emissions.
Emissions from residential buildings have fallen by 39% from 8.0 MtCO2e in 1990 to 4.9 MtCO2e in 2022.
- Policies have helped to improve the efficiency of heating technologies and deliver investments in building fabric efficiency.[109];[110]
- Emissions have fallen since 2021, driven by high energy prices and mild winters.
- The majority of homes (88%) in Scotland are still heated using fossil fuels.[111]
The Balanced Pathway for residential buildings
In our pathway, residential buildings emissions fall by 33% from 4.9 MtCO2e in 2022 to 3.3 MtCO2e by 2035. The emissions pathway for residential buildings is summarised in Table 3.6. Due to the fall in emissions from high energy prices since 2021 and the expectation that some of this reduction will be short term, emission reductions to 2030 are small.
| Table 3.6 Emissions in the Balanced Pathway for residential buildings |
||||||
| 2025 | 2030 | 2035 | 2040 | 2045 | ||
| Emissions | Emissions in year (MtCO2e) | 5.4 | 4.8 | 3.3 | 1.6 | 0.4 |
| Change in emissions since 1990 | -32% | -40% | -59% | -79% | -95% | |
| Change in emissions since 2022* | +10% | -2% | -33% | -66% | -92% | |
| Share of total Scottish emissions | 13% | 16% | 15% | 12% | ||
| Key drivers – quantity variables | Proportion of homes with a heat pump | <1% | 5% | 23% | 48% | 69% |
| Proportion of homes with a low-carbon electrified heating system | 10% | 17% | 40% | 69% | 92% | |
| Deployment of ‘big’ energy efficiency measures (cumulative, millions)† | <0.01 | 0.23 | 0.26 | 0.26 | 0.26 | |
| Deployment of ‘small’ energy efficiency measures (cumulative, millions)‡ | 0.06 | 1.2 | 2.8 | 2.9 | 2.9 | |
| Source: CCC analysis. Notes: (1) We have blanked out the share of total Scottish emissions in 2045 because total Scottish emissions have reached Net Zero at this point. (2) *Emissions in 2022 were lower than expected due to a warmer-than-average year and high energy prices. (3) †’Big’ energy efficiency measures include loft insulation, wall insulation, and floor insulation. (4) ‡’Small’ energy efficiency measures include a variety of low-cost measures, including draught-proofing and hot water tank insulation. |
||||||
The key measures that combine to reduce emissions in residential buildings are:
- Low-carbon heating (54% of emissions reductions in 2035). Low-carbon heating is installed in 92% of homes by 2045, and all homes by 2050. Our pathway does not meet the Scottish Government’s proposed target in the Heat in Buildings Bill for heating systems to be decarbonised by 2045, which was announced after our analysis was completed. Urgent action is needed to ramp up low-carbon heat installations to meet this zero emissions target, given it is only 20 years away and the average gas boiler lifetime is 15 years. In our pathway, low-carbon heating is all electric with no role for hydrogen in home heating. Heat pumps will play a key role, primarily as standalone systems, but also within communal systems, and it is essential that their deployment accelerates rapidly.
- In our pathway, the share of existing homes with low-carbon heating reaches 40% by 2035:
- 23% of all existing homes are heated by either a communal or individual heat pump (Figure 3.4e).
- 5% of all existing homes are connected to a heat network.
- 11% of all existing homes are heated using direct electric systems. The majority of these heating systems are already in place.
- Annual heat pump installations in existing homes in Scotland increase rapidly from 2025, reaching nearly 35,000 in 2030, and over 120,000 by 2035, equivalent to the natural heating system replacement rate for the homes getting a heat pump. In our pathway, installation rates do not exceed natural replacement cycles – the replacement of a heating system at the end of its life.
- Tenement buildings can be challenging to decarbonise, both due to their traditional construction and the difficulties relating to works requiring coordination among multiple owners. Decarbonising Scotland’s housing stock may include use of communal, high temperature heat pumps to address these challenges.
- Most homes in Scotland, including tenements, benefit from small insulation measures, such as draught-proofing, in our pathway.
- In our pathway, Scotland has higher potential for heat networks than the rest of the UK, offering an additional potential solution for tenement buildings.
- Some early heating system replacements may be required in the case of switching individual heating systems to communal systems, as individual systems in different properties in the same building may have differing remaining lifetimes.
- Scotland, and the UK in general, is significantly behind on heat pump installations compared to other European countries. Our assumed compound annual growth rate for heat pump deployment is based on the rate of scale-up observed across a range of other European countries with comparable markets, including the Netherlands and Ireland.
- In our pathway, the share of existing homes with low-carbon heating reaches 40% by 2035:
- Energy efficiency (14% of emissions reductions in 2035). Energy efficiency measures include draught-proofing, loft insulation, floor insulation, and insulation for cavity and solid walls. These measures reduce heating energy demand by reducing the rate of heat loss.
- Energy efficiency improvements are deployed alongside or ahead of low-carbon heating as the deployment constraints are less restrictive, and this ensures that heating systems can be appropriately sized. Energy efficiency therefore accounts for a larger proportion of emissions reductions in the early years of the pathway.
- New homes, lighting, electrical appliances, other household appliances, and energy-saving practices (32% of emissions reductions in 2035).
- Our pathway assumes that all new homes are highly efficient and have low-carbon heating systems from 2025. Scotland introduced the New Build Heat Standard into law in 2024, effectively prohibiting fossil fuel heating systems in new homes as required.
- Our pathway assumes that all domestic energy-using products are decarbonised and/or replaced with more efficient equivalents by 2050.
- Our pathway assumes that some of the recent emissions reductions were due to behaviours that will be maintained into the future, such as reducing boiler flow temperatures, adjusting thermostats, and other steps to reduce energy bills.
Key actions to deliver the Balanced Pathway in residential buildings
Policy in the residential buildings sector is substantially devolved, including planning and building regulations; energy efficiency and low-carbon heating schemes; and policy to address fuel poverty.
It has been 18 months since the Scottish Government initially consulted on the Heat in Buildings Bill, which the Committee described in our 2023 report on Progress in reducing emissions in Scotland as a potential template for other parts of the UK. It is therefore disappointing that the proposals for regulations to upgrade properties at the point of sale have been abandoned, with, as yet, no specific alternative measures to deliver the target for heating to be zero emissions by 2045.[112];[113]
The Committee recognises the importance of addressing fuel poverty, and concerns around electricity prices need to be addressed by the UK Government. However, policies need to be put in place to meet the 2045 target, and can be designed to support fuel poor homes in the transition.
The key actions for the Scottish Government are as follows:
- Urgently consult on and implement measures to enable a rapid transition from fossil fuel heating systems to low-carbon heating in privately owned homes. This should include appropriate consideration of levers and incentives for homeowners, including a combination of regulations and financial support.
- Urgently consult on the details of the proposal to set minimum energy efficiency standards for privately owned homes, noting that delaying this further could have negative impacts on fuel poverty in Scotland.
- Urgently consult on and implement measures to enable a rapid transition from fossil-fuel heating systems to low-carbon heating in privately owned homes.
- Develop appropriate governance frameworks to coordinate residents in buildings containing multiple residential dwellings (in particular, tenements) to allow for the installation of communal low-carbon heating systems, where these are appropriate.
3.2.5 Fuel supply
Emissions in fuel supply
In 2022, fuel supply was the fifth highest-emitting sector in Scotland, accounting for 8% of Scotland’s emissions.
Emissions from fuel supply have fallen by 50% from 6.6 MtCO2e in 1990 to 3.3 MtCO2e in 2022.
- Oil refining contributed to nearly half of emissions, emitting 1.6 MtCO2e in 2022. These emissions have fallen by 45% between 1990 and 2022, as output from Grangemouth, Scotland’s main oil refinery, reduced. In 2022, Grangemouth emitted 0.8 MtCO2e.
- Oil and gas production and processing emissions contributed 44% of emissions in 2022, the majority of which was from processing terminals (1.2 MtCO2e). These have fallen by 32% since 1990, driven in part by a reduction in flaring and venting which is currently at its lowest level and two-thirds below its peak in 2001.[114]
- Emissions from coal extraction have fallen 92% between 1990 and 2022, emitting only 0.1 MtCO2e in 2022. The last deep coal mine in Scotland, at Longannet in Fife, closed in 2002, lowering methane emissions by a quarter. The remaining emissions in 2022 are leakage from closed coal mines.
The Balanced Pathway for fuel supply
In our pathway, fuel supply emissions fall by 83% from 3.3 MtCO2e in 2022 to 0.6 MtCO2e in 2035. Emissions reductions come from decarbonising existing fossil fuel production, falling demand for oil and gas across the economy, and a decline in extraction from the North Sea basin. The emissions pathway for fuel supply is summarised in Table 3.7.
| Table 3.7 Emissions in the Balanced Pathway for fuel supply |
||||||
| 2025 | 2030 | 2035 | 2040 | 2045 | ||
| Emissions | Emissions in year (MtCO2e) | 3.0 | 1.1 | 0.6 | 0.4 | 0.1 |
| Change in emissions since 1990 | -55% | -83% | -91% | -93% | -99% | |
| Change in emissions since 2022 | -11% | -66% | -83% | -87% | -97% | |
| Share of total Scottish emissions | 7% | 4% | 3% | 3% | ||
| Key drivers – quantity variables | Low-carbon hydrogen production: electrolysis (TWh) | 0.0 | 0.1 | 2.5 | 14 | 15 |
| Electrolyser capacity (GW) | 0.0 | 0.02 | 0.6 | 3.3 | 3.9 | |
| Source: CCC analysis. Notes: We have blanked out the share of total Scottish emissions in 2045 because total Scottish emissions have reached Net Zero at this point. |
||||||
Our modelled UK baseline reflects that the North Sea is a mature and declining production basin. North Sea oil and gas production declined by 69% between its near peak in 2000 and 2022 and is projected by the North Sea Transition Authority (NSTA) to fall a further three-quarters by 2040, even including the new oil and gas fields with licences.[115]
From the baseline, first we account for significant changes across the economy that would affect demand. Decreased use of oil, largely due to the uptake of EVs in surface transport, leads to reductions in demand for oil refineries, which reduces remaining UK refining production.
- Fuel switching (56% of emissions reductions in 2035). This is the largest contributor to reducing emissions in the fuel supply pathway, abating 0.9 MtCO2e in 2035 relative to the baseline.
- Where oil demand in Scotland remains even as extraction declines, activity (and associated emissions) will continue to be needed to the extent crude oil is imported and still requires UK refining.
- Regardless of the Net Zero transition, North Sea production will continue to decline, creating a requirement for new sources of well-paid employment. The Net Zero transition presents opportunities in low-carbon offshore industries, electricity network development and onshore wind (see Box 4.1). The Grangemouth refinery closed in 2025 and the UK and Scottish governments are developing plans to secure its industrial future and protect its skilled workforce (see Box 4.2).
The key measures that combine to reduce emissions from fossil fuel production are:
- Electrification (22% of emissions reductions in 2035). In our UK-wide analysis, generators and compressors are electrified on around 70% of existing offshore oil and gas platforms and terminals in the North Sea.
- Reduced methane leakage (15% of emissions reductions in 2035). Gas leaks from the gas network are reduced by applying leakage detection measures.
- Reduced methane flaring and venting (6% of emissions reductions in 2035). Reducing routine flaring and venting in fossil fuel production abates 0.1 MtCO2e in 2035.
For low-carbon fuel production, we use a mix of in-house modelling and hourly optimised electricity system modelling to determine the level of bioenergy, hydrogen, and synthetic fuel supply required to meet cross-economy sector demands. There are small initial deployments of low-carbon fuels by 2035, but their roles increase later in the pathway to 2045.
- Bioenergy: In 2035, 8.4 TWh of bioenergy resource is available in Scotland, from a mix of biomass sources and bio-wastes.
- Low-carbon hydrogen: 2.7 TWh of hydrogen is available in Scotland in 2035, linked to a
GB-wide network via pipeline transmission. Capacity reaches 0.9 GW by 2035 and is predominantly produced via electrolysis (93%) in periods where zero-carbon electricity generation is surplus to demand requirements. The rest is produced by either methane reformation with CCS (5%) or biomass gasification with CCS (2%). - Synthetic fuels: Defined as fuels produced using hydrogen and a source of CO2 recovered from the atmosphere (via direct air capture). They are liquid hydrocarbons that can directly replace fossil fuels in jet engines and shipping vessels.
- International emissions accounting rules for synthetic fuels are currently unclear.[116] They could require emissions savings for captured carbon to be counted in the country where the capture takes place. This would mean emissions savings from synthetic fuels are counted in the producing country, not the place of fuel combustion (this does not apply to other low-carbon fuels that are not based on captured carbon, including biofuels and hydrogen).
- In line with our UK Balanced Pathway, we have assumed that all synthetic fuel used in Scotland is produced domestically to meet demand, enabling the emissions savings to contribute to Scottish emissions reductions.
Use of low-carbon fuels varies by sector and delivers benefits of CO2 removals from fuel production combined with carbon capture and storage:
- In 2035, 0.4 MtCO2 of removals is achieved via bioenergy with carbon capture and storage (BECCS) across industry (specifically cement and chemicals), waste (energy from waste), and fuel supply (including aviation biofuels, hydrogen, biomethane, and bio-liquefied petroleum gas). Biofuels are used to displace some fossil fuels used in surface transport (electrification displaces the rest) and aviation, and some biomethane is used in the gas grid.
- In 2035, 1.6 TWh of hydrogen is demanded in Scotland for use primarily in industrial and agricultural machinery and rail (47%), to produce synthetic fuels (24%), in industrial processes in chemical and glass manufacturing (20%), and in energy from waste facilities (9%).
- In line with the sustainable aviation fuel pathway in our UK-wide Seventh Carbon Budget advice, a mix of bio-based and synthetic jet fuels meet 12% of fuel demand for Scottish flights in 2035.
Key actions to deliver the Balanced Pathway in fuel supply
Policy in the fuel supply sector is largely reserved. The key actions for the Scottish Government are as follows:
- Continue to work with the UK Government to support the development of plans to develop carbon capture and storage (CCS) and hydrogen in the Scottish Cluster and work with the UK Government to develop new low-carbon industrial opportunities, such as those identified by Project Willow for Grangemouth.
- Work with communities, workers, and businesses to develop proactive transition plans that enable access to secure employment and business opportunities that come with the Net Zero transition.
- The North Sea Transition Authority should continue to work in close collaboration with Crown Estate Scotland and the Scottish Government to help manage declining production in the North Sea as the basin matures. This should include implementing the requirements set out in the OGA Plan and decommissioning offshore assets.[117];[118];[119]
- Publish its sectoral marine plan for offshore wind energy in 2025, incorporating the innovation and targeted oil and gas decarbonisation plan and work to implement the requirement by 2030 that all new oil and gas platforms come online electrification ready.[120];[121];[122]
3.2.6 Non-residential buildings
Emissions in non-residential buildings
In 2022, non-residential buildings was the sixth highest-emitting sector in Scotland, accounting for 5% of Scotland’s emissions.
Emissions from non-residential buildings have fallen by 31% from 3.2 MtCO2e in 1990 to 2.2 MtCO2e in 2022.
- This decrease has been driven by a 53% reduction in public sector emissions, with the majority of reductions occurring between 1990 and 2009. Significant emissions reductions have been made across a range of public bodies including the NHS, Scottish Government core estate and local authorities. Since 2011, Scotland’s public bodies have been legally required to reduce emissions.[123]
- Commercial emissions have increased 15% over the period. Growth in the commercial sector has more than offset decarbonisation actions.[124]
The Balanced Pathway for non-residential buildings
In our pathway, non-residential buildings emissions fall by 72% from 2.2 MtCO2e in 2022 to
0.6 MtCO2e by 2035. The emissions pathway for non-residential buildings is summarised in Table 3.8.
| Table 3.8 Emissions in the Balanced Pathway for non-residential buildings |
||||||
| 2025 | 2030 | 2035 | 2040 | 2045 | ||
| Emissions | Emissions in year (MtCO2e) | 2.2 | 1.5 | 0.6 | 0.3 | 0.1 |
| Change in emissions since 1990 | -31% | -53% | -81% | -91% | -96% | |
| Change in emissions since 2022* | 0% | -32% | -72% | -87% | -94% | |
| Share of total Scottish emissions | 5% | 5% | 3% | 2% | ||
| Key drivers – quantity variables | Share of commercial heat that is delivered by low carbon technology† | 31% | 38% | 67% | 81% | 100% |
| Share of public sector heat that is delivered by low carbon technology | 3% | 24% | 73% | 93% | 100% | |
| Energy savings due to additional energy efficiency (TWh) | 0.2 | 3.4 | 5.0 | 5.2 | 5.4 | |
| Source: CCC analysis. Notes: (1)We have blanked out the share of total Scottish emissions in 2045 because total Scottish emissions have reached Net Zero at this point. (2) *Emissions in 2022 were lower than expected due to a warmer-than-average year and high energy prices. (3) †The share of heat delivered by low-carbon technology includes heat pumps, low-carbon heat networks, electric resistive heating, and biomass boilers. |
||||||
The key measures that combine to reduce emissions from non-residential buildings are:
- Low-carbon heating (45% of emissions reductions in 2035). Current heating systems are replaced by low-carbon alternatives. Most heating is delivered by efficient heat pumps, whether this be through a district heat network or individual systems.
- Energy efficiency (42% of emissions reductions in 2035). Deployment of a wide range of measures saves 32% of energy use in public buildings and 23% in commercial buildings.
- Electrification of catering and other non-heat fossil fuel uses (11% of emissions reductions in 2035). Other uses of fossil fuels are electrified.
- Anaesthetics (1% of emissions reductions in 2035). Our pathway includes a 40% reduction in nitrous oxide emissions from anaesthetics used in healthcare by 2032 compared to levels in 2019/20, through the use of waste reduction measures.
Key actions to deliver the Balanced Pathway in non-residential buildings
Policy in the non-residential buildings sector is partly devolved. The key actions for the Scottish Government are as follows:
- Introduce a comprehensive multi-year programme for decarbonisation of public sector buildings. This should set out strategic plans for when best to take the required decarbonisation actions in buildings across the public estate and should be supported by long-term capital settlements.
- Develop and implement an engagement strategy to provide clear information to businesses about their role in decarbonising non-residential buildings.
- Consult on the details of the proposed powers required for local authorities and Scottish Ministers to require non-residential buildings within a Heat Network Zone to end their use of polluting heating systems by a certain date, and with a minimum notice period. Include requirements on developers to connect new buildings with Heat Network Zones to a heat network.
3.2.7 Shipping
Emissions in shipping
In 2022, shipping was the seventh highest-emitting sector in Scotland, accounting for 5% of Scotland’s emissions. Emissions have started to rebound since the COVID-19 pandemic, but are still 18% lower than in 2019.
- Emissions from shipping have fallen by 53% from 4.2 MtCO2e in 1990 to 2.0 MtCO2e in 2022.
- Emissions from domestic shipping have decreased by 49% between 1990 and 2022.
- Emissions from international shipping have decreased by 65% between 1990 and 2022.
- Emissions from naval shipping have decreased by 73% between 1990 and 2022.
The Balanced Pathway for shipping
In our pathway, shipping emissions fall by 48% from 3.0 MtCO2e in 2022 to 1.6 MtCO2e by 2035.[125] The emissions pathway for shipping is summarised in Table 3.9.
| Table 3.9 Emissions in the Balanced Pathway for shipping |
||||||
| 2025 | 2030 | 2035 | 2040 | 2045 | ||
| Emissions | Emissions in year (MtCO2e) | 3.0 | 2.1 | 1.6 | 1.1 | 0.4 |
| Change in emissions since 2022 (using the UK Department for Transport’s model, as in the pathway)* | 0% | -30% | -48% | -65% | -87% | |
| Change in emissions since 2022 (using the greenhouse gas inventory for 2022)† | +54% | +8% | -20% | -46% | -80% | |
| Share of total Scottish emissions | 7% | 7% | 7% | 8% | ||
| Key drivers | Proportion of energy use that is low carbon | 0% | 5% | 21% | 47% | 78% |
| Source: UK Department for Transport; CCC analysis. Notes: (1) We have blanked out the share of total Scottish emissions in 2045 because total Scottish emissions have reached Net Zero at this point. (2) *The table shows changes from current emissions on two bases – first compared to 2022 emissions as estimated using DfT’s emissions model, which we use as the basis for our modelled pathway (other than for naval shipping and inland waterways and leisure shipping), and second compared to 2022 emissions as reported in the greenhouse gas inventory. (3) †When comparing the modelled pathway against inventory emissions estimates, emissions initially increase as a result of the accounting differences. |
||||||
The key measures that combine to reduce emissions from shipping are:
- Fuel switching (38% of emissions reductions in 2035). Existing and new ships take up engines and other propulsion systems capable of running on low-carbon fuels and electricity. The rate at which ships switch to these fuels is determined by the pace at which the technologies and fuels become available and cost-effective, as well as the impact of assumed fuel standard regulations.
- Low-carbon fuels and electricity make up 21% of total energy use in shipping in 2035. Our pathway includes a variety of fuels, all of which are likely to play a role in decarbonising shipping.
- The fuels used most in our pathway are low-carbon ammonia and synthetic fuels (produced by combining low-carbon hydrogen with CO2 from direct air capture).
- Efficiency improvements (62% of emissions reductions in 2035). This measure consists of a variety of technological and operational measures that improve the energy efficiency of a ship, such as wind assistance, propeller ducts, rudder bulbs, and speed optimisation.
Key actions to deliver the Balanced Pathway in shipping
Policy in the shipping sector is partially reserved, except for ports, harbours, inland waterways, and ferries. The key actions for the Scottish Government are as follows:
- Work closely with the UK Government to support uptake of low-carbon engines and fuels on vessels, and adoption of efficiency improving measures.
- Develop policies to reduce emissions at berth and ensure there are infrastructure and incentives in place to reduce emissions on inland waterways.
3.2.8 Waste
Emissions in waste
In 2022, waste was the eighth highest-emitting sector in Scotland, accounting for 5% of Scotland’s emissions.
Emissions from waste have fallen by 70% from 6.5 MtCO2e in 1990 to 1.9 MtCO2e in 2022.
- The main cause of this fall is a decrease in waste sent to landfill, driven by the Landfill Tax, which helped drive a reduction in waste generated and an increase in recycling rates.[126];[127]
- Emissions from energy from waste (EfW) have increased rapidly in the last 10 years and are still on the rise. Emissions from EfW in 2022 were 7% higher than in 2021. This trend is likely to continue for 2023 emissions. Between 2022 and 2023, the amount of waste incinerated in Scotland increased by 15%.[128] The Scottish Government announced in 2022 that no new planning permissions for incineration facilities should be granted, however plants already with planning permission could still be built.[129]
- In 2023, Scotland had six operating EfW sites with a total permit capacity of 792 kt annually.[130] EfW capacity in the construction or commissioning phase, as of 2023, totals 1,142 kt annually across five additional sites.[131] Although not all sites in the construction or commissioning phase may be built, there is scope for a significant increase in Scotland’s EfW capacity even if no further planning permission is granted.
- Waste emissions have increased since 2013. Emissions reductions from reducing waste sent to landfill have slowed, while recycling rates have plateaued and emissions from EfW increased.
The Balanced Pathway for waste
In our pathway, waste emissions fall by 56% from 1.9 MtCO2e in 2022 to 0.9 MtCO2e by 2035. The emissions pathway for waste is summarised in Table 3.10.
| Table 3.10 Emissions in the Balanced Pathway for waste |
||||||
| 2025 | 2030 | 2035 | 2040 | 2045 | ||
| Emissions | Emissions in year (MtCO2e) | 1.8 | 1.3 | 0.9 | 0.6 | 0.4 |
| Change in emissions since 1990 | -72% | -80% | -87% | -91% | -94% | |
| Change in emissions since 2022 | -5% | -34% | -56% | -71% | -80% | |
| Share of total Scottish emissions | 4% | 4% | 4% | 4% | ||
| Key drivers – quantity variables | EfW capacity with CCS | 0% | 16% | 49% | 81% | 100% |
| Food waste reduction from 2021 levels (per capita) | 17% | 39% | 42% | 45% | 48% | |
| Near elimination of waste from landfill | 2028 – biodegradable waste | 2045 – all waste | ||||
| Source: CCC analysis Notes: We have blanked out the share of total Scottish emissions in 2045 because total Scottish emissions have reached Net Zero at this point. |
||||||
The key measures that combine to reduce emissions from waste are:
- Waste reduction from waste prevention (68% of emissions reductions in 2035). Waste reduction is enabled by improving resource efficiency, reducing food waste and increasing recycling rates.
- Our UK Balanced Pathway assumes the combined recycling rate for household and commercial and industrial waste, including non-household municipal waste, reaches 68% by 2035, an increase from 47% in 2025. We assume the same rate of increase in recycling rates in Scotland, but starting from a slightly lower base to reflect Scotland’s lower household recycling rate compared to the UK (42% compared to 45% in 2021). We assume the commercial and industrial recycling rate in Scotland follows the same trajectory as the UK.[132]
- Our UK pathway assumes a 39% reduction in total food waste per capita by 2030 compared to 2021 levels, which is aligned to the Courtauld Commitment 2030 and the UN’s Sustainable Development Goal (SDG) 12.3, which Scotland has committed to.[133]
- Our pathway assumes the near elimination of biodegradable waste to landfill by 2028 across the UK. We also assume an elimination of all waste sent to landfill in 2045. While Scotland is currently intending to ban biodegradable waste from going to landfill from the end of 2025, this only covers municipal waste whereas the ambition in our pathway covers waste from both household and commercial and industrial sites.[134]
- CCS at EfW plants (14% of emissions reductions in 2035). In the pathway, Scotland begins to install CCS at EfW plants in 2030 by connecting to the Scottish Cluster.[135] EfW capacity relocates away from more dispersed sites towards the cluster, leading to an increase in capacity around Grangemouth. EfW capacity in Scotland overall remains constant across our pathway, at broadly the level in operation today.
- Landfill methane capture (13% of emissions reductions in 2035). We assume methane capture rates at landfill sites increase to 62% by 2035, up from 49% in 2022.
- Wastewater treatment improvements (4% of emissions reductions in 2035). Nitrous oxide emissions for municipal and industrial wastewater treatment are addressed through covering and containment, membrane aerated biofilm reactors, and enhanced emissions monitoring. Methane emissions are addressed through advanced anaerobic digestion.
- Covering and containment, enhanced monitoring and real-time control and digital twins are rolled out from 2027. Membrane aerated biofilm reactors are rolled out from 2033.
- Advanced anaerobic digestion is already in widespread use and is rolled out to all plants by 2030. Industrial wastewater improvements lag five years behind the municipal wastewater sector in our pathway.
Key actions to deliver the Balanced Pathway in waste
Policy in the waste sector is largely devolved, although the Scottish Government is part of efforts led by the UK Government to introduce UK-wide waste reforms including extended producer responsibility (EPR). The key actions for the Scottish Government are as follows:
- Ensure that new energy from waste capacity is only permitted where a viable route to connecting carbon capture and storage (CCS) can be established.
- Work with the UK Government, industry, and local authorities to bring forward plans for installing CCS at Scotland’s EfW plants, including enabling development of the Scottish Cluster and assessing the feasibility of CCS at existing and future plants.[136]
- Ensure actions outlined in the circular economy and waste route map are delivered on time and build on previous waste reduction targets.[137] The Scottish Government should consider accelerating plans to introduce statutory recycling and reuse local performance targets, currently planned from 2030, to increase recycling and waste reduction efforts ahead of the elimination of biodegradable waste going to landfill.
- Enable improvements in monitoring and investment in technology development and deployment to reduce emissions from wastewater.
3.2.9 Aviation
Emissions in aviation
In 2022, aviation was the ninth highest-emitting sector in Scotland, accounting for 4% of Scotland’s emissions.
Emissions from aviation have risen by 20% from 1.4 MtCO2e in 1990 to 1.6 MtCO2e in 2022. However, 2022 emissions have not yet rebounded to pre-COVID-19 pandemic levels, which is reflected in the figures below:
- International aviation emissions were 1.2 MtCO2e in 2022, 121% above 1990 emissions and 20% below 2019 emissions.
- Domestic aviation emissions were 0.3 MtCO2e in 2022, 30% below 1990 emissions and 25% below 2019 emissions.
- Military aviation emissions were 0.1 MtCO2e in 2022, 76% below 1990 levels.
The Balanced Pathway for aviation
As in our UK-wide advice, the aviation sector takes responsibility for reducing its emissions to Net Zero by 2050 through paying to deploy sustainable aviation fuels (SAF), engineered removals, efficiency improvements, and low-emissions aircraft. The overall increase in the cost of flying results in a reduction in demand relative to the baseline projection.
In our pathway, aviation emissions fall by 5% from 2.0 MtCO2e in 2025 to 1.6 MtCO2e by 2035. The emissions pathway for aviation is summarised in Table 3.11.
| Table 3.11 Emissions in the Balanced Pathway for aviation |
||||||
| 2025 | 2030 | 2035 | 2040 | 2045 | ||
| Emissions | Emissions in year (MtCO2e) | 2.0 | 1.8 | 1.6 | 1.5 | 1.3 |
| Change in emissions since 1990 | +43% | +28% | +14% | +11% | -3% | |
| Change in emissions since 2022 | +19% | +6% | -5% | -7% | -19% | |
| Share of total Scottish emissions | 5% | 6% | 7% | 11% | ||
| Key drivers – quantity variables | Percentage of liquid fuel demand that is SAF | 1.3% | 6% | 12% | 17% | 27% |
| Annual average percentage efficiency improvement | 1.3% | 1.3% | 1.3% | 1.3% | 1.3% | |
| Source: CCC analysis. Notes: (1) We have blanked out the share of total Scottish emissions in 2045 because total Scottish emissions have reached Net Zero at this point. (2) As aviation policy is largely reserved, the quantity variables are the UK-wide levels required by the UK-wide Seventh Carbon Budget’s Balanced Pathway. |
||||||
The key measures that combine to reduce emissions from aviation are:
- Demand (62% of emissions reductions in 2035). Our analysis assumes that industry adopting the cost of decarbonising the aviation sector will help to manage demand relative to the growth seen in the baseline projection.
- The Government’s high carbon value is included in the cost of flying used to forecast future demand, to account for uncertainties in technology development, likely high SAF and engineered removals costs, and non-CO2 effects.[138]
- Under the Act, the Committee is required to provide advice on whether an aviation multiplier to reflect the direct and indirect non-CO2 climate change impacts of emissions at altitude from international aviation is appropriate. We continue to recommend that Scottish targets do not take non-CO2 effects into account (i.e. the multiplier should be set at one) (see Box 3.2).
- Aviation demand can only grow if aviation sector technology rollout progresses and begins to abate and offset aviation emissions, with demand management playing an important role in reducing emissions in the 2020s and 2030s while the availability of SAF and engineered removals to offset fossil fuel use is limited.
- Highlands and Islands flights are excluded from aviation demand management to protect essential connectivity and lifeline flights.
- The Government’s high carbon value is included in the cost of flying used to forecast future demand, to account for uncertainties in technology development, likely high SAF and engineered removals costs, and non-CO2 effects.[138]
- SAF (29% of emissions reductions in 2035). In line with the SAF pathway in our UK-wide Seventh Carbon Budget advice, SAF meets 12% of fuel demand for Scottish flights by 2035, compared to less than 1% at a UK-wide level in 2023 (Figure 3.4f).
- Efficiency improvements and hybrid- and zero-emission aircraft (8% of emissions reductions in 2035). Fuel, operational, and air transport movement efficiencies increase seat-km per tonne of fuel by 1.3% per year on average between 2025 and 2050. It is likely that hybrid-electric aircraft will enter the fleet around 2030, although due to modelling constraints they enter our pathway in 2040. Battery-electric aircraft enter the fleet in 2040 in our pathway. Hydrogen aircraft may contribute to meeting Scotland’s Net Zero target and beyond but are insufficiently developed for inclusion in this advice.
- Scottish domestic aviation emissions make up a high proportion of Scotland’s total aviation emissions compared to the UK. Domestic routes in Scotland, particularly short distance journeys providing essential services to Highlands and Islands communities, are good opportunities for early deployment of low emissions aircraft types.
- Permanent engineered removals. Engineered removals are used to balance long-lived CO2 emissions from fossil fuels. By 2050, all residual aviation emissions are offset by engineered removals, paid for by the aviation industry. For more information on removals technologies, see Section 3.2.12.
| Box 3.2 Non-CO2 effects of aviation and aviation multiplier recommendation |
|
Under the Climate Change (Scotland) Act, the Committee is required to provide advice on whether an aviation multiplier to reflect the direct and indirect non-CO2 climate change impacts of emissions at altitude from international aviation is appropriate. The Committee has previously recommended that Scottish targets do not take non-CO2 effects into account (i.e. the multiplier should be set at one). In addition to the warming effects from CO2, further climate impacts from aviation result from nitrogen oxides, water vapour, black carbon (soot), and sulphur dioxide emissions. These pollutants affect the climate in different ways. For example, nitrogen oxides have a warming effect, while in most cases sulphates have a cooling effect. Water vapour from planes can also create contrails, which are long trails of cloud caused by aircraft flying through supersaturated air, depending on the local atmospheric conditions. These high-altitude contrails can help the formation of cirrus clouds, which have a relatively large warming effect on the global surface air temperature. Non-CO2 effects likely have a high warming effect, though the level of their exact impact on temperature change is uncertain. Non-CO2 effects are estimated to contribute around two-thirds of aviation’s total effective radiative forcing globally – twice as much as historical CO2 emissions from aviation. But CO2 emissions are much longer-lived than non-CO2 effects.
The short lifetime and uncertainty of non-CO2 effects mean that policies designed around a multiplier risk encouraging strategies that might perversely increase CO2 emissions. Further research is required to understand the effectiveness of each measure and to understand potential unintended consequences such as increasing CO2 emissions by, for example, taking longer routes to avoid contrails. Managing the forecasted increase in demand is the most effective approach to limit warming from non-CO2 effects. To account for uncertainties in technology development, likely high SAF and engineered removals costs, and non-CO2 effects, our analysis adopts the Government’s high carbon value into the cost of flying. This helps manage aviation demand in line with Net Zero. We continue to recommend that Scottish targets do not take non-CO2 effects into account. The exact quantitative role that non-CO2 effects play in global warming is still too uncertain to explicitly include in Scottish targets. It would also be inconsistent with the approach taken across the rest of the UK. Instead, the Scottish Government should work with the UK Government to ensure that the cost of aviation mitigating its emissions is reflected in the cost to fly, start monitoring non-CO2 effects of aviation, and set a minimum goal of no further warming after 2050 from non-CO2 effects. |
Key actions to deliver the Balanced Pathway in aviation
Policy in the aviation sector is largely reserved, except for planning and consenting regulations related to airports and airport expansions and Air Passenger Duty. The key actions for the Scottish Government are as follows:
- Work with the UK Government to develop and implement policy, such as the existing SAF mandate and the UK Emissions Trading Scheme, that ensures the aviation sector takes responsibility for mitigating its emissions and ultimately achieving Net Zero for flying.
- The Scottish Government could use devolved Air Departure Tax powers to increase the cost of flying for certain flights while UK-wide policy is developed.
- Support the roll-out of domestically produced SAF through projects such as Zero Petroleum in Orkney.[139]
- Continue to support innovation and commercialisation of low- and zero-emission aircraft, building off initial tests and plans to use new aircraft on domestic Scottish routes.[140];[141]
- Continue to support the development and rollout of permanent engineered removals. See Section 3.2.12 for more information.
3.2.10 Electricity supply
Emissions in electricity supply
In 2022, electricity supply was the 10th highest-emitting sector in Scotland, accounting for 3% of Scotland’s emissions.
Emissions from electricity supply have fallen by 90% from 14.7 MtCO2e in 1990 to 1.4 MtCO2e in 2022.
- Between 1990 and 2010, electricity supply emissions varied but did not fall in a sustained way. In 2010, unabated coal and gas provided around half of electricity generation.
- Between 2010 and 2017, emissions fell rapidly as coal was phased out of the generation mix and largely replaced with variable renewables. The last remaining coal-fired power station in Scotland, Longannet, closed in 2016, leaving unabated gas as the main source of emissions. Onshore wind capacity nearly trebled in this period from 2.5 GW to 7.3 GW and variable renewables provided 47% of generation in 2017.
- Between 2017 and 2022, emissions have been relatively flat as continued deployment of variable renewables has largely displaced retiring nuclear capacity. Between 2017 and 2022, the share of generation from unabated gas remained around 10%.
- Demand for electricity has been falling by an average of 2% per year since 2005.
The Balanced Pathway for electricity supply
In our pathway, electricity supply is fully decarbonised by 2030. However, both the amount of electricity generated and demand for electricity will grow substantially out to 2045. The key values that underpin this pathway are summarised in Table 3.12.
Our modelling approach is consistent with our electricity system modelling for our UK-wide Seventh Carbon Budget advice and models the electricity system at plant level on an hourly basis out to 2050. The pathway is designed to meet the UK Government’s standards for security of supply. It is designed around a 1-in-20 adverse weather year that includes wind droughts. Emissions, generation, and fuel costs are based on the weather corresponding to an average emissions year.
| Table 3.12 Key values in the Balanced Pathway for electricity supply |
||||||
| 2025 | 2030 | 2035 | 2040 | 2045 | ||
| Emissions | Emissions in year (MtCO2e) | 0.9 | 0.0 | 0.0 | 0.0 | 0.0 |
| Change in emissions since 1990 | -94% | -100% | -100% | -100% | -100% | |
| Change in emissions since 2022 | -33% | -100% | -100% | -100% | -100% | |
| Share of total Scottish emissions | 2% | 0% | 0% | 0% | ||
| Key drivers – quantity variables | Gross annual electricity demand (TWh) | 21 | 27 | 37 | 49 | 59 |
| Variable renewable generation (TWh) | 40 | 85 | 131 | 201 | 214 | |
| Grid storage capacity (GW / GWh)* | 2 / 15 | 5 / 98 | 5 / 98 | 6 / 100 | 6 / 100 | |
| Unabated gas share of generation (%) | 1% | 0% | 0% | 0% | 0% | |
| Source: CCC and AFRY analysis. Notes: (1) We have blanked out the share of total Scottish emissions in 2045 because total Scottish emissions have reached Net Zero at this point. (2) Emissions associated with energy from waste are accounted for in the waste sector. Emissions associated with combined heat and power are accounted for in the industry and fuel supply sectors. (3) *Grid storage includes both short- and medium-duration technologies. |
||||||
The key elements of the future electricity supply system in our pathway are:
- Electricity demand. Annual electricity demand in Scotland increases from 22 TWh in 2022 to 37 TWh by 2035. This reflects the increasing electrification of transport, buildings, and industry. In 2035, Scotland generates around 95 TWh more than its demand, with this surplus exported to the rest of the UK, stored, and used to generate electrolytic hydrogen.
- Variable renewables (98% of generation in 2035). Renewables have an essential role to play in meeting Scotland’s carbon budgets and the wider UK emissions targets.
- In our pathway, the capacity of variable renewables in Scotland (including offshore and onshore wind and solar) more than triples from 15 GW in 2023 to 49 GW by 2035, increasing to 66 GW by 2045.
- Variable renewables capacity provides 131 TWh of generation in 2035 (Figure 3.4g), of which 123 TWh comes from wind.
- There is currently 1.7 GW of hydro flow capacity in Scotland, 88% of total UK capacity. In our pathway, we assume that this capacity remains constant out to 2050.
- There is currently a small amount of wave and tidal capacity in Scotland. However, these technologies remain relatively expensive and so are not included in our pathway.
- Other forms of generation (2% of generation in 2035). We expect a small amount of generation from other sources, including energy from waste and combined heat and power. Emissions associated with these forms of generation are accounted for in other sectors.
- Grid storage (5.3 GW or 98 GWh in 2035). With an increasing share of variable renewables, grid storage such as batteries and pumped hydropower can capture energy, typically when it is cheap, to provide electricity in periods when demand is higher and electricity is more valuable. It can operate on short-to-medium timescales to provide flexibility when it is most valuable.
- There is currently 0.7 GW of pumped hydropower capacity in Scotland, with a storage capacity of 13 GWh. This is supplemented in our pathway by 0.8 GW or 78 GWh of additional medium-duration storage by 2035, which could be delivered through pumped hydropower or other grid storage technologies, such as compressed air storage.
- Networks and interconnection. The capacity of transmission and distribution networks will need to be increased at pace to ensure supply is able to be transported to sources of demand as electricity generation is increasingly decarbonised and demand grows. Connection of the electricity grid to neighbouring markets enables imports of electricity when it is cheaper than available domestic generation and provides a market for surplus generation.
The future profile of Scottish emissions depends in part on decisions about the future of existing unabated gas power plant, and whether these are replaced with low-carbon equivalents. Our Balanced Pathway does not build any low-carbon dispatchable capacity in Scotland. Instead, security of supply is provided through a combination of grid storage, use of storable fuels on the GB-wide network, smart demand flexibility, and interconnection. However, ultimately these decisions will be taken by operators in the electricity market.
- Currently, Scotland has one remaining large unabated gas power station, Peterhead. In 2022, emissions from Peterhead totalled 1.4 MtCO2e. Our pathway assumes that Peterhead closes in 2030.
- Once Peterhead stops generating, emissions would only come from any uses of gas with CCS (whether in post-combustion power plants, or ‘blue’ hydrogen production to fuel hydrogen turbines) for low-carbon dispatchable generation.[142] Low-carbon dispatchable capacity refers to sources of generation where the operation can be planned with a high degree of confidence to provide flexible, controllable electricity.
- The potential development of such low-carbon dispatchable projects in Scotland will be strongly influenced by a range of factors including UK and international energy policy, demand for electricity in the UK and Scotland, and company-specific decisions around dates of decommissioning or low-carbon conversion of unabated gas plants, as well as developments and operations in the GB-wide system.
- While there are no low-carbon dispatchable power stations that require the use of gas with CCS in our pathway, if capacity was built in Scotland, we would expect Scottish emissions to remain at very low levels (around 0.2 to 0.4 MtCO2e per year).[143]
- Without low-carbon dispatchable capacity, system resilience during periods of adverse weather is dependent on grid storage, use of flexible low-carbon capacity on the GB-wide network, smart demand flexibility, and imports of power via any interconnectors connected in Scotland.
Key actions to deliver the Balanced Pathway in electricity supply
Policy in the electricity supply sector is largely reserved. Scotland is part of the GB-wide electricity system. Decisions on nationally significant energy infrastructure projects are taken in line with the National Policy Statements for energy infrastructure. The key actions for the Scottish Government are as follows:
- Urgently improve the planning process to approve large electricity infrastructure projects in Scotland, such as transmission lines and onshore wind farms.
- Currently, it can take up to four years to approve large electricity infrastructure projects in Scotland.
- The Scottish Government and the UK Government have committed to reform the energy consents system in Scotland, including through measures in the Planning and Infrastructure Bill. Both governments should ensure that these reforms are now implemented at pace. All bodies involved in the planning and consenting process must also be adequately resourced and skilled.
- Work with the UK Government and industry to consider the role of low-carbon dispatchable generation technologies, such as gas with carbon capture and storage in Scotland’s future generation mix.
3.2.11 F-gases
Emissions in F-gases
In 2022, F-gases was the 11th highest-emitting sector in Scotland, accounting for 2% of Scotland’s emissions.
Emissions from F-gases have risen by 231% from 0.2 MtCO2e in 1995 to 0.7 MtCO2e in 2022.[144]
- An increase in the use of air conditioning and refrigeration appliances saw emissions increase until the mid-2010s.
- The F-gas Regulation (2015) then reduced F-gas emissions by phasing down the amount of hydrofluorocarbons (HFCs) that can be placed on the market.[145]
The Balanced Pathway for F-gases
In our pathway, F-gases emissions fall by 65% from 0.7 MtCO2e in 2022 to 0.2 MtCO2e by 2035. The emissions pathway for F-gases is summarised in Table 3.13.
| Table 3.13 Emissions in the Balanced Pathway for F-gases |
|||||
| 2025 | 2030 | 2035 | 2040 | 2045 | |
| Emissions in year (MtCO2e) | 0.5 | 0.3 | 0.2 | 0.2 | 0.1 |
| Change in emissions since 1995 | +158% | +61% | +15% | -17% | -30% |
| Change in emissions since 2022 | -22% | -51% | -65% | -75% | -79% |
| Share of total Scottish emissions | 1% | 1% | 1% | 1% | |
| Source: CCC analysis Notes: We have blanked out the share of total Scottish emissions in 2045 because total Scottish emissions have reached Net Zero at this point. |
|||||
The key measures that combine to reduce emissions from F-gases are:
- Refrigeration (37% of emissions reductions in 2035) and air conditioning and heat pumps (30% of emissions reductions in 2035). This involves taking care to remove F-gases in refrigeration, air conditioning, and heat pumps when that equipment has reached the end of its life, as well as the use of lower global warming potential (GWP) refrigerants in refrigeration, air conditioning, and heat pumps.
- Inhalers (32% of emissions reductions in 2035). This involves replacing use of high-GWP propellants in inhalers with lower-GWP propellants. This can involve using dry powder inhalers (for patients who can switch to this device) or using metered-dose inhalers with alternative propellants (for patients who cannot switch to dry powder inhalers).
Key actions to deliver the Balanced Pathway in F-gases
Delivering the pathway in F-gases will depend on a clear regulatory framework that stimulates the necessary innovation and deployment for decarbonisation. This is largely reserved, although we expect decisions around inhalers to fall under devolved health policy.
3.2.12 Engineered removals
Emissions in engineered removals
Engineered removals are measures that remove CO2 from the atmosphere to permanent storage. Other than small-scale testing, there have been no engineered removals recorded to date in Scotland.[146];[147]
Globally, some engineered removals are taking place, mostly in the bioenergy and carbon capture and storage (BECCS) and biochar sectors, and there is a growing pipeline of projects under development.[148]
The Balanced Pathway for engineered removals
In our pathway, engineered removals start contributing in 2030. They reach 0.5 MtCO2e by 2035 and 3.6 MtCO2e by 2045 (Figure 3.4h). The amount in 2045 is driven by the need for the UK as a whole to balance residual emissions to achieve Net Zero in 2050, and a feasible scale-up to reach that level. Scotland’s share of engineered removals technologies is based on individual assumptions described below. The emissions pathway for engineered removals is summarised in Table 3.14.
| Table 3.14 Emissions in the Balanced Pathway for engineered removals |
|||||
| 2025 | 2030 | 2035 | 2040 | 2045 | |
| Emissions in year (MtCO2e) | 0.0 | -0.1 | -0.5 | -1.7 | -3.6 |
| Share of residual Scottish emissions offset by engineered removals* | 0% | 0% | 2% | 7% | 21% |
| Source: CCC analysis. Notes: (1) Emissions in year refers to all engineered removals across subsectors. (2) *This refers to the proportion of total Scottish emissions sources (that is, emissions excluding engineered removals and land use sinks) that are offset by our pathway’s roll-out of engineered removals. |
|||||
Engineered removals are achieved through three groups of technologies, though there is uncertainty in their respective roles.
- Direct air carbon capture and storage (55% of engineered removals in 2045). DACCS is a group of technologies designed to extract CO2 directly from the atmosphere through chemical and physical methods and send it to permanent geological storage. DACCS starts contributing in 2035. In 2050 in the Balanced Pathway, to reflect expected co-location with CCS clusters, 25% of UK-wide DACCS capacity is in Scotland. Scotland has natural advantages which favour development of DACCS, notably abundant renewable generation, particularly from wind. These factors, as well as Scotland’s earlier Net Zero target, are likely to encourage a faster scale up of DACCS in Scotland. We assume Scotland scales up to maximum DACCS capacity by 2045, five years ahead of the UK as a whole reaching maximum DACCS capacity.
- Bioenergy with carbon capture and storage (29% of engineered removals in 2045). BECCS is the burning or converting of a biomass resource in a process with CCS applied. By capturing biogenic CO2 and sending it to permanent geological storage, BECCS is a net negative emissions process. In our pathway, it starts contributing in 2030, and features in industry (specifically cement and chemicals), waste (energy from waste), and fuel supply (including aviation biofuels, hydrogen, biomethane, and bio-liquefied petroleum gas). Scotland’s share of UK-wide BECCS processes is based on a combination of alignment with existing facilities, and the fuel demands of the Scottish population.
- Enhanced weathering and biochar (16% of engineered removals in 2045). These are removals approaches that rely on land- and water-based CO2 storage. Enhanced weathering involves speeding up the natural process of rock weathering through grinding and spreading rock on land to accelerate its reaction with CO2 in the atmosphere to form bicarbonates. These bicarbonates are gradually washed via rivers into the sea where the carbon is stored for centuries or more. Biochar as a removal involves heating biogenic wastes in the absence of oxygen to form a stable carbon-rich biochar, which is resistant to breaking down and can be spread onto and absorbed by soils.
- In our pathway, enhanced weathering and biochar make only a small contribution, starting in 2030. Recent developments indicate they have significant potential, but more work is needed to confirm and quantify this.[149]
- Across the nations of the UK, enhanced weathering and biochar are distributed according to the share of temporary grassland, cropland, and rough grazing land, these being the land types where active trials are underway.
Who pays for engineered removals is a policy choice. In our UK-wide Seventh Carbon Budget advice, we largely assume that engineered removals are funded in line with a ‘polluter pays’ principle, in which case these costs would fall UK-wide rather than necessarily to people in Scotland.
Key actions to deliver the Balanced Pathway in engineered removals
Policy to deliver large-scale industrial engineered removals, such as developing the associated business models, is largely reserved. The key actions for the Scottish Government are as follows:
- Work with the UK Government to enable, develop and deliver the CO2 transport and storage infrastructure necessary to deploy CCS-based removals at scale.
- Consider implementing policy to improve understanding and increase delivery of enhanced weathering and biochar at scale in the Scottish context. Growing these approaches would create optionality between engineered removals technologies, giving, for example, the possibility to substitute for some of the DACCS in the Balanced Pathway.
3.3 Contingency actions and options to go further
There are a range of uncertainties that could affect Scotland’s pathway to Net Zero. In addition, there is a risk that policies could fail to deliver the expected level of emissions reductions. In either case, it is important to monitor both the emissions trajectory and the underlying indicators of progress (see Section 3.2), as well as factors such as GDP, population, the greenhouse gas inventory, and costs, to enable early identification of a long-term risk of underperforming on emissions reductions.
Contingency options are plans that can be implemented to deliver additional emissions reductions to make up for shortfalls in the pathway. As part of our UK-wide Seventh Carbon Budget advice (see Chapter 6 in our UK advice report), we modelled a range of additional actions that could be used as contingencies or to go further than our pathway. The contingency actions that could have the largest impact in Scotland are expected to change in different carbon budget periods.
- By the end of the Second Carbon Budget (2035), 40% of cars on Scottish roads will still be powered by petrol or diesel. Therefore, measures to incentivise people to choose public transport or active travel over private car travel beyond what is assumed in our pathway could provide an important contingency option for the First and Second Carbon Budgets.
- In our pathway, 6% of car-kilometres are shifted to active travel and public transport by 2035, compared to the baseline.
- We have modelled a contingency to go further in reducing car-kilometres, based on maximum shifts observed in research literature. This results in an 8% shift away from car-kilometres.
- Investment in bus services and measures to restrict traffic growth can be implemented relatively quickly. The Scottish Government is demonstrating this approach through Scotland’s Bus Partnership Fund and various traffic management initiatives such as the Edinburgh City Centre Transformation project and Glasgow’s Low Emission Zone.[150];[151];[152]
- During the Second Carbon Budget period, the vast majority of new cars sold will be fully electric, with this share increasing to 100% by the end of the period. Incentives and effective public information campaigns could help grow demand sooner, allowing more EVs to enter the fleet more quickly.
- In addition, scrappage schemes that incentivise owners of older, less efficient fossil fuel cars to replace these before end-of-life could begin to play a role during the Second Carbon Budget period, once EV markets have scaled up to become the dominant choice.
- Early scrappage of vehicles is not included in the Balanced Pathway but could provide an option to go faster or to catch up if emissions reductions fall off track.
- The heat pump market will be growing at pace by the end of the Second Carbon Budget, with a mix of consumer demand, supply chains, and the pace of growth of the installer workforce expected to be constraining the rate at which this can occur. Earlier action to enable this market to scale up sooner could potentially deliver faster emissions reductions in Scotland than in our pathway.
- Investment to deliver early take-up in buildings owned and managed by the public sector could help support these supply chains to grow quickly.
- Our Balanced Pathway assumes that boilers are replaced with low-carbon heating in line with natural replacement cycles, but earlier scrappage of high-carbon systems could provide an option to accelerate the rate of decarbonisation of home heating.
- Our modelling was completed before the Scottish Government announced a proposed target for decarbonising heating systems by 2045 would be included in the Heat in Buildings Bill. Measures to support that target could deliver faster emissions reductions than in our pathway.
- In the Third and Fourth Carbon Budget periods, emissions reductions from agriculture and land use are particularly important. Given the large share of emissions coming from livestock agriculture, additional use of methane-suppressing livestock feed additives could also provide a valuable contingency option. These measures are included among the low-carbon farming measures and technologies in our pathway, but there may be scope for further development and deployment of additives beyond those considered.
- An example is Asparagopsis, which recent studies suggest could significantly reduce ruminant methane emissions.[153];[154] We have not included this in our pathway due to concerns about potential environmental and health impacts of its use, so further research would be required to address these issues.
- Scotland may be able to take a lead on early development, trials, and deployment of such additives, given its large agriculture sector.
- Engineered removals play a key role in enabling Scotland to achieve Net Zero by 2045 (see Section 2.4). There are strong reasons for locating DACCS in Scotland, as the abundant wind resource can be used to meet the high energy requirements of DACCS. This may allow Scotland to outperform its Net Zero target, reaching net negative emissions by 2045, or offset additional residual emissions if other sectors fall behind.
- The roll-out of low-carbon technologies in our Balanced Pathway is based on our UK-wide modelling of the pace at which technology deployment curves can scale up to help reach Net Zero by 2050 across the UK, adjusted to account for current deployment rates and other relevant circumstances in Scotland. As a result, while Scotland reaches Net Zero by 2045, the transition to low-carbon technologies in sectors such as surface transport and buildings continues until 2050. The Scottish Government could instead aim to accelerate these transitions to ensure they are completed sooner, in line with Scotland’s 2045 Net Zero target.
- Doing this would reduce the residual emissions that remain in 2045, providing the opportunity to either go further in overall emissions reductions or to reduce the dependency on engineered or land-based removals.
- In our pathway, 0.8 MtCO2e of residual emissions remain in 2045 across the surface transport and buildings sectors. If these emissions can instead be eliminated by 2045, then Scotland could meet its Net Zero target even if the roll-out of DACCS scales up to reach maximum capacity at the same rate as in the rest of the UK (as opposed to five years earlier, as in the Balanced Pathway – see Section 3.2.12).
3.4 Traded emissions
Table 3.15 shows which sectors are partly covered by the UK Emissions Trading Scheme (ETS).
| Table 3.15 Sectoral coverage of UK ETS |
|
| Sector | Covered by the UK ETS? |
| Agriculture | Not covered |
| Aviation | Partly covered |
| Electricity supply | Partly covered |
| Engineered removals | Not covered |
| F-gases | Not covered |
| Fuel supply | Partly covered |
| Industry | Partly covered |
| Land use | Not covered |
| Non-residential buildings | Not covered |
| Residential buildings | Not covered |
| Shipping | Partly covered from 2026 |
| Surface transport | Not covered |
| Waste | Partly covered from 2026 |
Chapter 4: Households and the economy
Introduction and key messages
This chapter describes the role of households in our pathway, and how households, the economy, businesses, and workers may be impacted.
Our key messages are:
- The key changes households can make will be to buy heat pumps (including communal systems) and electric cars when it is time to replace fossil fuel boilers or cars, to eat less meat and dairy, to keep flying close to today’s levels until technology develops, and to switch some car journeys to public transport or active travel.
- Policy and business action will need to make household low-carbon choices easy, attractive, and affordable, and ensure trusted information is provided.
- Households will benefit from more efficient technologies, less draughty homes, and cleaner air. For many households, changes to travel and home heating will lead to savings over the period 2025-2050, provided appropriate policy is in place.
- Most sectors of the economy will see little change in activity other than switching to
low-carbon heating and vehicles, but with the right skills and policy support there are opportunities to grow the low-carbon sector in Scotland. For example, the transition will create new jobs in home retrofit and tree planting, and has potential for job creation in emerging sectors such as offshore wind and carbon capture and storage. - Oil and gas fields in the North Sea are already mature and declining in output and will decline regardless of Net Zero. A reduction in fossil fuel demand will primarily reduce oil and gas imports rather than North Sea oil and gas production. The Scottish Government will need to work with industry, unions, communities and the UK Government to develop a regional plan for Aberdeen and the surrounding areas that captures new opportunities and supports workers during the transition.
4.1 Households
The transition from now until 2050 will involve changes that directly involve households. The most significant changes involving household choices cover four areas: cleaner and more efficient home heating, cleaner and more efficient road travel, keeping flying close to today’s levels until technology develops, and a reduction in average meat and dairy consumption.
- Electric cars and modal shift: the transition involves households purchasing electric cars when it is time to replace fossil fuel cars. By 2035 in our pathway, 60% of cars on the road are electric in Scotland. Our pathway includes households replacing some private car journeys with other modes of transport. Modal shift for Scotland involves 6% of baseline car demand switching to public transport, cycling, and walking by 2035, with the reduction in car-kilometres primarily achieved in built-up urban areas.[155]
- Low-carbon heating systems and energy efficiency measures: the transition involves households purchasing low-carbon heating systems when it is time to replace fossil fuel boilers.[156] This includes the four-fifths of households in Scotland who use gas as their main heating system and the 5% of households who rely on oil (particularly the case in the Western Isles).[157];[158] Some households (9%) will install large energy efficiency measures such as cavity wall, loft, and floor insulation, while most households will install smaller energy efficiency measures such as draught proofing.
- Around 25% of homes in Scotland are within tenement buildings, with nearly a third of these built pre-1919. These are particularly challenging to decarbonise, both due to their traditional construction and the difficulties relating to works requiring coordination among multiple owners. High temperature heat pumps offer a heating solution that can operate in older and less efficient properties. Additionally, Scotland has higher potential for communal systems and heat networks than the rest of the UK, offering an additional solution for tenement buildings.[159]
- Reduction in average meat and dairy consumption: from 2030 onwards, agriculture is the main source of residual emissions, with limited options to deliver reductions. Households consuming on average 30% less meat and 20% less dairy by 2045 reduces emissions directly from livestock and frees up land to enable peatland restoration, tree planting, and energy crops. A recent study found that reducing meat and dairy consumption in line with our Balanced Pathway in 2050 and replacing these in Scottish diets with whole foods or plant-based alternatives results in nutritional and health benefits without negatively affecting household food costs.[160]
- A reduction in average meat and dairy consumption also helps to avoid a scenario in which the reduction in livestock numbers in Scotland in our Balanced Pathway (see Section 3.2.2) results in an increase in meat and dairy imports, reducing the net impact on global emissions. The majority of Scottish beef (63%) and lamb (58%) is sold in the UK.[161];[162]
- Keeping flying close to today’s levels until technology develops: this reduces emissions compared to the baseline, with further impacts on reducing non-CO2 effects. To protect essential connectivity flights, we do not assume any demand management for domestic flights to or from the Scottish Highlands and Islands. Current zero-emission aircraft concepts, such as battery-electric or hybrid-electric aircraft, could be able to provide essential services and connectivity flights such as those for the Scottish Highlands and Islands.
- Other actions: this includes other household actions which play a smaller role in reducing emissions, such as energy-saving practices in homes; reducing waste and recycling more; switching to more energy efficient electrical appliances (for example, more efficient fridges); and switching to electric cooking appliances.
In 2023 the Scottish Parliament convened a citizens’ panel to deliberate the effectiveness of the Scottish Government’s public engagement strategy on climate change and make recommendations on enhancing involvement of the public in meeting Scotland’s climate targets.[163] The panel highlighted the need for consistent and transparent communication and engagement with the public about government action on climate change, and the need for shared responsibility between governments, businesses, and the public.
As part of our UK-wide Seventh Carbon Budget advice, we convened a citizens’ panel to explore the question of what an accessible and affordable vision of Net Zero would be for households in the UK. The panel were selected to be reflective of the UK public across a range of characteristics, and were from Birmingham and the surrounding area. The findings of this UK study are presented in our advice on the UK-wide Seventh Carbon Budget.
Although the Scottish Parliament’s and the CCC’s citizens’ panel differed in their focus, they both highlighted the importance of clear information and communication about key low-carbon household actions and to provide investment and financial support for low-carbon technologies, especially for low-income households.
With appropriate policy in place, households in Scotland will benefit from lower running costs of electric cars and low-carbon heating. They will require support with the upfront costs of low-carbon heating, and policies to make choices easy, attractive, and affordable.
- In our advice on the UK-wide Seventh Carbon Budget, we set out the findings of our distributional model. The model assesses the costs and savings experienced by 15 household archetypes, as a result of two illustrative policy packages designed to enable households to make the necessary changes to home energy use and car use. Our policy packages include support for upfront costs for home heating and action to reduce electricity prices.
- The archetypes are selected to reflect characteristics of households across the whole of the UK, including income, how they travel, and how they heat their homes. As such, the spread of archetype characteristics will not directly reflect the spread of household characteristics in Scotland, but many of the archetypes will reflect households across Scotland.
- In our analysis, energy demand per household is about 20% higher in Scotland than the UK average, reflecting colder average temperatures. Our pathway does not see a notable difference in proportion of energy reduction between 2025 and 2050 for households in Scotland compared to the UK as a whole, indicating that savings in energy bills are likely to be applicable in Scotland.
- In Scotland, there is a similar rate of car ownership compared to the rest of the UK, and higher car-kilometres driven per capita compared to England.[164];[165] Generally, our modelling finds that households that drive experience savings in transport costs overall across the period 2025 to 2050, with households who drive more saving more due to lower running costs of driving an electric car.
- Generally, we find that under the two illustrative policy packages, most household archetypes save over the transition period (from 2025 to 2050) when considering driving and home energy use, compared to a baseline of no further decarbonisation action.[166] Savings from lower running costs of electric cars and low-carbon heating and home heating grants outweigh the additional upfront cost of low-carbon heating.
- Scotland has a high proportion of households living in flats compared to the UK as a whole, with 32% of households in Scotland living in a tenement or purpose-built block of flats, compared to 22% in England and Wales.[167];[168]
- We do not include an archetype explicitly in a tenement building. However, archetypes A1, A3, A4 and A13 in our distributional analysis most represent households living in flats or tenement buildings, with these archetypes generally taking up communal heating (in the form of communal heat pumps or heat networks) or direct electric resistive heating.
- Generally, we find that households switching to communal heat pumps experience larger savings than average, as capital investment per household is lower for communal systems. However, support with upfront costs may still be required to incentivise uptake, as well as support with coordinating of financing and installation of building-wide measures.
- On the other hand, those switching to electric resistive heating are expected to face higher energy bills if targeted support is not provided. While upfront costs are lower, direct electric resistive heating is less efficient than individual or communal heat pumps, leading to higher energy bills overall.
- Rural households represent 17% of the population in Scotland.[169] In general, rural households tend to drive more and live in larger homes with higher energy demand, which is reflected in our archetypes A10 and A11. Many rural households require larger upfront investments to decarbonise their homes due to greater need to install energy efficiency and high-power heating systems, but receive larger savings in driving and energy bills once decarbonised.
The transition will bring wider benefits to households in Scotland, helping to reduce fuel poverty through lower energy bills and to improve health from cleaner air and less draughty homes.
- In 2022, 31% of households in Scotland were estimated to be in fuel poverty.[170];[171] The transition provides an opportunity to reduce levels of fuel poverty, as insulating homes and installing low-carbon heating will make homes more energy efficient and we expect electricity prices to fall relative to the baseline as renewables deployment progresses.
- A study conducted in 2023 found that fuel poverty in the Western Isles is three times worse than in the rest of Scotland, with 57% of the respondents in fuel poverty and 44% of these in extreme fuel poverty. The main drivers of this are the energy inefficient housing stock, high rates of electricity generation from diesel, and reliance on oil boilers.[172] A switch to low-carbon electricity generation, heating and insulation would help to address these drivers.
- We expect the transition to Net Zero to deliver improved health outcomes, through improved air quality, better insulated homes, increased active travel, and healthier diets. There could be some costs of additional time spent on public transport and, if a rebound effect (increased driving due to lower driving costs) occurs, changes to congestion levels.
4.2 Economy, businesses, and workers
4.2.1 Economy and businesses
Aggregate impacts of our pathway on the level of Scotland’s GDP by 2045 are uncertain, but unlikely to be large.
Regardless of the Net Zero transition, North Sea production will continue to decline, creating a requirement for new sources of well-paid employment. This is driven by the maturity of the field and will take place independently of, and faster than, declining demand due to the transition away from fossil fuels. In the UK Balanced Pathway, total net imports of oil and gas are projected to fall by 77% over the period from 2025 to 2050 (Figures 4.1 and 4.2).
- Domestic supplies of oil and gas are falling. The North Sea Transition Authority projects that, without further exploration, UK production of oil and gas will fall from 689 TWh in 2025 to
62 TWh in 2050. If production from possible new oil and gas fields is included, domestic production is projected to be 103 TWh in 2050.[173] - In the UK baseline, this means that net imports of 1,772 TWh of oil and gas would be needed in 2050, even with new exploration.
- Oil and gas demand is much lower in the UK Balanced Pathway, resulting in avoided imports of 1,589 TWh in 2050. Based on central projections of oil and gas wholesale prices, these avoided imports would be worth £45 billion in 2050.
|
Figure 4.1 UK consumption and imports of oil in the Balanced Pathway |
|
|
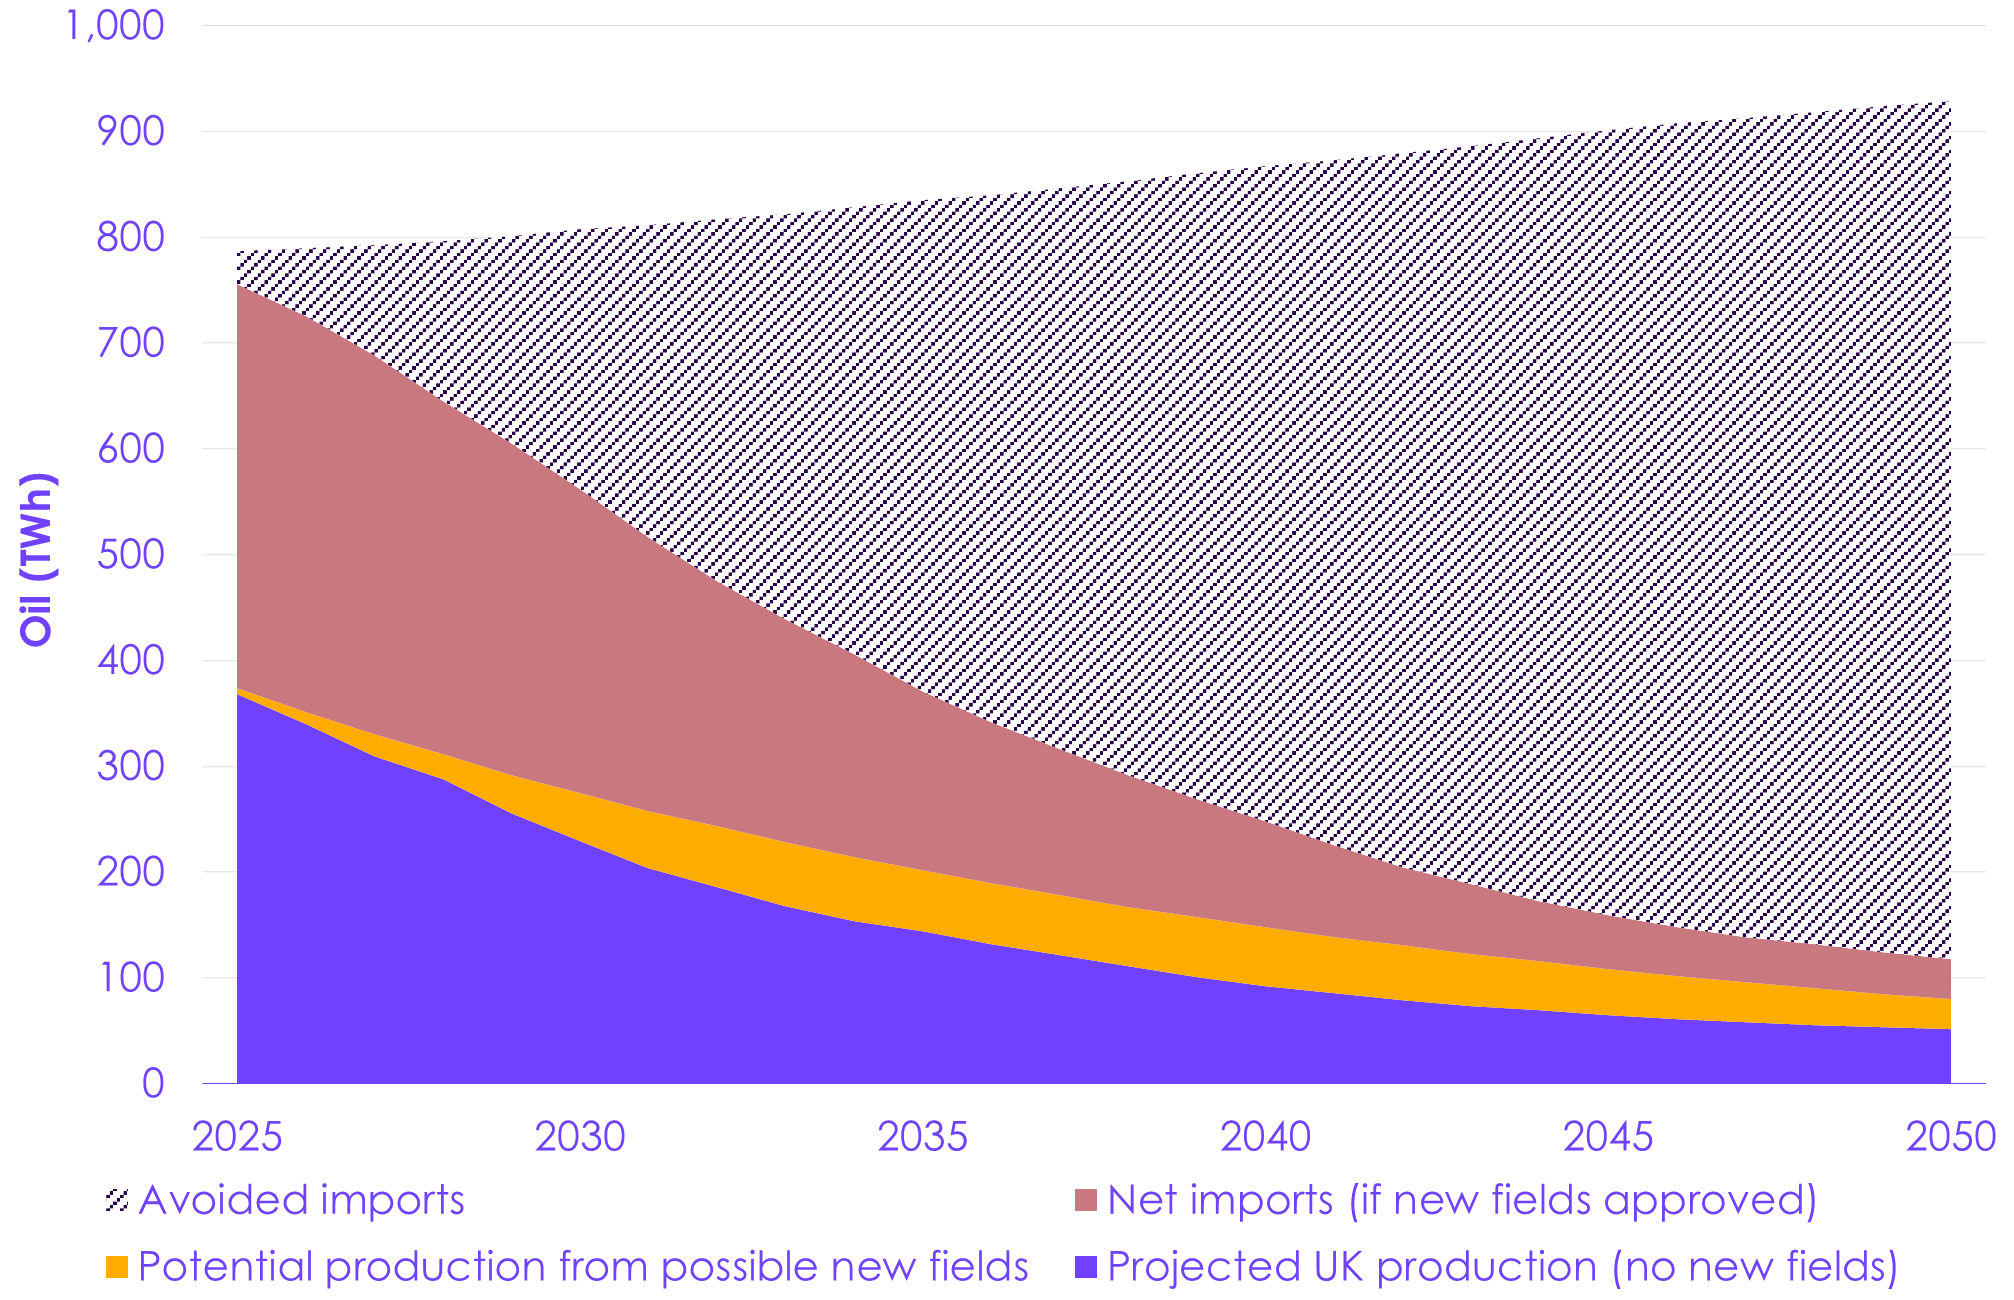
|
Figure 4.2 UK consumption and imports of gas in the Balanced Pathway |
|
|
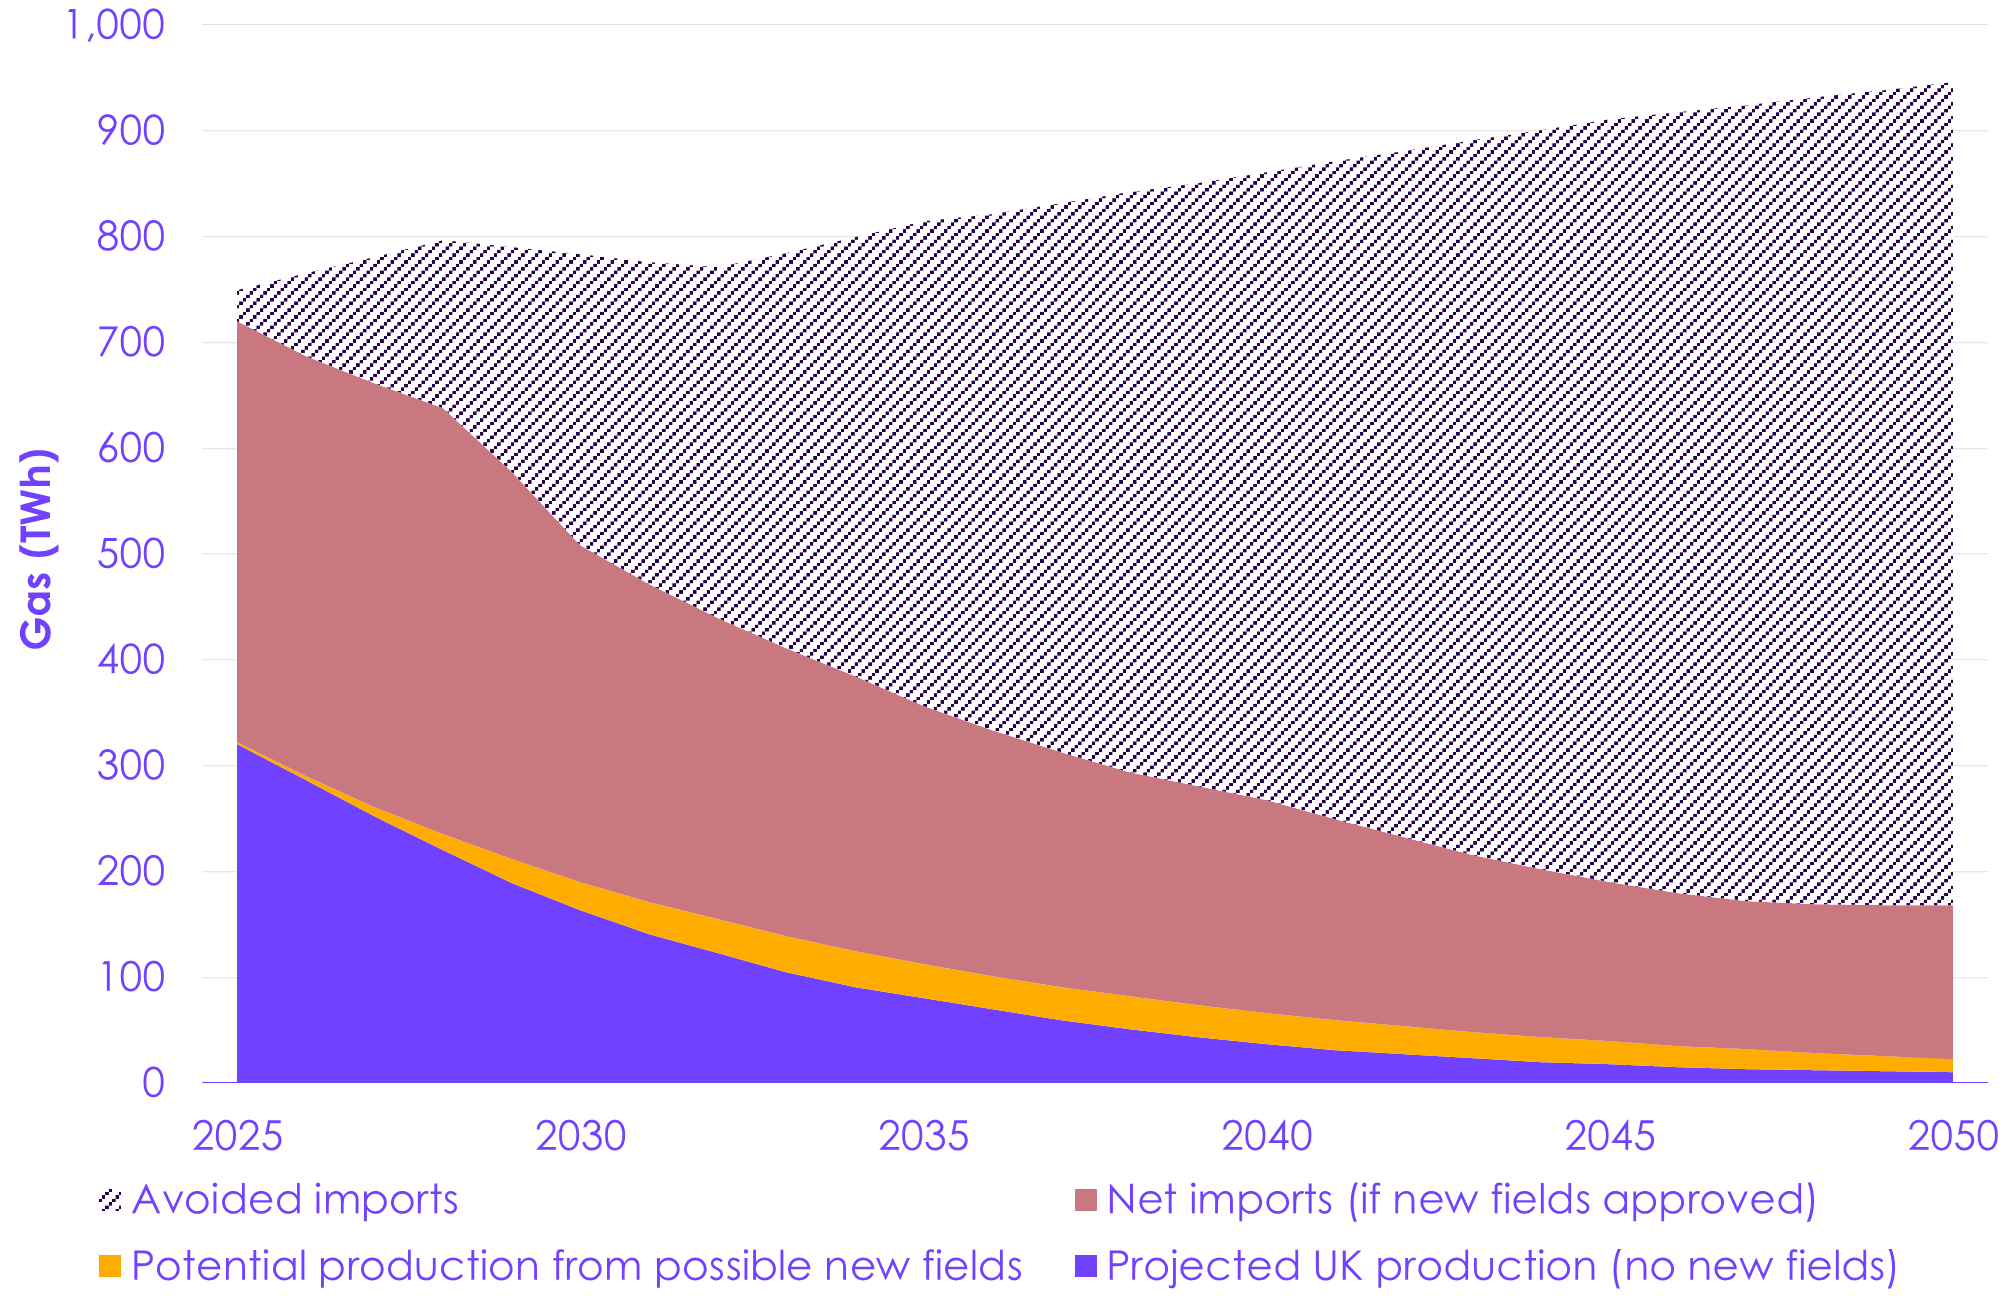
We set out our assessment of economic impacts across businesses and workers in the UK in our UK-wide Seventh Carbon Budget advice. Here we highlight the elements that are of particular significance to Scotland.
- Service sectors: the majority of Scotland’s gross value added (GVA) is comprised of service sectors (77%).[174] Most businesses and workers in service sectors will not see long-lasting impacts from the transition, although some businesses may need support with upfront costs of transitioning to low-carbon technologies such as heat pumps.
- Growth sectors: a growth in jobs in home retrofit will be required. This will require supportive skills policy. There are opportunities for new low-carbon industries including offshore wind and carbon capture and storage. Box 4.1 explores these opportunities in more detail. There are also opportunities to grow Scotland’s financial service sector which can facilitate investment into low-carbon products, with financial and insurance activities currently accounting for 8% of Scotland’s GVA.[175]
- Energy-intensive manufacturing: manufacturing is an important component of the Scottish economy. Some industrial sectors will face additional costs to eliminate emissions. The Scottish Government should ensure the right incentives are in place for these sectors to switch to low-carbon production and that transitions are planned proactively.
- Manufacturing comprises a slightly larger share of Scotland’s GVA (10%) than the UK as a whole (9%) and a similar share of Scotland’s employment (7%), with the largest contribution from food and drink manufacturing at 3.1% of GVA compared to 1.6% in the UK.[176];[177] The beverage industry, dominated by the production of whisky, accounts for about two-thirds of GVA in the food and drink manufacturing sector.[178] In our pathway, most food and drink manufacturing (including whisky) decarbonises by installing heat pumps.
- The energy-intensive industries, such as cement, chemicals and metals, comprise a small share of Scotland’s GVA but are important to local economies and employment. These industries are mostly grouped across the Scottish Cluster.[179] They face a fundamental transformation to decarbonise their production processes, which will have to be supported by an enabling investment environment. High additional upfront costs and the risk that domestic production is uncompetitive in the short term as it transitions need to be mitigated through policy. The development of low-carbon industrial clusters also presents an opportunity to transition these industries by sharing necessary infrastructure. By decarbonising early, manufacturers will be well placed to take advantage of growing global demand for low-carbon goods in the long term.[180] Policies such as carbon border adjustment mechanisms and product standards could help to ensure low-carbon goods are competitive in Scotland.
- Oil and gas: irrespective of Net Zero, the oil and gas industry faces a transitional period as oil and gas reserves decline.[181] By 2045, production is forecast to fall to around 12% of 2019 levels.[182] A transition for the sector will need to be addressed regardless of Net Zero. A reduction in fossil fuel demand will primarily reduce oil and gas imports rather than North Sea oil and gas production. The offshore oil and gas industry is an important component of the Scottish economy and the Scottish Government will need to work with industry, unions, communities and the UK Government to develop a regional plan for Aberdeen and the surrounding areas that captures new opportunities and supports workers during the transition.
- As of 2019, the offshore oil and gas industry was estimated to be responsible for more than 10% of Scottish GVA. In 2019 93% of its crude oil production was exported, making ‘mineral fuels, lubricants and related minerals’ the leading international export goods for the Scottish economy.[183];[184]
- As of 2019, the industry supported an estimated 57,000 direct and indirect jobs (representing around 2% of total jobs in Scotland). Of these, 25,000 are direct jobs and mostly located within Aberdeen City and Aberdeenshire.[185];[186] Salaries in this industry are also higher than the Scottish average, with an average wage of £88,000 for direct jobs, and £51,000 in the supply chain, compared to a Scottish average of £29,000.[187] We visited Aberdeen and heard from stakeholders about the importance of a regional transition plan to develop opportunities in low-carbon industries and support workers and communities (see Box 4.1).
- A smaller number of workers in the industry are employed in oil and gas processing, concentrated at the Grangemouth Refinery in Falkirk. In 2023, owner Petroineos announced its planned closure. In response, the UK Government recently announced a £200 million investment from the National Wealth Fund to repurpose the industrial base, as well as a jointly-commissioned feasibility study identifying potential low-carbon industrial options for the site. While the proposals are a step forward, decisive action must now be taken to fast-track progress and secure a low-carbon industrial future at Grangemouth and similar sites across Scotland and the UK. (see Box 4.2).[188]
- Agriculture: Scotland has an agricultural sector comprising 2% of GVA and carrying a wider cultural significance. Our pathway sees an overall decline in livestock herd sizes, with impacts on livestock farming. Farmers will need help to diversify their incomes.
- Agriculture is one of the sectors most affected by climate change. It also represents 25% of Scotland’s residual GHG emissions in 2045. Extreme weather events have substantial economic impacts on Scottish agriculture due to livestock losses and lower crop yields, and farmers will need government support in both adapting to climate change and producing sustainably.[189];[190];[191]
- Compared to the UK as a whole, ‘agriculture, forestry and fishing’ sectors have a more prominent role in Scotland’s economy, comprising 2% of GVA, compared to 0.9% across the whole UK. It also comprises about 2% of employment in Scotland, higher than the 1% of the UK as a whole.
- The decline in livestock herd sizes will have impacts on livestock farming and downstream businesses such as abattoirs. Farmers will need help to diversify their incomes, for example through renewables or alternative land management practices (such as woodland creation and peatland restoration). Government financial support will be needed in some cases to ensure appropriate incentives and returns.
- The majority of Scottish beef (63%) and lamb (58%) is sold in the rest of the UK.[192];[193] However, as with emissions-intensive industrial sectors, there may be a case for measures at the UK’s border to ensure changes in agricultural production do not simply lead to imports of high-carbon meat and dairy. Our pathway includes a reduction in average UK meat and dairy consumption, which is needed to avoid a reduction in UK livestock being accompanied by an increase in imported meat and dairy.
- Small and medium-sized enterprises (SMEs): SMEs account for over half of private sector turnover and employment in Scotland.[194] Most SMEs operate in the service sector and are not expected to see significant impacts from the Net Zero transition, although some businesses may need additional support to remove barriers to adopting low-carbon technologies. Around three-quarters of turnover and employment in Scotland’s construction and agriculture sectors are from SMEs. SMEs in construction are expected to see a growth in jobs in buildings retrofit. SMEs in livestock agriculture will need support to transition and diversify.
4.2.2 Workers and a just transition
Net Zero provides a range of opportunities to create jobs across Scotland, expanding and diversifying the workforce of sectors core to the transition. Job growth is not guaranteed, particularly in the context of international competition, and requires active reskilling and upskilling.
- New jobs are expected to be created in non-traded industries such as home retrofit and woodland creation, providing new jobs in urban and rural areas. Ensuring workers are in the right place, at the right time, with the right skills, will be key to meeting this demand.
- There is also potential for creation of jobs in other sectors such as offshore wind, carbon capture and storage, and the manufacture of electric vehicles. However, the extent of job creation depends on international competitiveness and levels of policy support provided.
- With the right support, developing domestic supply chains for key low-carbon technologies such as wind turbines, heat pumps, and batteries could create manufacturing opportunities in areas of the UK which have a rich industrial heritage.
The Scottish Government should plan to enable growth in the sectors that are needed to deliver Net Zero, as well as to support those areas that may be adversely impacted.
- The Scottish Government developed and published a Future Skills Action Plan in 2020, and should now provide, five years on, an overview of identified barriers to, and progress on, workforce growth needed to deliver the Net Zero transition.[195] Municipalities like Glasgow and Edinburgh have already established just transition plans, and more support is needed to implement similar plans in locations like Aberdeen and Falkirk, where many workers in industries expected to phase down are located.[196];[197]
- The Scottish Government should work with communities, workers, and businesses to develop proactive transition plans that enable access to secure employment and business opportunities that come with the Net Zero transition.
- The Climate Change (Scotland) Act 2009 (the Act) requires Scotland to align its approach to reducing emissions with a set of just transition principles set out in the Act, which include supporting environmentally and socially sustainable jobs; developing and maintaining social consensus; and contributing to resource efficient and sustainable economic approaches which help address inequality and poverty.
In 2018 the Scottish Government established a Just Transition Commission, tasked to provide independent advice to Ministers on how to maximise the economic and social benefits of decarbonising Scotland, while managing related risks and challenges.
- The Commission’s 2024 Annual Report provides a set of long-term strategic conditions required for a just transition, and critical policy steps for progression in the next 18 months.
- These include a call for the Scottish Government to operationalise just transition principles, in particular to set up regional just transition plans and enhance coordination efforts across 32 local authorities, public bodies, third sector, business, and industry.
- Governance structures to ensure meaningful regional engagement with stakeholders are needed to ensure the Climate Change Plan is consistent with just transition principles, as required by the Act. The Commission’s second term is due to end shortly with no clarity as yet on whether it will be renewed.
| Box 4.1 Case study: Aberdeen and North East Scotland |
|
Irrespective of Net Zero, the oil and gas industry faces a transitional period as oil and gas reserves decline. We conducted a review of the risks and opportunities the transition poses to Aberdeen, and joined Scotland’s Just Transition Commission’s discussions with communities, trade unions, and industry in Aberdeen. Oil and gas has been a key part of the local economy for decades, alongside other industries.
The transition to Net Zero presents emerging opportunities. These are in low-carbon offshore industries for Aberdeen, and jobs in electricity network development and onshore wind.
Realising these low-carbon opportunities while supporting those most affected by the decline of oil and gas requires a clear strategy. This should include ambitious policy and sustained engagement with the local community.
While low-carbon industries present an opportunity for workers, Aberdeen’s economic development must take into account the needs of the local community. Research has found a desire for more diversity in future jobs and supporting the different needs of younger and older workers. Benefits could be more evenly distributed than has been the case with oil and gas, with Aberdeen having one of the highest income inequalities of any city in the UK.[221];[222];[223] |
| Box 4.2 Case study: Grangemouth |
|
The Grangemouth industrial site comprises several facilities producing a range of chemical products, as well as Scotland’s only crude oil refinery.[224] In 2022, before the recent closures, the cluster at Grangemouth produced approximately 3 MtCO2e per year – 0.8 MtCO2e of which was from the oil refinery. The cluster represented 7% of Scotland’s total territorial emissions in 2022, while supporting over 5,000 jobs directly and in the supply chain, and contributing close to £900 million to the economy each year.[225] In 2023, Petroineos announced plans to close the oil refinery at its industrial site in Grangemouth in 2025 and replace it with a fuel import and distribution terminal.[226] The company cited the cost of maintaining an aging facility and reduced demand for the fuels it produces as the main causes of the decision to close the refinery. Ineos also closed its last remaining synthetic ethanol plant at the site in early 2025, again citing reduced demand, increased international competition, and the UK’s high industrial gas prices.[227] The conversion of the oil refinery is expected to lead to approximately 400 direct job losses, with workers and the wider community facing continued uncertainty due to lack of clear timelines for the future of the site.[228];[229] Workers and trade unions have raised concerns about lack of meaningful involvement in decision-making processes, despite ongoing engagement and production of alternative proposals for the site.[230] The UK and Scottish Governments have been developing a plan (‘Project Willow’) to secure Grangemouth’s industrial future. Despite the challenges facing the site having been clear for many years, Project Willow was only formally launched in September 2024, with findings published in early 2025.
Our industry pathway assumes the chemical plants at Grangemouth decarbonise through electrification, CCS and hydrogen, while the transition to Net Zero will drive increased demand for the low-carbon fuels that Project Willow seeks to develop. The transition therefore presents the opportunity of a low-carbon industrial future for sites like Grangemouth, supporting jobs and providing wider economic and social benefits. However, navigating the transition will be challenging.
Realising these benefits will require urgent policy action and strong collaboration between government and industry, with meaningful engagement of affected workers and the local community. This includes:
|
4.3 Other considerations relating to the target-setting criteria
As set out in Table 1.1, the Climate Change (Scotland) Act 2009 requires us to consider multiple criteria. Our considerations for the criteria directly relate to households and the economy are summarised in Table 4.1.
| Table 4.1 Alignment with the target-setting criteria |
|
| Criterion | How the Committee has considered the criterion |
| Fiscal circumstances | In our UK-wide Seventh Carbon Budget advice we set out our assessment of the potential range of public spend each year from 2025 to 2050 for the UK as a whole. We have not produced estimates for Scotland specifically. |
| Social circumstances | Section 4.1 summarises the overarching findings from our analysis of the impacts on costs and savings for 15 household archetypes as a result of changes to driving and home heating from 2025 to 2050.
We also reviewed the potential impacts of the UK’s Net Zero transition on people with protected characteristics across each of the major sectors, which is explored in more detail in our 2025 Supplementary research: Impacts on groups with protected characteristics report. There is an opportunity to reduce inequalities, for example through home energy efficiency measures and falling energy bills reducing fuel poverty and the shift to electric vehicles improving air quality in areas with higher representation of various groups with protected characteristics. However, policy needs to ensure energy efficiency and low-carbon heating measures are accessible and affordable, consider how different groups access flexible energy tariffs, and ensure the provision of charging infrastructure that is accessible to those with disabilities and affordable to those without off-street parking. The Scottish Government should work with the UK Government to communicate a clear vision to the public. This should provide clear, trusted information about the most impactful low-carbon choices for households and businesses in Scotland to reduce emissions and the benefits of low-carbon choices, signposting to available sources of advice and support. |
| Impact on public health |
We expect the transition to Net Zero to deliver improved health outcomes through improved air quality, better insulated homes, increased active travel, and healthier diets, across the whole of the UK.
A reduction in average meat and dairy consumption is compatible with a healthy and nutritionally balanced diet and has the potential to bring positive health impacts. The extent of health benefits will depend on what types of meat and dairy are replaced and what they are replaced with. |
| Impact on remote rural communities and island communities |
Rural households represent 17% of the population in Scotland. Scotland has 790 islands, with 93 currently inhabited. Due to their remoteness and unique geographies, rural and island communities throughout Scotland encounter diverse challenges, enhanced by those related to climate change and the Net Zero transition.[241] As of 2020, the largest industrial sector in terms of private sector employment is ‘agriculture, forestry and fishing’ which accounts for 15% of workers in remote rural areas compared to 12% in accessible rural areas and 0.5% in the rest of Scotland.[242] As described in Section 4.2, the decline in livestock herd sizes will impact farming and employment. At the same time the forestry sector, with many family-owned, small and medium businesses, grows in our pathway and will increase its demand for workers with varied skills.[243] There is therefore an opportunity for farmers to diversify their incomes through alternative land management practices (such as woodland creation and peatland restoration). Government financial support will be needed in some cases to ensure appropriate incentives and returns. As mentioned in Box 4.1, low-carbon offshore industries, electricity network development, and onshore wind offer opportunities for growth and employment. Rural and island communities can be important locations for renewable energy generation. The Highlands and Islands Enterprise five-year strategy aims to make Net Zero a core part of the region’s economy and identifies developing renewable energy capacity as a key opportunity, including offshore wind and marine energy.[244] South of Scotland Enterprise also have a Net Zero strategy and track progress on Net Zero acceleration in their yearly operating plans.[245] We do not assume any demand management for domestic flights or ferries to or from the Scottish islands in our modelling, to avoid adversely affecting connectivity to the UK mainland. Extreme fuel poverty rates are higher for most of the island authorities, with extreme fuel poverty rates in the 2017 to 2019 Scottish House Condition Survey: Local Authority Analysis recorded at 24% for Na h-Eileanan Siar and 22% for Orkney Islands, Shetland Islands and Highland, compared to 12% for Scotland as a whole.[246] Similarly, a 2023 survey of around 2,000 households in the Western Isles estimated that 44% live in extreme fuel poverty conditions.[247]; [248] The transition provides an opportunity to reduce levels of fuel poverty by replacing inefficient oil heating technologies with cleaner and more efficient heat pumps, as well as replacing expensive diesel-generated electricity with renewable grid electricity through increased connectivity to the UK mainland. |
Annex 1: Priority recommendations
| Table A1.1 Priority recommendations to the Scottish Government |
|
| Sector | Recommendations |
| Carbon budgets |
|
| Cross-cutting |
|
| Surface transport |
|
| Agriculture and land use |
|
| Industry |
|
| Buildings |
|
| Waste |
|
Annex 2: The Balanced Pathway in the sectors defined in the Climate Change (Scotland) Act 2009
The Climate Change (Scotland) Act 2009 specifies a set of sector definitions. In this annex, we summarise how these sectors map onto the Climate Change Committee (CCC)-modelled sectors which we have used in this report and in our UK-wide Seventh Carbon Budget advice:
- Agriculture is the same as the CCC’s agriculture sector.
- Business and industrial process is most of the CCC’s industry sector and commercial building emissions from our buildings sector.
- Energy supply is a combination of the CCC’s electricity supply and fuel supply sectors, with a small amount of the CCC’s industry sector and energy from waste from the CCC’s waste sector.
- Land use, land use change and forestry (LULUCF) is the same as the CCC’s land use sector.
- Residential and public (in relation to buildings in those sectors) is the same as the CCC’s residential and non-residential buildings sectors combined but not including commercial buildings and including F-gas aerosols from the CCC’s F-gases sector, recreational use of nitrous oxide from our industry sector, accidental vehicle fires from the CCC’s surface transport sector, and home composting from our waste sector.
- Transport (including international aviation and shipping) is a combination of the CCC’s surface transport, aviation, and shipping sectors but not including emissions from accidental vehicle fires.
- Waste management is the same as the CCC’s waste sector but not including home composting or energy from waste emissions.
Figure A2.1 shows the Balanced Pathway broken down into the sectors defined in the Act.
|
Figure A2.1 Balanced Pathway in Scotland split by Climate Change (Scotland) Act 2009 sector definitions |
|
|
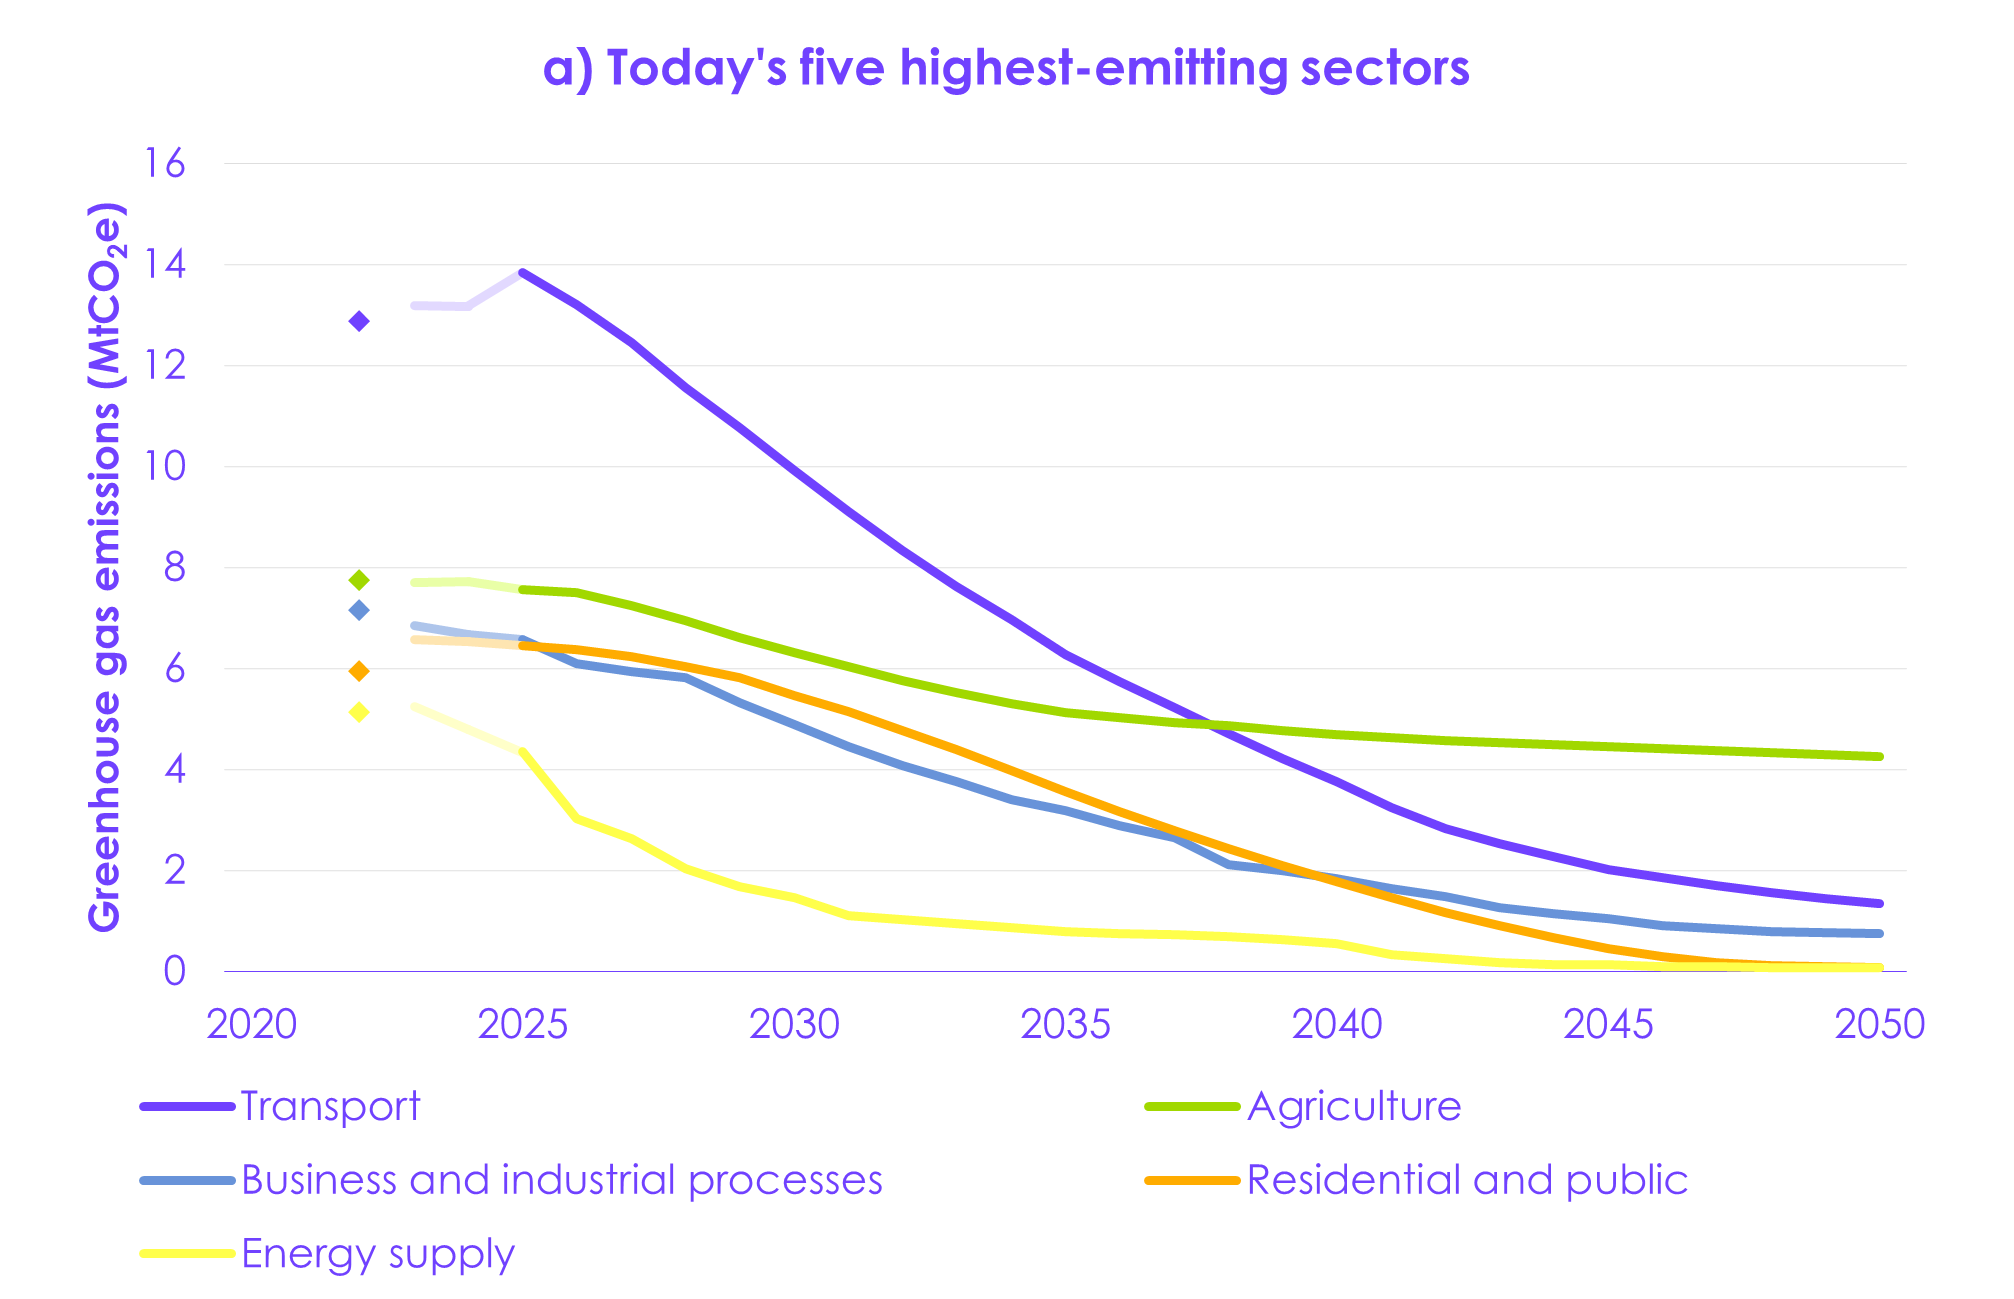
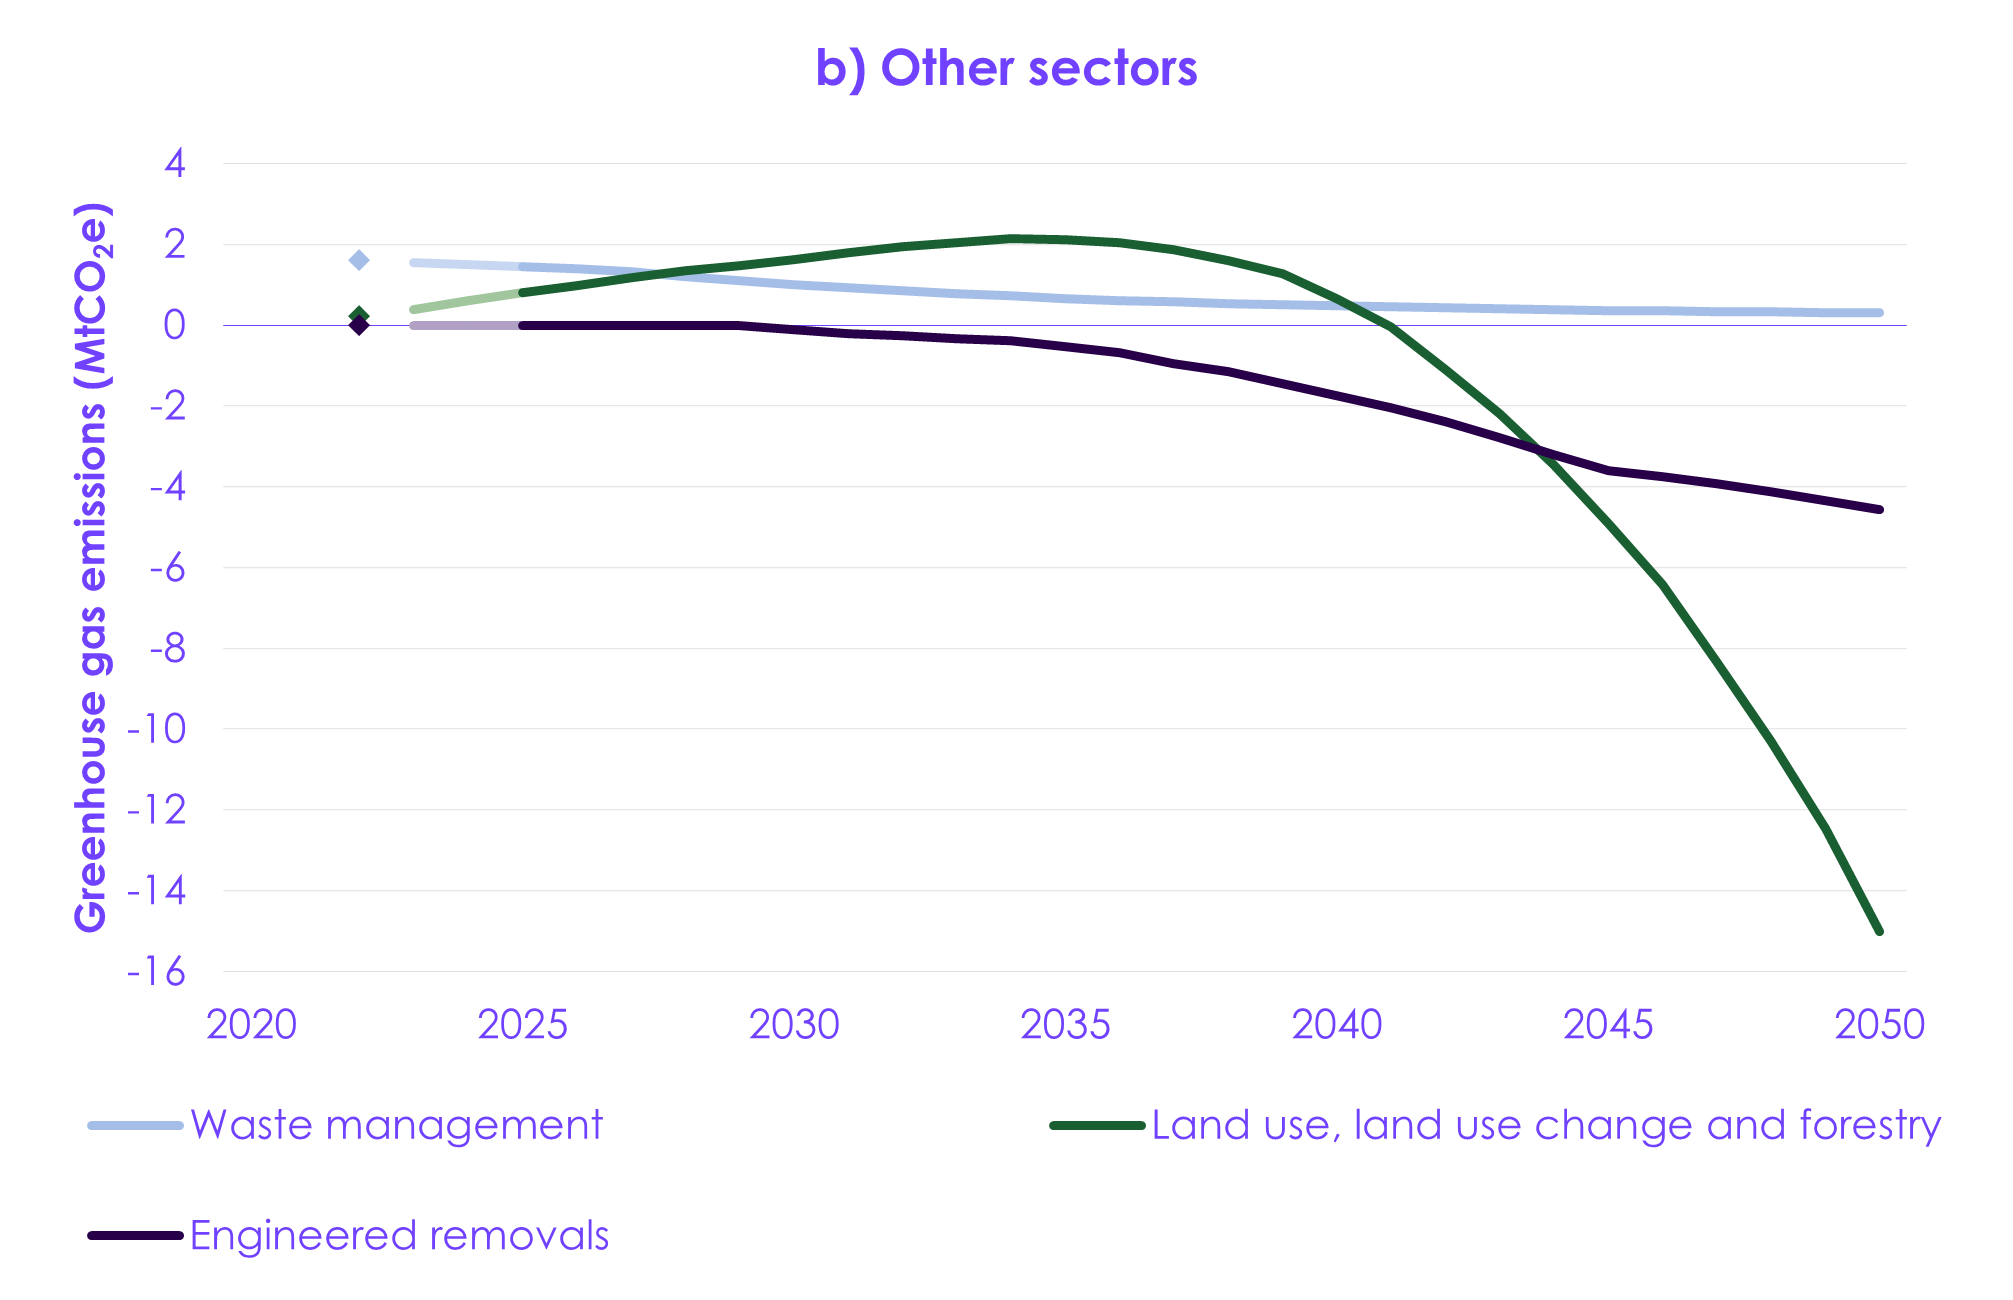
The 2015 Paris Agreement has a single long-term temperature goal: ‘holding the increase in the global average temperature to well below 2°C above pre-industrial levels and pursuing efforts to limit the temperature increase to 1.5°C above pre-industrial levels’.
We define communal systems as covering multiple occupants of a single building and heat networks as systems covering multiple buildings.
Emissions values in this report are stated in terms of the 1990–2022 GHG inventory.
Copernicus Climate Change Service (2025) The 2024 annual climate summary: global climate highlights 2024. https://climate.copernicus.eu/global-climate-highlights-2024.
These estimates are based on the IPCC’s Sixth Assessment Report methodology. Long-term warming refers to the average level of warming over a multi-decadal period, as distinct from the warming observed in a single year (such as that referred to for 2024).
At the time of writing, long-term warming trends have not yet been updated to include 2024 warming data.
Copernicus Climate Change Service (2024) Warmest January on record, 12-month average over 1.5°C above preindustrial. https://climate.copernicus.eu/warmest-january-record-12-month-average-over-15degc-above-preindustrial.
World Meteorological Organization (2024) State of the Global Climate 2023. https://library.wmo.int/idurl/4/68835.
Palazzo Corner, S. et al. (2023) The Zero Emissions Commitment and climate stabilization. Frontiers in Science. https://doi.org/10.3389/fsci.2023.1170744.
Rogelj, J., Schleussner, C.-F., and Hare, W. (2017) Getting it right matters: Temperature goal interpretations in geoscience research. Geophysical Research Letters. https://doi.org/10.1002/2017GL075612.
Forster, P. et al. (2024) Indicators of Global Climate Change 2023: annual update of key indicators of the state of the climate system and human influence. Earth Syst. Sci. https://doi.org/10.5194/essd-16-2625-2024.
Copernicus Climate Change Service (2024) Copernicus: June 2024 marks 12th month of global temperature reaching 1.5°C above pre-industrial. https://climate.copernicus.eu/copernicus-june-2024-marks-12th-month-global-temperature-reaching-15degc-above-pre-industrial.
Copernicus Climate Change Service (2025) The 2024 annual climate summary: global climate highlights 2024. https://climate.copernicus.eu/global-climate-highlights-2024.
‘Overshoot’ refers to the temporary exceedance of a given level of warming, after which temperatures fall back to below that level.
United Nations Environment Programme (2023) Emissions Gap Report 2023: Broken Record – Temperatures hit new highs, yet world fails to cut emissions (again). https://doi.org/10.59117/20.500.11822/43922.
United Nations Environment Programme (2024) Emissions Gap Report 2024: No more hot air … please! With a massive gap between rhetoric and reality, countries draft new climate commitments. https://doi.org/10.59117/20.500.11822/46404.
International Energy Agency (2024) World Energy Outlook 2024. https://www.iea.org/reports/world-energy-outlook-2024.
A tipping point refers to a critical threshold in the Earth’s system or related processes which, if passed, can cause sudden, dramatic, or even irreversible changes to some of the Earth’s largest systems.
Met Office (2023) What do we mean by a climate tipping point? https://www.metoffice.gov.uk/blog/2023/what-do-we-mean-by-a-climate-tipping-point.
Schleussner, C.-F. et al. (2024) Overconfidence in climate overshoot. Nature. https://doi.org/10.1038/s41586-024-08020-9.
Intergovernmental Panel on Climate Change (2021) Summary for Policymakers. Climate Change 2021: The Physical Science Basis. Contribution of Working Group I to the Sixth Assessment Report of the Intergovernmental Panel on Climate Change. https://www.ipcc.ch/report/ar6/wg1/.
Smith, C. et al. (2024) ClimateIndicator/data: Indicators of Global Climate Change 2023 revision (v2024.05.29b). Zenodo. https://doi.org/10.5281/zenodo.11388387.
Intergovernmental Panel on Climate Change (2021) Summary for Policymakers. Climate Change 2021: The Physical Science Basis. Contribution of Working Group I to the Sixth Assessment Report of the Intergovernmental Panel on Climate Change. https://www.ipcc.ch/report/ar6/wg1/.
Crippa et al. (2024) GHG emissions of all world countries. Publications Office of the European Union, Luxembourg. https://doi.org/10.2760/4002897.
Gütschow, J., Busch, D., Pflüger, M. (2024) The PRIMAP-hist national historical emissions time series v2.6 (1750-2023). Zenodo. https://doi:10.5281/zenodo.13752654.
Smith, C. et al. (2024) ClimateIndicator/data: Indicators of Global Climate Change 2023 revision (v2024.05.29b). Zenodo. https://doi.org/10.5281/zenodo.11388387.
Gütschow, J., Busch, D., Pflüger, M. (2024) The PRIMAP-hist national historical emissions time series v2.6 (1750-2023). Zenodo. https://doi:10.5281/zenodo.13752654.
World Bank (2023) Population, Total. https://data.worldbank.org/indicator/SP.POP.TOTL. (Accessed: 10 December 2024).
International Energy Agency (2024) World Energy Outlook 2024. https://www.iea.org/reports/world-energy-outlook-2024.
Bloomberg New Energy Finance (2024) New Energy Outlook 2024. https://about.bnef.com/new-energy-outlook/. (Accessed: 10 December 2024).
United Nations Framework Convention on Climate Change (2024) Nationally determined contributions under the Paris Agreement. Synthesis report by the secretariat. https://unfccc.int/documents/641792.
Riahi, K. et al. (2022) Mitigation pathways compatible with long-term goals. In IPCC, 2022: Climate Change 2022: Mitigation of Climate Change. Contribution of Working Group III to the Sixth Assessment Report of the Intergovernmental Panel on Climate Change. Cambridge University Press, Cambridge, UK and New York, NY, USA. doi:10.1017/9781009157926.005.
O’Neill, B. et al. (2022) Key Risks Across Sectors and Regions. In: Climate Change 2022: Impacts, Adaptation and Vulnerability. Contribution of Working Group II to the Sixth Assessment Report of the Intergovernmental Panel on Climate Change. Cambridge University Press, Cambridge, UK and New York, NY, USA, pp. 2411–2538, doi:10.1017/9781009325844.025.
Burke, M., Hsiang, S., and Miguel, E. (2015) Global non-linear effect of temperature on economic production. Nature 527, 235–239. https://doi.org/10.1038/nature15725.
Trust, S. et al. (2023) The emperor’s new climate scenarios. https://actuaries.org.uk/emperors-new-climate-scenarios.
Trust, S. et al. (2024) Climate scorpion: the sting is in the tail. https://actuaries.org.uk/media/g1qevrfa/climate-scorpion.pdf.
Further information on the international context and the global agreements to address climate change can be found in Chapter 1 of our UK-wide Seventh Carbon Budget advice report.
In January 2025, the United States (which accounts for around 10% of global emissions) announced its intention to withdraw from the Paris Agreement.
Lang, J. et al. (2025) Net Zero Tracker. Energy and Climate Intelligence Unit, Data-Driven EnviroLab, NewClimate Institute, Oxford Net Zero. https://zerotracker.net. (Accessed 31 March 2025).
The White House (2025) Putting America First In International Environmental Agreements. https://www.whitehouse.gov/presidential-actions/2025/01/putting-america-first-in-international-environmental-agreements/.
United Nations Environment Programme (2023) Emissions Gap Report 2023: Broken Record – Temperatures hit new highs, yet world fails to cut emissions (again). https://doi.org/10.59117/20.500.11822/43922.
International Energy Agency (2024) Breakthrough Agenda Report 2024. https://www.iea.org/reports/breakthrough-agenda-report-2024.
International Energy Agency (2024) World Energy Investment 2024. https://www.iea.org/reports/world-energy-investment-2024.
Several organisations project future warming using different methodologies and making different assumptions, particularly on long-term emissions trends. For simplicity, here we refer to warming estimates associated with a 50% probability from the UNEP Emissions Gap Report 2024, rounded to the nearest 0.5ºC to avoid false precision.
The following figures relate to active targets and policies as of 2024.
United Nations Environment Programme (2024) Emissions Gap Report 2024: No more hot air … please! With a massive gap between rhetoric and reality, countries draft new climate commitments. https://doi.org/10.59117/20.500.
International Energy Agency (2024) World Energy Outlook 2024. https://www.iea.org/reports/world-energy-outlook-2024.
United Nations Environment Programme (2015) The Emissions Gap Report 2015. https://www.unep.org/resources/emissions-gap-report-2015.
Met Office (no date) Met Office UK and regional series. https://www.metoffice.gov.uk/research/climate/maps-and-data/uk-and-regional-series.
Met Office (2023) Climate change drives UK’s first year over 10°C. https://www.metoffice.gov.uk/about-us/press-office/news/weather-and-climate/2023/climate-change-drives-uks-first-year-over-10c.
Scottish Environment Protection Agency (2023) Storm Babet brings significant flooding with more rain expected. https://media.sepa.org.uk/media-releases/2023/storm-babet-brings-significant-flooding-with-more-rain-expected.
Kew, S. et al (2024) Autumn and Winter storms over UK and Ireland are becoming wetter due to climate change. https://doi.org/10.25561/111577.
Climate Change (Emissions Reduction Targets) (Scotland) Act 2019, asp 15. https://www.legislation.gov.uk/asp/2019/15/contents. (Accessed: 31 March 2025).
Climate Change (Emissions Reduction Targets) (Scotland) Act 2024, asp 15. https://www.legislation.gov.uk/asp/2024/15/contents. (Accessed: 31 March 2025).
In this report, we base our discussion of sectoral emissions on our CCC sector definitions, which are the sectors in which the modelling was performed and align with the sectors used in our UK-wide Seventh Carbon Budget advice. In Annex 2, we discuss how these sectors correspond to the sectors defined in the Climate Change (Scotland) Act.
These carbon budgets are given as five-year average percentage reductions from the 1990 baseline. The baseline year is 1990 for CO2, methane, and nitrous oxide and 1995 for F-gases. We refer to this as ‘the 1990 baseline’ throughout this advice.
Our baseline generally maintains the stock of low-carbon technologies that exist today (primarily renewable energy and EVs), making adjustments for GDP and population growth.
For Scotland’s population, we use the Office for National Statistics (ONS) 2020-based interim national population projections. In line with the assumptions used in the reference case of the DESNZ October 2023 Energy and Emissions Projections publication, we use the year ending June 2022 international migration variant population scenario published in January 2023. Between 2022 and 2050, population increases, with a peak in 2033, before starting to fall. The population in 2040 is projected to be higher than the population in 2022.
The baseline year is 1990 for CO2, methane, and nitrous oxide and 1995 for F-gases. We refer to this as ‘the 1990 baseline’ throughout this advice.
Intergovernmental Panel on Climate Change (IPCC) (2022) Climate Change 2022: Mitigation of Climate Change. Contribution of Working Group III to the Sixth Assessment Report of the Intergovernmental Panel on Climate Change. https://dx.doi.org/10.1017/9781009157926.
Our baseline generally maintains the stock of low-carbon technologies that exist today (primarily renewable energy and EVs), making adjustments for GDP and population growth.
The headline cost figure assesses the whole-economy cost in Scotland until 2050, rather than 2045 when Scotland reaches Net Zero in the Balanced Pathway. This is to reflect the continued transition in many sectors, and to ensure consistency with the UK report and reports for other devolved nations.
GDP calculations use the latest short- and long-term GDP projections from the Scottish Fiscal Commission (SFC). Our calculations express the average of the in-year net cost as a proportion of Scotland’s in-year GDP.
Scottish Fiscal Commission (SFC) (2024) Scotland’s Economic and Fiscal Forecasts. https://fiscalcommission.scot/publications/scotlands-economic-and-fiscal-forecasts-december-2024/.
Scottish Fiscal Commissions (SFC) (2022) Trends in Scotland population and effects on the economy and income tax. https://fiscalcommission.scot/publications/trends-in-scotlands-population-and-effects-on-the-economy-and-income-tax/.
Electricity costs in Scotland are determined by scaling down the cost of decarbonising the current GB system by Scotland’s share of GB electricity demand. The cost of expanding the system to meet additional demand from other sectors (including residential buildings and surface transport) is counted in the operating costs of the sector which is using the energy.
1993 used for comparison of car numbers due to data availability.
Office for National Statistics (2024) Scotland population mid-year estimate. https://www.ons.gov.uk/peoplepopulationandcommunity/populationandmigration/populationestimates/timeseries/scpop/pop.
Transport Scotland (2023) Scottish transport statistics 2023. Table 1.2: https://www.transport.gov.scot/publication/scottish-transport-statistics-2023/chapter-1-road-transport-vehicles/.
Department for Transport (2024) VEH1103: Vehicle licensing statistics data tables. https://www.gov.uk/government/statistical-data-sets/vehicle-licensing-statistics-data-tables.
Department for Transport (2024) VEH1153: Vehicle licensing statistics data tables. https://www.gov.uk/government/statistical-data-sets/vehicle-licensing-statistics-data-tables.
Department for Transport (2024) VEH1103: Vehicle licensing statistics data tables. https://www.gov.uk/government/statistical-data-sets/vehicle-licensing-statistics-data-tables.
Charge point numbers for 2022 and 2023 are based on data from January 2023 and January 2024 respectively.
Department for Transport (2024) Electric vehicle public charging infrastructure statistics: July 2024. https://www.gov.uk/government/statistics/electric-vehicle-public-charging-infrastructure-statistics-july-2024/electric-vehicle-public-charging-infrastructure-statistics-july-2024.
Department for Transport (2024) VEH1153: Vehicle licensing statistics data tables. https://www.gov.uk/government/statistical-data-sets/vehicle-licensing-statistics-data-tables.
Department for Transport (2024) VEH1153: Vehicle licensing statistics data tables. https://www.gov.uk/government/statistical-data-sets/vehicle-licensing-statistics-data-tables.
Department for Transport (2024) VEH1107: Vehicle licensing statistics data tables. https://www.gov.uk/government/statistical-data-sets/vehicle-licensing-statistics-data-tables#all-vehicles.
Department for Transport (2024) Electric vehicle public charging infrastructure statistics: July 2024. https://www.gov.uk/government/statistics/electric-vehicle-public-charging-infrastructure-statistics-july-2024/electric-vehicle-public-charging-infrastructure-statistics-july-2024.
Transport Scotland (2024) Plan to add 24,000 public electric vehicle charge points by 2030 published. https://www.transport.gov.scot/news/plan-to-add-24-000-public-electric-vehicle-charge-points-by-2030-published/.
Department for Transport (2021) UK confirms pledge for zero-emission HGVs by 2040 and unveils new chargepoint design. https://www.gov.uk/government/news/uk-confirms-pledge-for-zero-emission-hgvs-by-2040-and-unveils-new-chargepoint-design.
Mobilität in Deutschland (2017) Mobilität in tabellen. https://mobilitaet-in-tabellen.dlr.de/login.html?brd.
CBS StatLine (2024) Mobility; per person, modes of travel, purposes of travel and regions. https://opendata.cbs.nl/statline/#/CBS/en/dataset/84710ENG/table?ts=1695198666028.
Transport Scotland (2024) 20% reduction in car km by 2030. https://www.transport.gov.scot/our-approach/environment/20-reduction-in-car-km-by-2030/.
Department for Transport (no date) Road traffic statistics: Scotland. https://roadtraffic.dft.gov.uk/regions/3. (Accessed: 1 April 2025).
Transport Scotland (no date) Scottish ultra-low emission bus scheme – completed bids. https://www.transport.gov.scot/public-transport/buses/scottish-ultra-low-emission-bus-scheme/scottish-ultra-low-emission-bus-scheme-completed-bids/. (Accessed: 1 April 2025).
Department for Transport (2024) VEH1153: Vehicle licensing statistics data tables. https://www.gov.uk/government/statistical-data-sets/vehicle-licensing-statistics-data-tables.
Audit Scotland (2023) Investing in Scotland’s infrastructure – A briefing paper. https://audit.scot/uploads/docs/report/2023/briefing_230928_scotlands_infrastructure.pdf.
Scottish Government (2024) Letter to Convener of the Net Zero Committee. https://www.parliament.scot/-/media/files/committees/net-zero-energy-and-transport-committee/correspondence/2024/cabsectransportscotrail-hst-fleet-replacement-rail-services-decarbonisation-action-plan-refresh-17-d.pdf.
Department for Transport (2021) Rail environment policy statement. https://assets.publishing.service.gov.uk/media/60eee7498fa8f50c7f08ae4b/rail-environment-policy-statement.pdf.
Transport Scotland (2024) Transport and travel in Scotland 2023. https://www.transport.gov.scot/publication/transport-and-travel-in-scotland-2023/.
Scottish Government (2024) Results from the Scottish Agricultural Census: June 2024. https://www.gov.scot/publications/results-from-the-scottish-agricultural-census-june-2024/documents/.
Average UK meat, red meat and dairy consumption falls by 20%, 25%, and 20% respectively by 2035 compared to 2019, which is in line with our UK Balanced Pathway.
Department for Environment, Food and Rural Affairs (2024) Family food survey. https://www.gov.uk/government/statistics/family-food-fye-2023.
Pastorino et al. (2023) The future of meat and dairy consumption in the UK: exploring different policy scenarios to meet net zero targets and improve population health. https://www.cambridge.org/core/journals/global-sustainability/article/future-of-meat-and-dairy-consumption-in-the-uk-exploring-different-policy-scenarios-to-meet-net-zero-targets-and-improve-population-health/8F4D09F2A88EF2FA16E2E237B5F30B21.
Quality Meat Scotland (2024) The Scottish Red Meat Industry Profile. https://s3.eu-west-2.amazonaws.com/quality-meat-scotland/documents/Publications/QMS-RMIP-2024.pdf.
Nitrous oxide emissions from lowland cropland peat are reported in the greenhouse gas inventory for the agricultural sector. Methane and CO2 emissions on this type of peatland are reported in the land use, land use change and forestry (LULUCF) sector in the inventory.
We are cautious in our estimation of soil emissions from woodland establishment. Appropriate siting away from organic soils and low disturbance planting techniques could represent opportunity to reduce these emissions.
Scottish Government (2020) Securing a green recovery on a path to net zero: climate change plan 2018-2032 – update. https://www.gov.scot/publications/securing-green-recovery-path-net-zero-update-climate-change-plan-20182032/documents/.
Scottish Government (2024) Record high peatland restoration. https://www.gov.scot/news/record-high-peatland-restoration/.
Scotland’s Farm Advisory Service (2024) Peatland Restoration – Your Most Pressing Questions Answered. https://www.fas.scot/article/peatland-restoration-your-most-pressing-questions-answered/.
Scottish Government (2019) Scotland’s Forestry Strategy 2019–2029. https://www.gov.scot/publications/scotlands-forestry-strategy-20192029/documents/.
This peak planting area includes 15% additional area of open ground to increase biodiversity in the landscape.
Establishment of energy crops is shared proportionately across Scotland, England and Northern Ireland based on available, suitable land for planting. Energy crops are not applied to Wales due to lack of availability of suitable land.
When selecting species, consideration should be given to future climate change. This may mean species local to the region or identifying suitable sub-species that can impart resilience to drought and warmer temperatures. Invasive species should be avoided.
Forestry Commission (2024) Woodland management matters: Ensuring the future health and resilience of our woodlands. https://www.gov.uk/government/publications/woodland-management-matters-ensuring-the-future-health-and-resilience-of-our-woodlands/woodland-management-matters-ensuring-the-future-health-and-resilience-of-our-woodlands.
‘Other industry’ is a miscellaneous category comprising a wide range of manufacturing, such as electrical and mechanical engineering.
Department for Energy Security and Net Zero (2024) Enabling Industrial Electrification. Call for evidence on fuel-switching to electricity: Summary of responses. https://assets.publishing.service.gov.uk/media/66e013650f4ba0621b086702/electrification-call-for-evidence-formal-summary-of-responses.pdf.
Department for Energy Security and Net Zero (2025) Plans for future of Grangemouth. https://www.gov.uk/government/news/plans-for-future-of-grangemouth.
Department for Energy Security and Net Zero (2025) Household Energy Efficiency Statistics. https://www.gov.uk/government/collections/household-energy-efficiency-national-statistics.
Department for Energy Security and Net Zero (2024) Raising product standards for space heating consultation. https://www.gov.uk/government/consultations/raising-product-standards-for-space-heating.
Scottish Government (2025) Scottish House Condition Survey: 2023 Key Findings. https://www.gov.scot/publications/scottish-house-condition-survey-2023-key-findings/pages/1-key-attributes-of-the-scottish-housing-stock/.
Scottish Government (2025) Meeting of the Parliament, Tuesday, March 11, 2025. https://www.parliament.scot/chamber-and-committees/official-report/search-what-was-said-in-parliament/meeting-of-parliament-11-03-2025?meeting=16309&iob=139313#orscontributions_M5578E429P765C2666341.
Scottish Government (2025) Meeting of the Parliament, Tuesday, March 11, 2025. https://www.parliament.scot/chamber-and-committees/official-report/search-what-was-said-in-parliament/meeting-of-parliament-11-03-2025?meeting=16309&iob=139313#orscontributions_M5578E429P765C2666341.
Department for Energy Security and Net Zero (2024) Digest of UK Energy Statistics (DUKES): petroleum – Gas flared and vented by oil and gas fields and terminals (DUKES E.1). https://www.gov.uk/government/statistics/petroleum-chapter-3-digest-of-united-kingdom-energy-statistics-dukes.
North Sea Transition Authority (2024) Oil and Gas Projections and Latest DESNZ and CCC Demand Projections. https://www.nstauthority.co.uk/data-and-insights/insights-and-analysis/production-and-expenditure-projections/.
National Atmospheric Emissions Inventory (2023) UK Greenhouse Gas Inventory, 1990 to 2021, Section 1.8.2.3. https://naei.energysecurity.gov.uk/reports/uk-greenhouse-gas-inventory-1990-2021-annual-report-submission-under-framework-convention.
North Sea Transition Authority (2024) OGA Plan to reduce UKCS greenhouse gas emissions. https://www.nstauthority.co.uk/regulatory-information/regulatory-framework/the-oga-strategy/oga-plan-emissions-reduction/.
North Sea Transition Authority (no date) Decommissioning. https://www.nstauthority.co.uk/regulatory-information/decommissioning/. (Accessed: 9 April 2025).
Offshore Petroleum Regulator for Environment and Decommissioning (2025) Oil & Gas: decommissioning of offshore installations & pipelines. https://www.gov.uk/guidance/oil-and-gas-decommissioning-of-offshore-installations-and-pipelines.
Crown Estate Scotland (2024) Revised Sector Marine Plan timelines. https://www.crownestatescotland.com/scotlands-property/offshore-wind/intog-leasing-round.
Scottish Government (2022) Initial Plan Framework for Sectoral Marine Plan. https://www.gov.scot/publications/initial-plan-framework-sectoral-marine-plan-offshore-wind-innovation-targeted-oil-gas-decarbonisation-intog/.
North Sea Transition Authority (2024) OGA Plan to reduce UKCS greenhouse gas emissions. oga-plan-to-reduce-ukcs-greenhouse-gas-emissions.pdf.
Scottish Government (2021) Climate change – Leadership in the public sector. https://www.gov.scot/policies/climate-change/decarbonisation-in-the-public-sector/.
Scottish Government (2024) GDP Quarterly National Accounts: 2023 Quarter 4 (October to December) – GDP in volume terms by industry. https://www.gov.scot/publications/gdp-quarterly-national-accounts-2023-q4/documents/.
We have used the UK Department for Transport’s (DfT) emissions model as the starting point for our pathway (other than for naval shipping and inland waterways and leisure shipping, which are not included in DfT’s emissions model and are based on the greenhouse gas inventory). In line with previous CCC recommendations, the Balanced Pathway measures international shipping emissions based on the movements of ships on international voyages. This differs from the approach based on the sale of bunker fuels in the UK that is currently used in the inventory. The Balanced Pathway uses more recent activity data (from 2019) for most domestic shipping than is used for the inventory. Due to these differences, the proportion of emissions allocated to each devolved administration differs between DfT’s and the inventory’s accounting approaches. We have used DfT’s accounting approach as we expect the inventory to adopt a similar methodology for domestic shipping in the near future. As a result, our starting point for shipping emissions is slightly higher than in the inventory. The emissions reductions between 2022 and future years are calculated based on DfT’s accounting approach.
Scottish Environment Protection Agency (no date) Waste data for Scotland. https://www.sepa.org.uk/environment/waste/waste-data/waste-data-reporting/waste-data-for-scotland/. (Accessed: 9 April 2025).
Scottish Environment Protection Agency (no date) Scottish Landfill Tax. https://www.sepa.org.uk/regulations/waste/scottish-landfill-tax/. (Accessed: 9 April 2025).
Scottish Government (2024) Waste Incinerated in Scotland 2023. https://data.gov.scot/sepa/waste/incinerated.html.
Scottish Government (2022) Putting limits on incineration. https://www.gov.scot/news/putting-limits-on-incineration-capacity/.
Tolvik (2024) UK Energy from Waste Statistics – 2023. https://www.tolvik.com/published-reports/view/uk-energy-from-waste-statistics-2023/.
Tolvik (2024) UK Energy from Waste Statistics – 2023. https://www.tolvik.com/published-reports/view/uk-energy-from-waste-statistics-2023/.
Department for Environment, Food and Rural Affairs (2024) UK statistics on waste. https://www.gov.uk/government/statistics/uk-waste-data/uk-statistics-on-waste.
Scottish Government (no date) Managing Waste. https://www.gov.scot/policies/managing-waste/food-waste/. (Accessed: 9 April 2025).
Scottish Environment Protection Agency (no date) Biodegradable municipal waste landfill ban. https://www.sepa.org.uk/regulations/waste/landfill/biodegradable-municipal-waste-landfill-ban/. (Accessed: 9 April 2025).
Acorn (no date) Scottish Cluster. https://theacornproject.uk/scottish-cluster. (Accessed: 9 April 2025).
Department for Energy Security and Net Zero (2023) CCUS Cluster Sequencing Track-2: Market update December 2023. https://www.gov.uk/government/publications/cluster-sequencing-for-carbon-capture-usage-and-storage-ccus-track-2/ccus-cluster-sequencing-track-2-market-update-december-2023.
Scottish Government (2024) Scotland’s circular economy and waste route map to 2030. https://www.gov.scot/binaries/content/documents/govscot/publications/strategy-plan/2024/12/scotlands-circular-economy-waste-route-map-2030/documents/scotlands-circular-economy-waste-route-map-2030/scotlands-circular-economy-waste-route-map-2030/govscot%3Adocument/scotlands-circular-economy-waste-route-map-2030.pdf.
Department for Energy Security and Net Zero (2023) Traded carbon values used for modelling purposes. https://www.gov.uk/government/publications/traded-carbon-values-used-for-modelling-purposes-2023.
Department for Transport (2024) Advanced Fuel Fund (AFF) competition winners. https://www.gov.uk/government/publications/advanced-fuels-fund-competition-winners/advanced-fuels-fund-aff-competition-winners.
Highlands and Islands Airports Limited (2023) Strategic Plan 2023-28. https://www.hial.co.uk/downloads/file/662/hial-strategic-plan-2023-28.
BBC (2024) Loganair exploring use of hybrid-electric aircraft. https://www.bbc.co.uk/news/articles/c2edyvmzjdxo.
Our pathway includes an important role for electrolytic hydrogen, which can be used to fuel hydrogen turbines. When this is produced from zero-carbon electricity there are no associated CO2 emissions.
In the modelling commissioned for this report, technologies are deployed and dispatched at a plant level to give the economically optimal, least-cost GB-wide system subject to the Government’s Green Book carbon values. As a result, the outputted location of low-carbon dispatchable power stations in Scotland is influenced by a range of factors, including Scotland’s relative electricity demand, generation from other sources, network constraints, and the availability of CCS and hydrogen infrastructure.
The baseline year is 1995 for F-gases.
European Union (2015) The Fluorinated Greenhouse Gases Regulations 2015. https://www.legislation.gov.uk/uksi/2015/310/contents.
Black Bull Biochar (no date). Biochar Field Trials – Case Study. https://www.blackbullbiochar.com/biochar-field-trials. (Accessed: 27 February 2025).
UNDO Carbon (2024) Field Notes: The Importance of Weather in Enhanced Rock Weathering. https://un-do.com/resources/blog/field-notes-the-importance-of-weather-in-enhanced-rock-weathering/. (Accessed: 27 February 2025).
Smith, S. et al (2024) The state of carbon dioxide removal 2024 – 2nd Edition. https://www.stateofcdr.org/.
Department for Business, Energy and Industrial Strategy (2021) Greenhouse gas removal methods: technology assessment report. https://www.gov.uk/government/publications/greenhouse-gas-removal-methods-technology-assessment-report.
Transport Scotland (no date) Bus Partnership Fund. https://www.transport.gov.scot/public-transport/buses/bus-partnership-fund/. (Accessed: 1 April 2025).
The City of Edinburgh Council (no date) City centre transformation. https://www.edinburgh.gov.uk/roads-travel-parking/city-centre-transformation. (Accessed: 1 April 2025).
Glasgow City Council (2025) Glasgow’s Low Emission Zone. https://www.glasgow.gov.uk/article/4985/Glasgow-s-Low-Emission-Zone.
George, M.M. et al (2024) Effect of SeaFeed, a canola oil infused with Asparagopsis armata, on methane emissions, animal health, performance, and carcass characteristics of Angus feedlot cattle. https://academic.oup.com/tas/article/doi/10.1093/tas/txae116/7726778.
Ahmed, E. and Nishida, T. (2024) The anti-methanogenic efficacy of Asparagopsis armata: Could it be attributable solely to its bromoform content? https://www.sciencedirect.com/science/article/abs/pii/S0377840124002463.
While overall car-kilometres continue to grow, modal shift reduces the growth rate compared to the baseline.
In our analysis, most households in Scotland (approximately 75%) switch to a heat pump by 2050. A smaller number of households, particularly homes where heat pumps may not be an appropriate solution, will install other measures such as direct electric heating or district heating using a low-carbon heating source.
Scottish Government (2024) Scottish House Condition Survey: 2022 Key Findings. https://www.gov.scot/publications/scottish-house-condition-survey-2022-key-findings/pages/1-key-attributes-of-the-scottish-housing-stock/.
The Energy Advisory Service (2024) Affordable warmth at home in the Western Isles. https://tighean.co.uk/wp-content/uploads/2024/06/Warmth-Booklet-2024.pdf.
We define communal systems as covering multiple occupants of a single building and heat networks as systems covering multiple buildings.
Kennedy, J. et al. (2025) Impact of reducing meat and dairy consumption on nutrient intake, health, cost of diets and the environment: A simulation among adults in Scotland. https://www.researchsquare.com/article/rs-5820769/v1.
Quality Meat Scotland (2024) The Scottish Red Meat Industry. https://s3.eu-west-2.amazonaws.com/quality-meat-scotland/documents/Publications/QMS-RMIP-2024.pdf.
Scottish Government (2019) Red meat exports: potential administrative costs of trade under WTO rules. https://www.gov.scot/publications/potential-administrative-cost-implications-scotlands-red-meat-sector-exports-trading-european-union-under-world-trade-organisation-rules/pages/11/.
Scottish Parliament (2024) Scottish Parliament’s People Panel reviewing the Climate Change (Scotland) Act 2009. https://www.parliament.scot/-/media/files/committees/net-zero-energy-and-transport-committee/correspondence/2024/scottish-parliament-peoples-panel-report-sp-paper-564.pdf.
Department for Transport (2022) Vehicle licensing statistics data tables. https://www.gov.uk/government/statistical-data-sets/vehicle-licensing-statistics-data-tables.
Department for Transport (2023) Road traffic statistics. https://roadtraffic.dft.gov.uk/regions.
We calculate saving from 2025 until 2050 (rather than 2045) as in our modelling some households are still installing their first low-carbon heating system between 2045 and 2050.
Scottish Government (2024) Scotland’s Census 2022 – Housing. https://www.scotlandscensus.gov.uk/2022-results/scotland-s-census-2022-housing/.
Office for National Statistics (2023) Housing, England and Wales: Census 2021. https://www.ons.gov.uk/peoplepopulationandcommunity/housing/bulletins/housingenglandandwales/census2021#:~:text=In%202021%2C%2021.7%25%20(5.4,other%20mobile%20or%20temporary%20structure.
Scottish Government (2022) Scottish Government Urban Rural Classification 2020. https://www.gov.scot/publications/scottish-government-urban-rural-classification-2020/documents/.
Fuel poverty is a devolved policy area and is defined and measured differently in different parts of the UK. Scottish legislation describes a household as fuel poor if more than 10% of net income is required to pay for their fuel needs after housing costs have been deducted, and the remaining income is not enough to maintain an acceptable standard of living (defined as at least 90% of the UK Minimum Income Standard once childcare costs and disability or care benefits are deducted).
Scottish Government (2024) Scottish House Condition Survey: 2022 Key Findings. https://www.gov.scot/publications/scottish-house-condition-survey-2022-key-findings/pages/3-fuel-poverty/.
The Energy Advisory Service (2024) Affordable warmth at home in the Western Isles. https://tighean.co.uk/wp-content/uploads/2024/06/Warmth-Booklet-2024.pdf.
North Sea Transition Authority (2024) March 2024 Oil and gas production projections and latest DESNZ and CCC demand projections. https://www.nstauthority.co.uk/data-and-insights/insights-and-analysis/production-and-expenditure-projections/.
Office for National Statistics (2024) Regional gross value added (balanced) by industry: all ITL regions. https://www.ons.gov.uk/economy/grossvalueaddedgva/datasets/nominalandrealregionalgrossvalueaddedbalancedbyindustry.
Office for National Statistics (2024) Regional gross value added (balanced) by industry: all ITL regions. https://www.ons.gov.uk/economy/grossvalueaddedgva/datasets/nominalandrealregionalgrossvalueaddedbalancedbyindustry.
Office for National Statistics (2024) Regional gross value added (balanced) by industry: all ITL regions. https://www.ons.gov.uk/economy/grossvalueaddedgva/datasets/nominalandrealregionalgrossvalueaddedbalancedbyindustry.
Office for National Statistics (2024) Workforce jobs by region and industry. https://www.ons.gov.uk/employmentandlabourmarket/peopleinwork/employmentandemployeetypes/datasets/workforcejobsbyregionandindustryjobs05.
Office for National Statistics (2024) Regional gross value added (balanced) by industry: all ITL regions. https://www.ons.gov.uk/economy/grossvalueaddedgva/datasets/nominalandrealregionalgrossvalueaddedbalancedbyindustry.
Acorn (no date) Scottish Cluster. https://theacornproject.uk/scottish-cluster. (Accessed: 31 March 2025).
Scottish Government (2019) Decarbonising Scotland’s industrial sectors and sites. https://www.gov.scot/binaries/content/documents/govscot/publications/progress-report/2019/04/decarbonising-scotlands-industrial-sectors-sites-paper-discussion-scottish-energy-intensive-industries/documents/decarbonising-scotlands-industrial-sectors-sites/decarbonising-scotlands-industrial-sectors-sites/govscot%3Adocument/decarbonising-scotlands-industrial-sectors-sites.pdf.
North Sea Transition Authority (2024) Production and expenditure projections. https://www.nstauthority.co.uk/data-and-insights/insights-and-analysis/production-and-expenditure-projections/. (Accessed: 10 March 2025).
Scottish Government, EY (2023) Just Transition Review of the Scottish Energy Sector. https://www.energy-system-and-just-transition-independent-analysis.co.uk/summary-report-portrait.pdf.
Scottish Government, EY (2023) Just Transition Review of the Scottish Energy Sector.https://www.energy-system-and-just-transition-independent-analysis.co.uk/summary-report-portrait.pdf.
HM Revenue and Customs (HMRC)(2019) UK Regional Trade in Goods Statistics. https://www.uktradeinfo.com/media/mlmpx5dd/rts_q4_2019.pdf.
Scottish Government, EY (2023) Just Transition Review of the Scottish Energy Sector. https://www.energy-system-and-just-transition-independent-analysis.co.uk/summary-report-portrait.pdf.
UK Extractive Industries Transparency Initiative (EITI) (no date) Oil & Gas in the UK. https://www.ukeiti.org/oil-gas. (Accessed: 27 February 2025).
Scottish Government, EY (2023) Just Transition Review of the Scottish Energy Sector. https://www.energy-system-and-just-transition-independent-analysis.co.uk/summary-report-portrait.pdf.
UK Government (2025) Prime Minister announcement on Grangemouth. https://www.gov.uk/government/news/prime-minister-announcement-on-grangemouth.
World Wide Fund for Nature (WWF) (2023) The impact of extreme weather events on Scottish agriculture. https://www.wwf.org.uk/our-reports/impact-extreme-weather-events-scottish-agriculture.
Adaptation Scotland (2024) Land use and climate change adaptation in Scotland: Insights report. https://adaptation.scot/take-action/land-use-climate-change-adaptation-scotland-insights-report/.
Scottish Environment LINK (2023) Farm for Scotland’s future: the case for change. https://farmforscotlandsfuture.scot/wp-content/uploads/2023/04/Farm-for-Scotlands-Future-full-report.pdf.
Quality Meat Scotland (2024) The Scottish Red Meat Industry. https://s3.eu-west-2.amazonaws.com/quality-meat-scotland/documents/Publications/QMS-RMIP-2024.pdf.
Scottish Government (2019) Red meat exports: potential administrative costs of trade under WTO rules. https://www.gov.scot/publications/potential-administrative-cost-implications-scotlands-red-meat-sector-exports-trading-european-union-under-world-trade-organisation-rules/pages/11/.
Department for Business and Trade (2023) Business population estimates 2023. https://www.gov.uk/government/statistics/business-population-estimates-2023.
Scottish Government (2021) Future skills: action plan. https://www.gov.scot/publications/scotlands-future-skills-action-plan/pages/17/.
Glasgow City Council (2024) Glasgow Just Transition Skills Action Plan. https://www.glasgow.gov.uk/media/8689/Just-Transition-Skills-Action-Plan/pdf/Just_Transition_Skills_Action_Plan.pdf?m=1700491001260.
City of Edinburgh Council (2021) 2030 Climate Strategy. https://www.edinburgh.gov.uk/downloads/file/30785/2030-climate-strategy-executive-summary.
Aberdeen City Council (2021) Aberdeen Economic Report 2021. https://www.aberdeencity.gov.uk/sites/default/files/2021-12/Aberdeen%20Economic%20Report%202021%20Final_1.pdf.
UK Extractive Industries Transparency Initiative (EITI) (no date) Sector Data. https://www.ukeiti.org/sector-data. (Accessed: 11 December 2024).
Carbon Brief (2023) Analysis: UK would need less imported gas under a Labour government. https://www.carbonbrief.org/analysis-uk-would-need-less-imported-gas-under-a-labour-government/.
Shapovalova D. et al. (2023) Measuring Just Transition: Indicators and scenarios for a Just Transition in Aberdeen and Aberdeenshire. https://aura.abdn.ac.uk/handle/2164/22364.
Centre for Cities (2024) Cities Outlook. https://www.centreforcities.org/wp-content/uploads/2024/01/Cities-Outlook-2024.pdf.
Aberdeen City Council Anti-Poverty and Inequality Committee (2023) Demographic information on child poverty, in-work poverty and other forms of poverty in the city. https://committees.aberdeencity.gov.uk/mgConvert2PDF.aspx?ID=141495.
Energy Skills Intelligence Hub (no date) UK Energy Sector at a Glance. http://www.energyskillshub.co.uk/dashboard/. (Accessed: 15 April 2025).
Fraser of Allander Institute (2023) The Economic Impact of Scotland’s Renewable Energy Sector – 2023 Update. https://fraserofallander.org/wp-content/uploads/2023/12/FINAL-The-Economic-Impact-of-Scotlands-Renewable-Energy-Sector-1.pdf.
Scottish Development International (2024) Realising Scotland’s potential in floating wind energy. https://www.sdi.co.uk/news/realising-scotland-s-potential-in-floating-wind-energy. (Accessed: 11 December 2024).
Curran B. et al. (2022) Growing clean: Identifying and investing in sustainable growth opportunities across the UK. https://economy2030.resolutionfoundation.org/wp-content/uploads/2022/05/Growing_clean_report.pdf.
Offshore Wind Scotland (no date) Floating Wind in Scotland. https://www.offshorewindscotland.org.uk/the-offshore-wind-market-in-scotland/floating-wind-in-scotland/. (Accessed: 11 December 2024).
Renewable UK (2024) Floating Wind: Anchoring the next generation offshore. https://www.renewableuk.com/media/scccdrxe/floating-offshore-wind-2050-vision-final.pdf.
Element Energy and Vivid Economics (2021) CCUS Economics Impacts Study. https://www.scottish-enterprise.com/media/jhic3qav/ccus-economic-impact-assessment-report.pdf.
London School of Economics and Political Science (LSE) (2021) Siezing sustainable growth opportunities from carbon capture, usage and storage in the UK. https://www.lse.ac.uk/granthaminstitute/wp-content/uploads/2021/09/Seizing-Sustainable-Growth-Opportunities-from-CCUS-in-the-UK_FULL-REPORT-1.pdf.
Energy Transition Institute (2022) Making the Switch. https://www.rgueti.com/wp-content/uploads/2022/06/Making-the-switch-images.pdf.
Scottish Government Scotland’s Marine Economic Statistics 2021. https://www.gov.scot/publications/scotlands-marine-economic-statistics-2021/pages/13/. (Accessed: 11 December 2024).
Department for International Trade (2022) Floating Offshore Wind Manufacturing. https://www.offshorewindscotland.org.uk/media/13289/hpo-floating-offshore-wind-manufacturing-in-scotland.pdf.
The Institution of Engineering and Technology (2021) IET skills for net zero and a green recovery. https://www.theiet.org/media/8787/iet-skills-for-net-zero-and-a-green-recovery-summary.pdf.
Scottish Government (2025) Energy skills passport. https://www.gov.scot/news/energy-skills-passport/.
Scottish Government (2023) Economy and Fair Work Committee. https://www.parliament.scot/api/sitecore/CustomMedia/OfficialReport?meetingId=15554.
Just Transition Commission (2024) Grangemouth Oil Refinery: Workers’ Perspectives. https://www.justtransition.scot/publication/the-grangemouth-refinery-closure-workers-perspectives/.
Just Transition Commission (2024) Conditions for Success: Annual Report 2024. https://www.justtransition.scot/publication/conditions-for-success-annual-report-2024/.
International Renewable Energy Agency (2023) Finding common ground for a just energy transition. https://www.irena.org/-/media/Files/IRENA/Agency/Publication/2023/Aug/IRENA_Coalition_Just_transition_2023.pdf.
Just Transition Lab (2023) Just transition for workers and communities in Aberdeen and Aberdeenshire: Rapid evidence assessment report. https://www.abdn.ac.uk/media/site/geosciences/documents/JT_Aberdeen_Aberdeenshire_Phase_1.pdf.
Lee, N., Sissons, P., and Jones, K. (2015) The geography of wage inequality in British cities. Regional Studies. https://eprints.lse.ac.uk/62134/1/The_geography_of_combined.pdf.
Institute for Fiscal Studies (2023) Earnings and income inequality. https://ifs.org.uk/sites/default/files/2023-07/IFS%20Slides%20RSE%20event%20-%20Labour%20market%20and%20income%20inequalities.pdf.
Scottish Government (2024) Grangemouth Industrial Cluster – draft Just Transition plan: consultation. https://www.gov.scot/publications/grangemouth-industrial-transition-plan-supporting-fair-transition-scotlands-core-manufacturing-cluster-draft-consultation/documents/.
Scottish Government (2024) Grangemouth Industrial Cluster – draft Just Transition plan: consultation. https://www.gov.scot/publications/grangemouth-industrial-transition-plan-supporting-fair-transition-scotlands-core-manufacturing-cluster-draft-consultation/documents/.
Department for Energy Security and Net Zero (2024) UK and Scottish governments announce joint plan to secure industrial future of Grangemouth. https://www.gov.uk/government/news/uk-and-scottish-governments-announce-joint-plan-to-secure-industrial-future-of-grangemouth.
INEOS (2024) Operational announcement from INEOS Grangemouth. https://www.ineos.com/sites/grangemouth/news/operational-announcement-from-ineos-grangemouth/.
Just Transition Commission (2024) The Grangemouth Refinery Closure. https://www.justtransition.scot/wp-content/uploads/2024/07/The-Grangemouth-Refinery-Closure-Workers-Perspectives-web-edition.pdf.
Scottish Government (2025) Securing a future for Grangemouth: First Minister’s statement – 18 February 2025. https://www.gov.scot/publications/securing-a-future-for-grangemouth-first-ministers-statement-17-february-2025/.
Unite the Union (2024) Unite holds Labour government to account over Grangemouth and launches survival plan. https://www.unitetheunion.org/news-events/news/2024/november/unite-holds-labour-government-to-account-over-grangemouth-and-launches-survival-plan.
Department for Energy Security and Net Zero (2024) UK and Scottish governments announce joint plan to secure industrial future of Grangemouth. https://www.gov.uk/government/news/uk-and-scottish-governments-announce-joint-plan-to-secure-industrial-future-of-grangemouth.
EY (2025) Project Willow. https://scotent-uat-sdi-website.azurewebsites.net/media/vlubfykz/project-willow_pid_v214.pdf.
EY (2025) Project Willow. https://scotent-uat-sdi-website.azurewebsites.net/media/vlubfykz/project-willow_pid_v214.pdf.
UK Government (2025) Press release: Plans for future of Grangemouth. https://www.gov.uk/government/news/plans-for-future-of-grangemouth.
Department for Energy Security and Net Zero (2023) CCUS Clustering Sequencing Track-2. https://www.gov.uk/government/publications/cluster-sequencing-for-carbon-capture-usage-and-storage-ccus-track-2/ccus-cluster-sequencing-track-2-market-update-december-2023.
Department for Energy Security and Net Zero (2024) International industrial energy prices. https://www.gov.uk/government/statistical-data-sets/international-industrial-energy-prices.
Department for Energy Security and Net Zero (2023) Factsheet: UK Carbon Border Adjustment Mechanism. https://www.gov.uk/government/consultations/addressing-carbon-leakage-risk-to-support-decarbonisation/outcome/factsheet-uk-carbon-border-adjustment-mechanism#which-sectors-will-a-uk-cbam-initially-apply-to.
Just Transition Commission (2024) A Just Transition for Grangemouth. https://www.justtransition.scot/wp-content/uploads/2024/07/A-Just-Transition-for-Grangemouth-web-edition-1.pdf.
Just Transition Commission (2024) Measuring and Evaluating Success in the Scottish Just Transition. https://www.justtransition.scot/publication/measuring-and-evaluating-success-in-the-scottish-just-transition/.
Just Transition Commission (2024) A Just Transition for Grangemouth. https://www.justtransition.scot/wp-content/uploads/2024/07/A-Just-Transition-for-Grangemouth-web-edition-1.pdf.
Scottish Government (2023) Rural Scotland Data Dashboard: Overview. https://www.gov.scot/publications/rural-scotland-data-dashboard-overview/pages/2/.
Scottish Government (2021) Rural Scotland Key Facts 2021. https://www.gov.scot/publications/rural-scotland-key-facts-2021/pages/4/.
Scottish Government (2019) Scotland’s Forestry Strategy 2019-2029. https://www.gov.scot/binaries/content/documents/govscot/publications/strategy-plan/2019/02/scotlands-forestry-strategy-20192029/documents/scotlands-forestry-strategy-2019-2029/scotlands-forestry-strategy-2019-2029/govscot%3Adocument/scotlands-forestry-strategy-2019-2029.pdf.
Highlands and Islands Enterprise (2023) Highlands and Islands Enterprise Strategy 2023-2028. https://www.hie.co.uk/media/vczc0zca/hie-strategy-2023-28-final-031023.pdf.
South of Scotland Enterprise (2021) Powering Change. https://www.southofscotlandenterprise.com/media/ekjhha54/powering-change-calling-the-south-of-scotland-to-action-final.pdf.
Scottish Government (2021) Scottish House Condition Survey: Local Authority Analysis 2017-2019. https://www.gov.scot/publications/scottish-house-condition-survey-local-authority-analysis-2017-2019/pages/7/.
Figures quoted here for extreme fuel poverty in the Western Isles should not be directly compared to figures for the rest of Scotland in the Scottish House Condition Survey, as these figures are from different surveys with different methods and sample sizes, and were recorded over different time periods.
The Energy Advisory Service (2024) Affordable Warmth at Home in the Western Isles. https://tighean.co.uk/wp-content/uploads/2024/06/Warmth-Booklet-2024.pdf.


Topics
Back to top